

[Important] Review of USD/JPY from February 23 to February 28 to apply insights for next week
Reviews & videos can be viewed here
Good morning everyone.
This morning I plan to examine how USD/JPY moved last week and show readers various applications of that analysis.
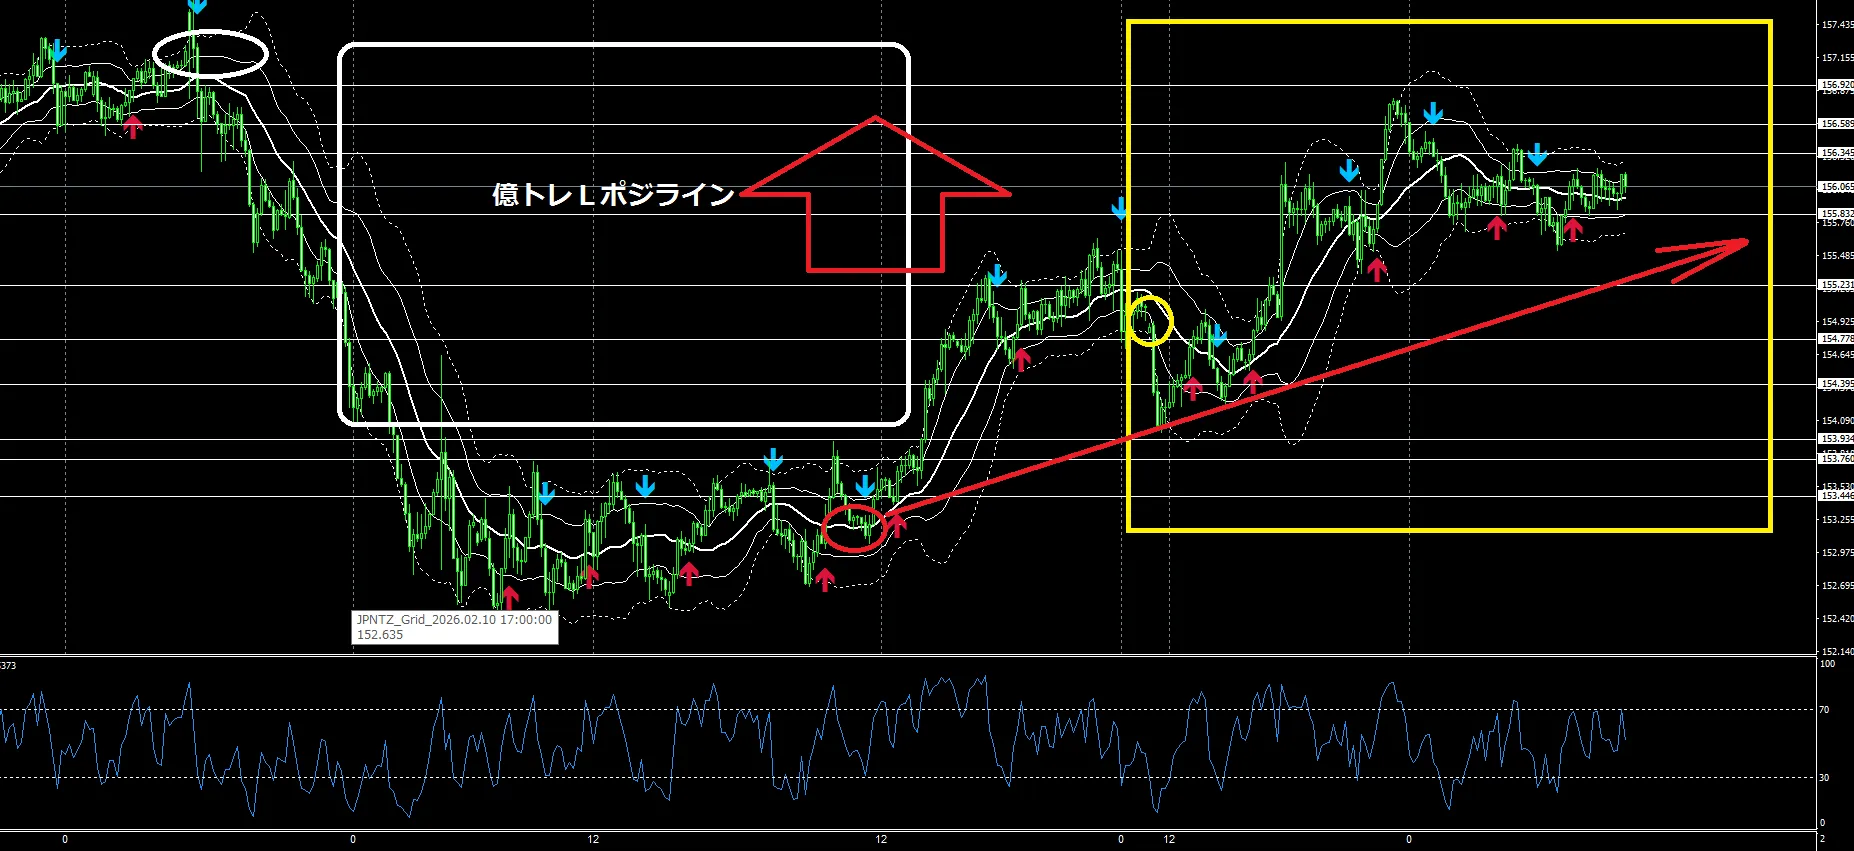
First, on Monday there was a ↓ gap with a yellow circle, a temporary decline, then a series of twists and turns, but the 1-hour uptrend was maintained; toward the end of the week the uptrend collapsed, and on the final day it moved in a range.
USD/JPY 1-hour chart MT4

The white circle at far left indicates near the temporary goal visible on the Billion-dollar Trader 1-hour chart.
From near the red circle where the 1-hour chart turned bullish, following white multiple-billion-trader lines, the chart is forming an uptrend.
The multiple-billion-trader lines are drawn after the bullish signal on the red circle.
Last week it was in the yellow □ zone, but through mid-week it showed higher highs and higher lows in an uptrend; toward the end, it failed to make new highs and created a downtrend, finishing the final day in a range without new highs or lows.
What I want you to confirm here is that when the 1-hour chart’s Billion-dollar Trader chart turns bullish, the trend tends to continue for a while, and it moves upward while keeping the Billion-dollar Trader line in mind.
The long red arrow indicates the rising zone.
For Billion-dollar Trader users, if you align a 1-minute chart buy signal with the 1-hour chart, you can place a long position without any loss in theory.
However, the market is not so forgiving.
That is why there is a 1-minute Billion-dollar Trader line; by taking positions along that line you can reduce risk further.
The Billion-dollar Trader chart pairs very well with the 1-hour and 1-minute charts.
If it goes up after you buy...
In such cases, please stay calm and have the capacity and foresight to take an L position at the next lower Billion-dollar Trader line.
This is only a matter of hindsight, but
it tends to rise in the end.
This time I included a slightly modified version of the repaint-free trading indicator used in the 1-hour chart by “Blue Sky EA” and “億スキャインジ” (Okiku Trader Indices).
The blue-red arrow sign is that indicator.
Currently a new product is in production for “Gold Trade.”
Well, it sells fairly well, but it’s of a different dimension from products created by so-called traders who get slammed in reviews and communities.
There are few Billion-dollar Trader EA users because the product price is high, but the trade reports from users are perfect.
People who have never traded before
say, “I’ll win with a product that uses multiple trend indicators and a vague setup.”
There is no way to win with such a product.
If trade signals light up for discretionary trading results, I can understand, but
can someone who has never traded win with something made solely from PC skills?
If that were possible, then employees of companies like N〇C or Tom〇com would not need to quit their jobs because they’re PC-savvy, right? lol
That kind of reality does not exist in the trading world.
Conversely, do you have such a person nearby?
Trading signals are something a discretionary trader uses as insurance.
In other words, if the discretionary long position and the buy/sell signals are the same, you would consider buying.
If that doesn’t work, you could try entering in the opposite direction with all signals…
This also doesn’t work.
In the end, people who don’t understand trading will only get lucky breaks.
It’s like probabilities in a pachinko parlor.
Now this buy/sell signal lights up within about 30 minutes from the start price and does not disappear. It does not repaint.
For Billion-dollar Trader users, once this signal appears, you can take a position from the buy/sell turning on the 1-minute chart.
Alternatively, you can enter when the buy/sell signals on the 1-minute Billion-dollar Trader chart and the 1-hour chart align in the same direction.
Since it’s the 1-hour chart, once the signal appears, you’ll be trading on the 1-minute chart for a few minutes to about 15 minutes.
Also, when other companies’ purchased signals are not performing well,
you can buy Billion-dollar Trader scalping and align your own buy/sell signals with the Billion-dollar Trader chart direction.
Because buy/sell signals are sold as combinations of trend indicators, even after the Billion-dollar Trader chart turns to sell or buy, there is still ample time.
If you trade only with buy/sell signals, you get whipsawed in ranges, and when you buy, sell signals appear and you take losses...
Well, that’s the pattern.
Isn’t it true that you can only win sporadically when the trend continues by luck?
This is something that has been repeated for over 20 years, so people in their 20s probably don’t know this yet.
Do you think 30-something traders know this too…
So, those who fail with buy/sell signals or EA should first learn how to trade, and then combine the purchased buy/sell signals with that method.
To master that method,
For traders who absolutely want to succeed in trading, who think it would be wonderful to make a living from trading, this is the product I recommend, and it’s a technique you can learn on your own:
As for USD/JPY yesterday, it moved as described in yesterday’s article.
× ![]()