

2/27 Today's USD/JPY Trading Strategy
Reviews & videos can be viewed here
Good morning everyone.
Yesterday’s USD/JPY moved as described in yesterday’s article.
The point is that after the decline it formed a range, and then it retraced.
USD/JPY 1-hour & 1-minute charts
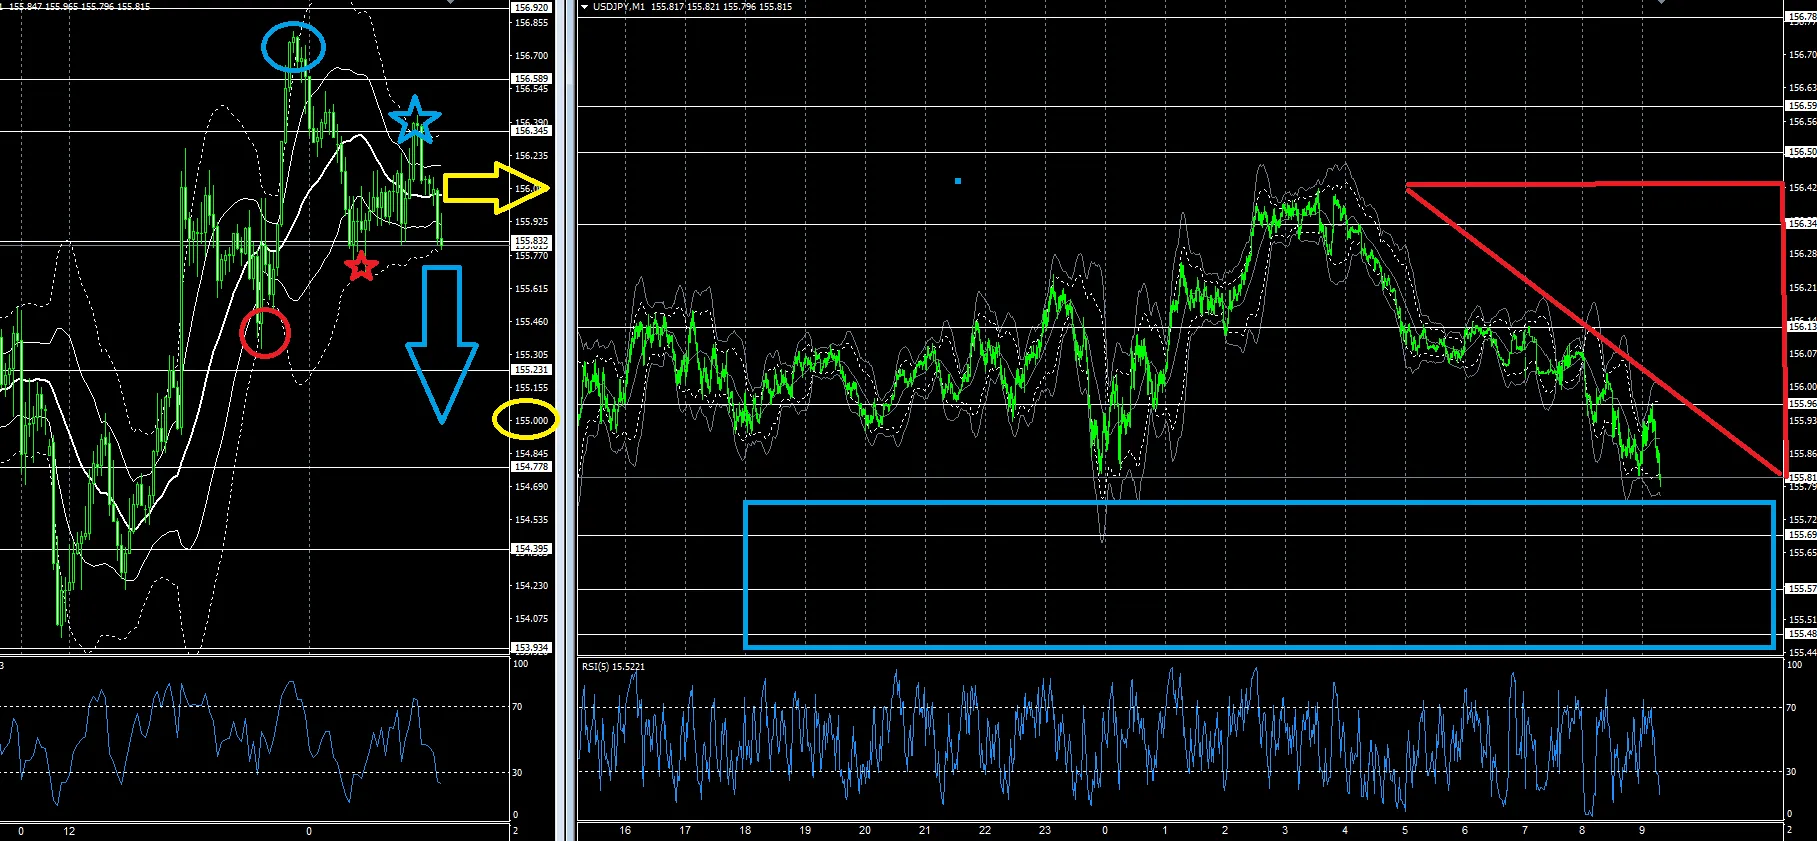
It aimed for the blue circle high but didn’t reach it, reversing with a blue star and falling.
At this stage, the uptrend appears to have ended for now.
Then, generally, charts move in the order trend → range → trend, so if we are in a range now, the question is whether the next move will be a continued rise or a fall.
Could a downtrend start from here?
If that is the case, since the blue star cannot exceed its high, and if the recent low (red star) is broken, we would judge that a downtrend has begun.
And if that downtrend continues, watching for a break of the red circle could lead toward 15,500.
That is my view, and if you study the scalping tips of billion-dollar traders closely, you can also envision this scenario.
That said, this is only about whether the trend is continuing or ending, which is simple.
However, many people tend to overlook this simple point.
If you are always mindful of it...
If you check before entering the market...
This is what you should keep in mind.
The way to read this chart is the same on both 1-minute and 5-minute charts, so let's remember this.
And from here you take a position, and at that time the Billionaire Trader chart and Billionaire Trader lines are extremely useful.
Billionaire Trader users, please view this article with awareness of the trend definition on the hourly chart and the buy/sell switching on the 1-minute Billionaire Trader chart.
Thank you for your continued support today as well.
If you are a trader who desperately wants to succeed in trading, who wants to earn a living from trading, this is the product I recommend, and it is a trading technique that you can learn on your own, here it is ↓
× ![]()