

The translated HTML content is: 2026/02/27 Gold analysis
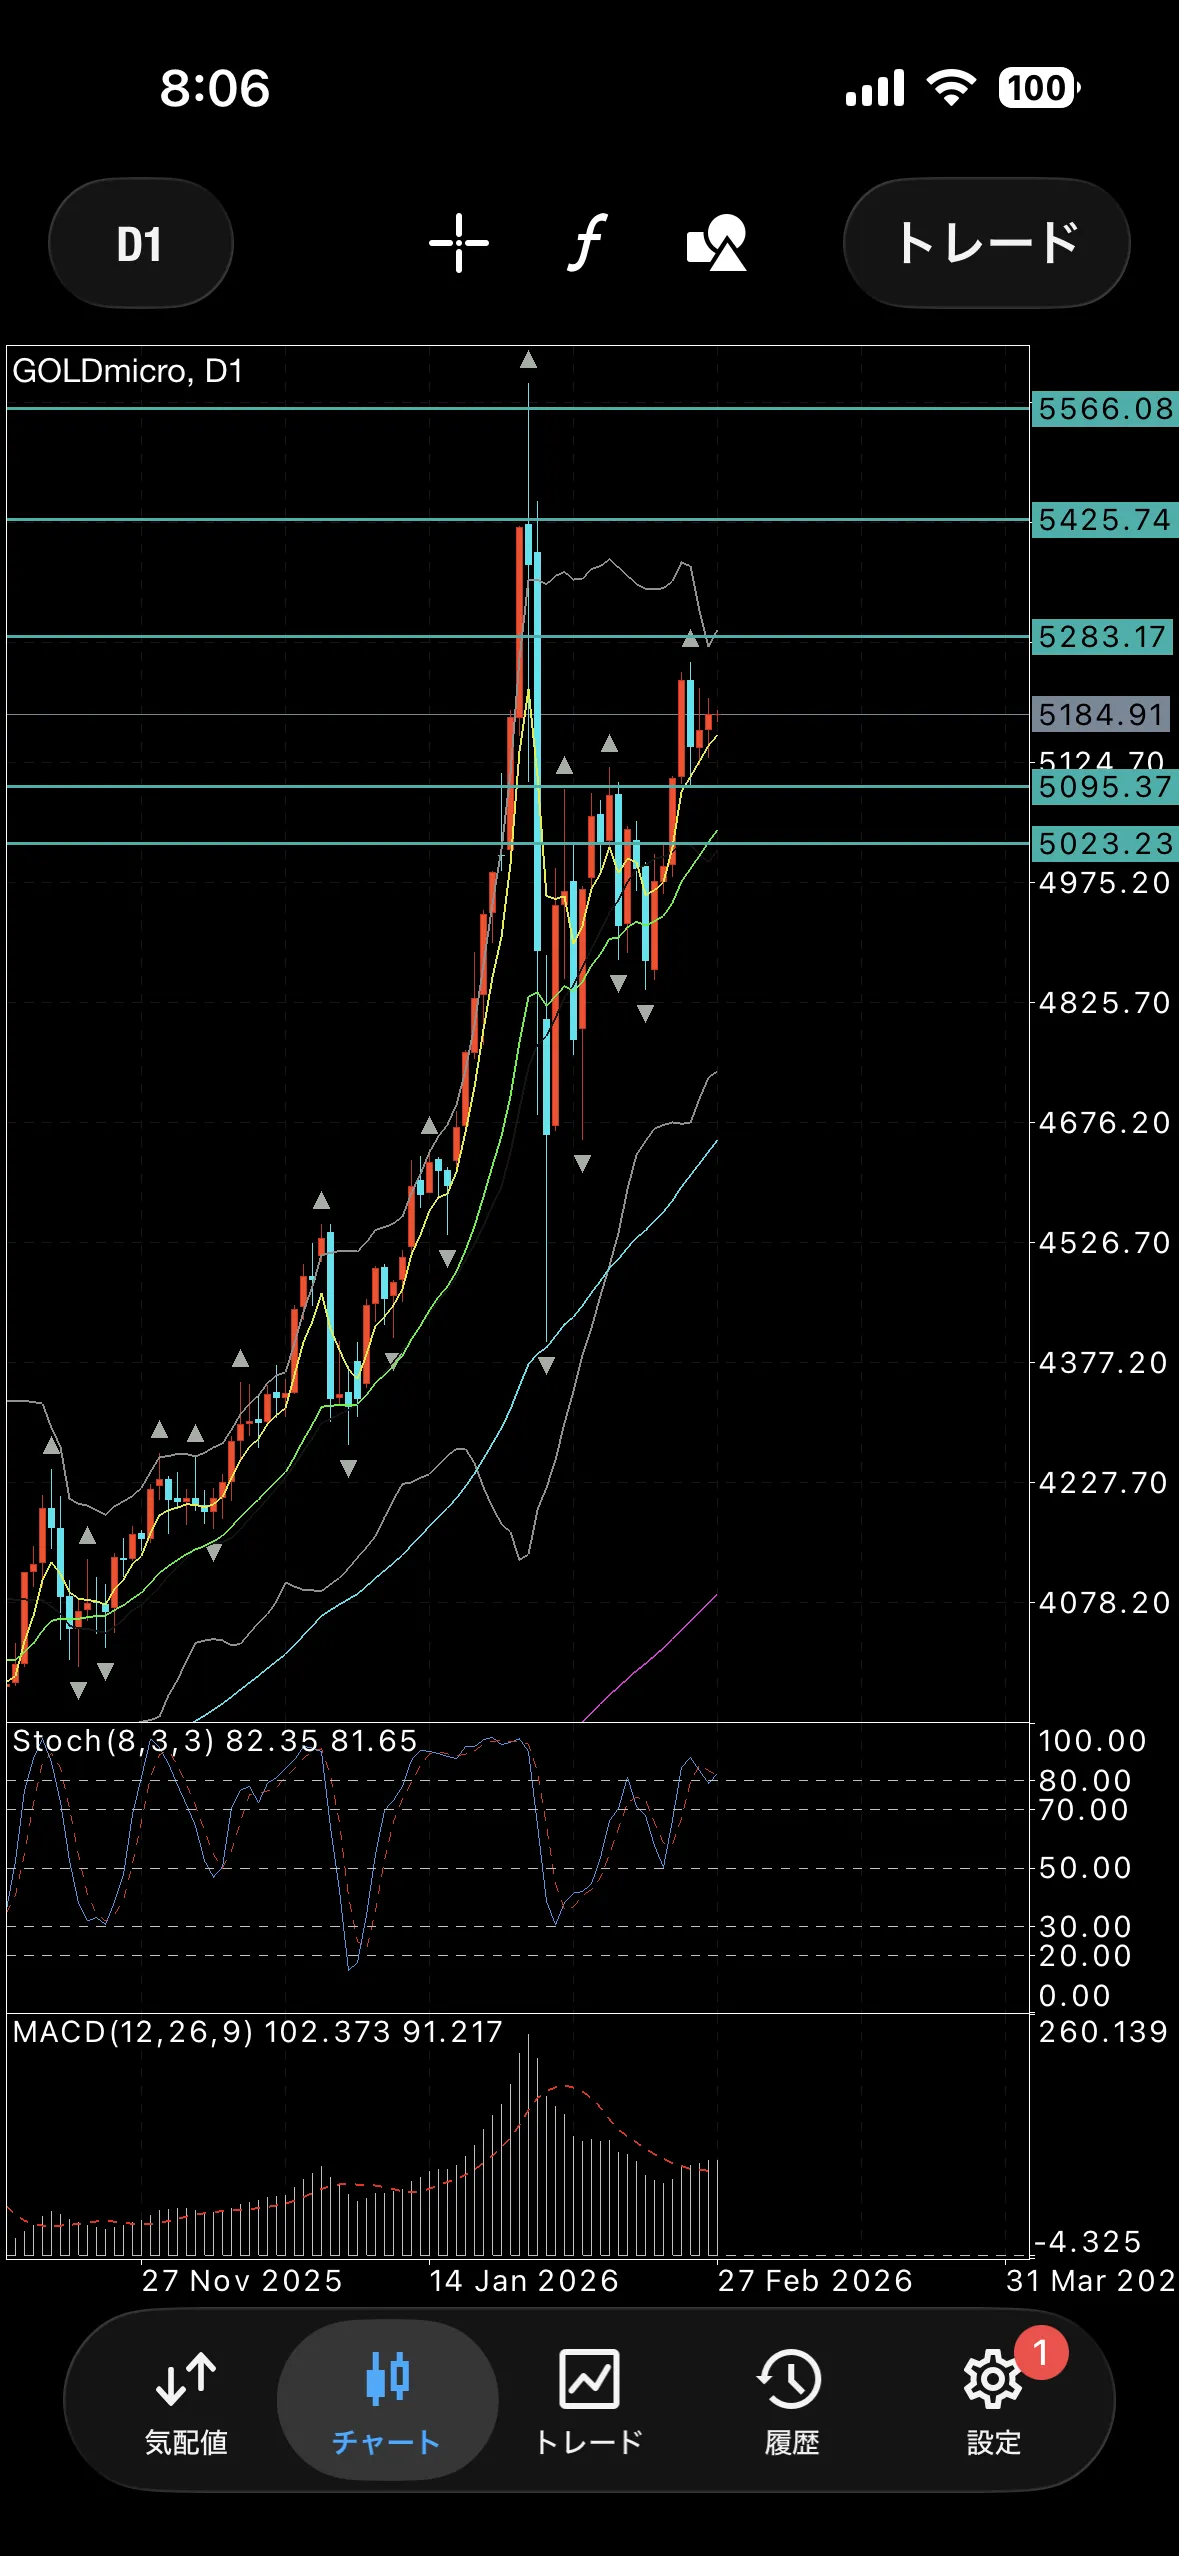
Yesterday's Gold daily chart was a bullish candle.
Today is the weekend and the end of the month, so extreme price movement is expected.
If you trade, it might be better to keep it short-term, or trade on the monthly or weekly chart with smaller lot sizes.
Especially caution with long-term positions.
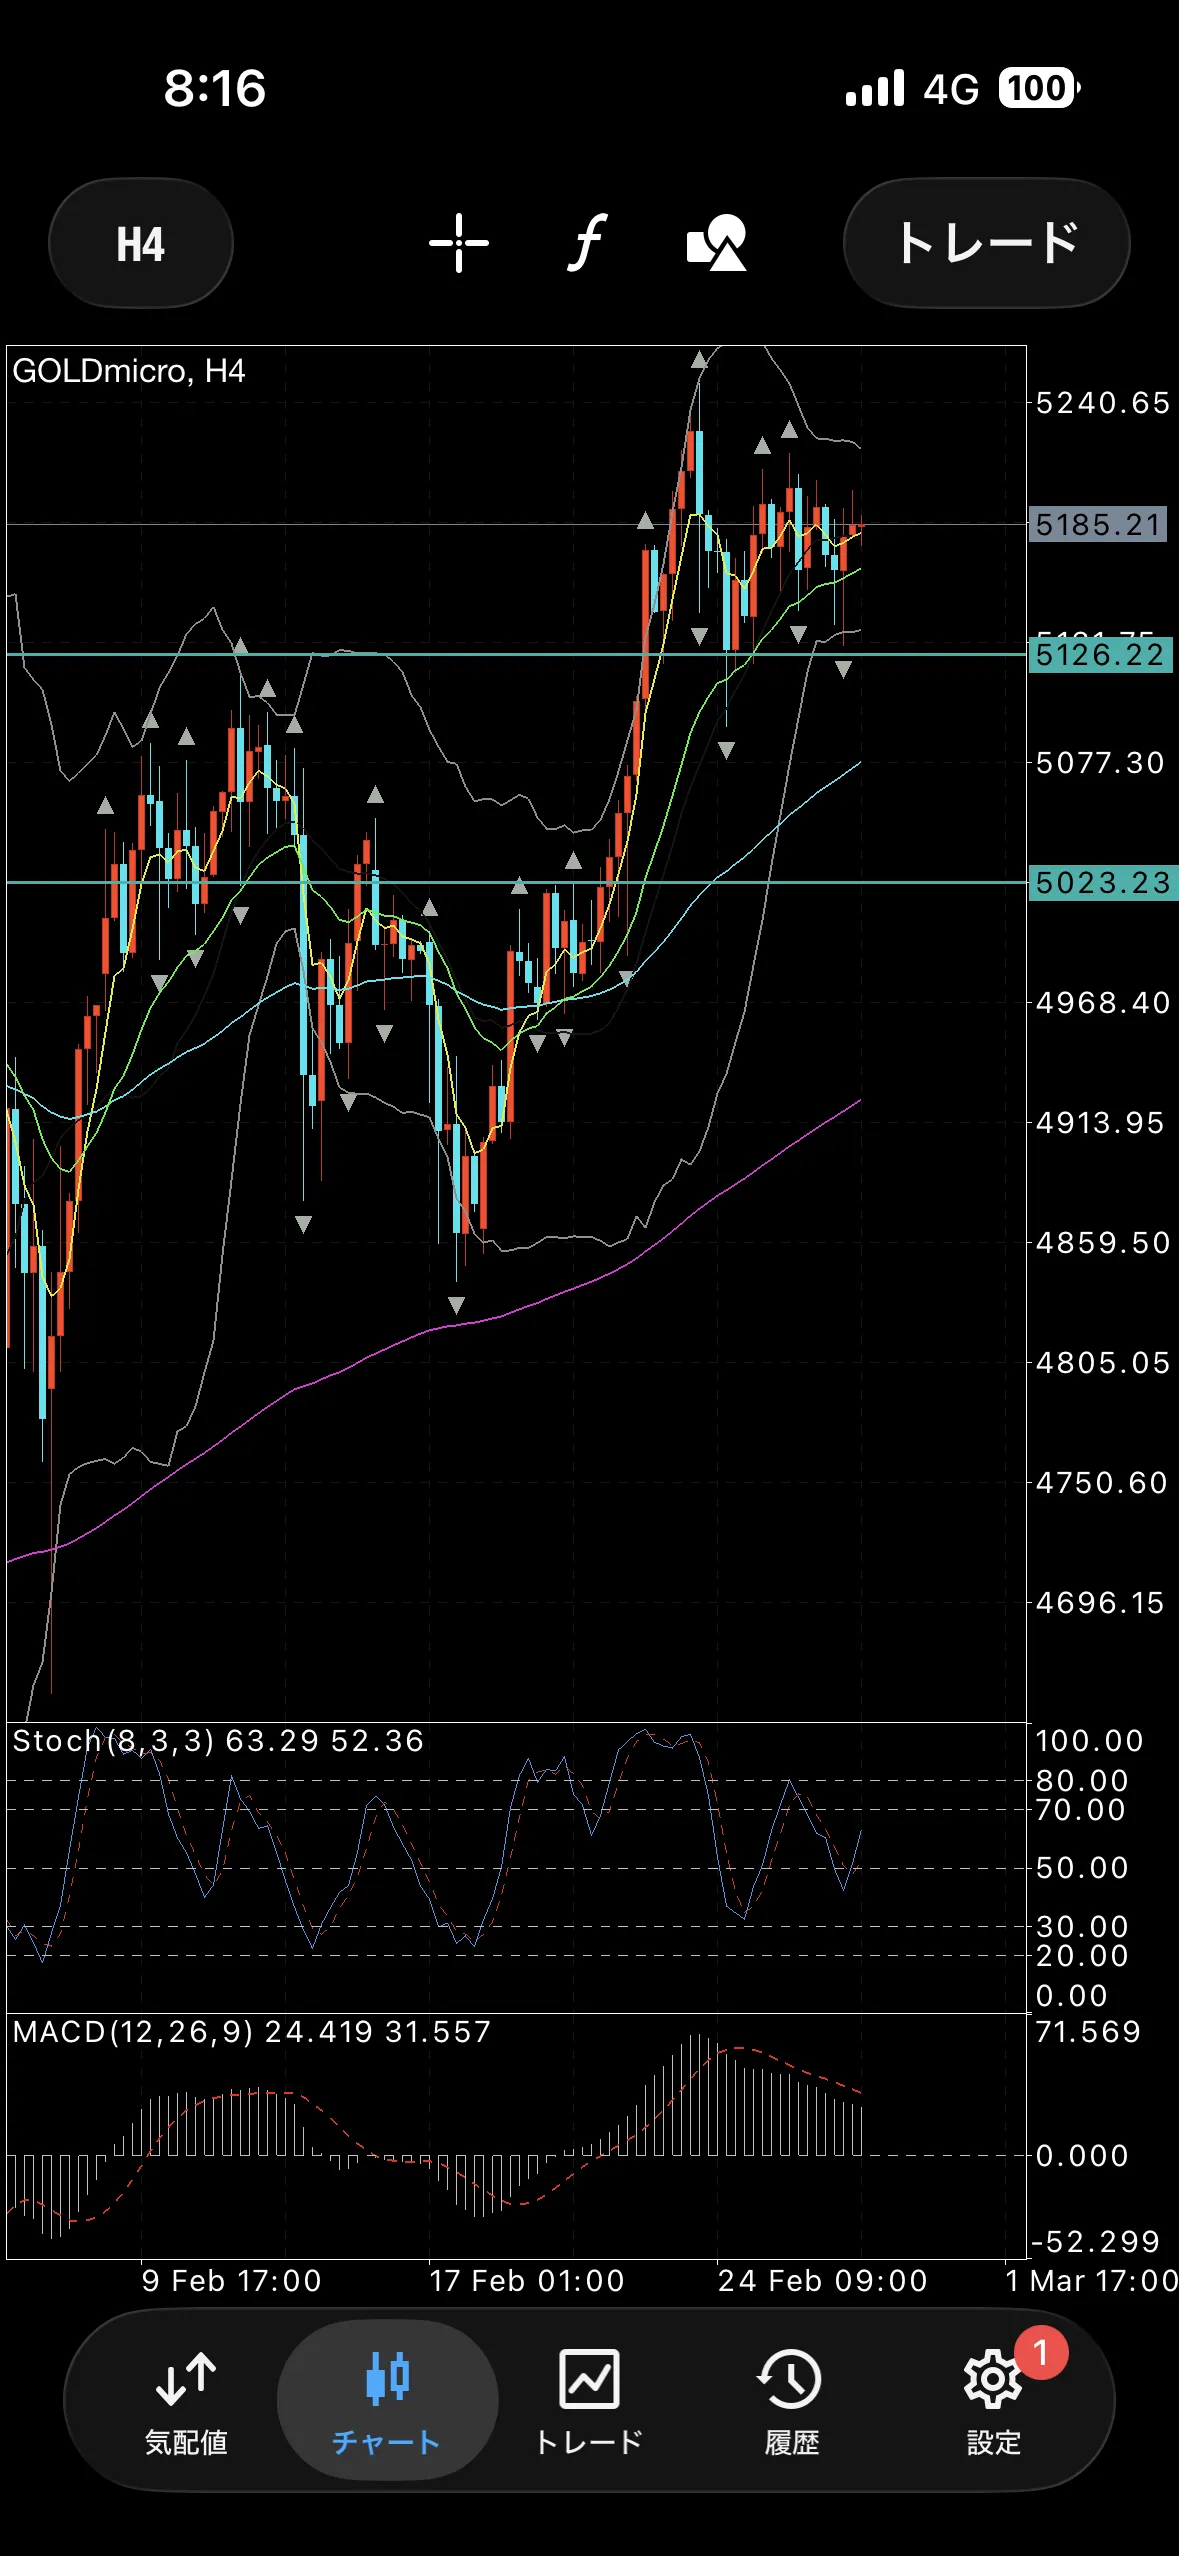
The 4-hour chart is in a rising trend that seems like a dream.
Although a sharp drop is not impossible, the basic expectation is for a buying market.
It seems OK to buy until the breakout below around the 5126 level or below the 20MA level of Out-Sai is avoided.
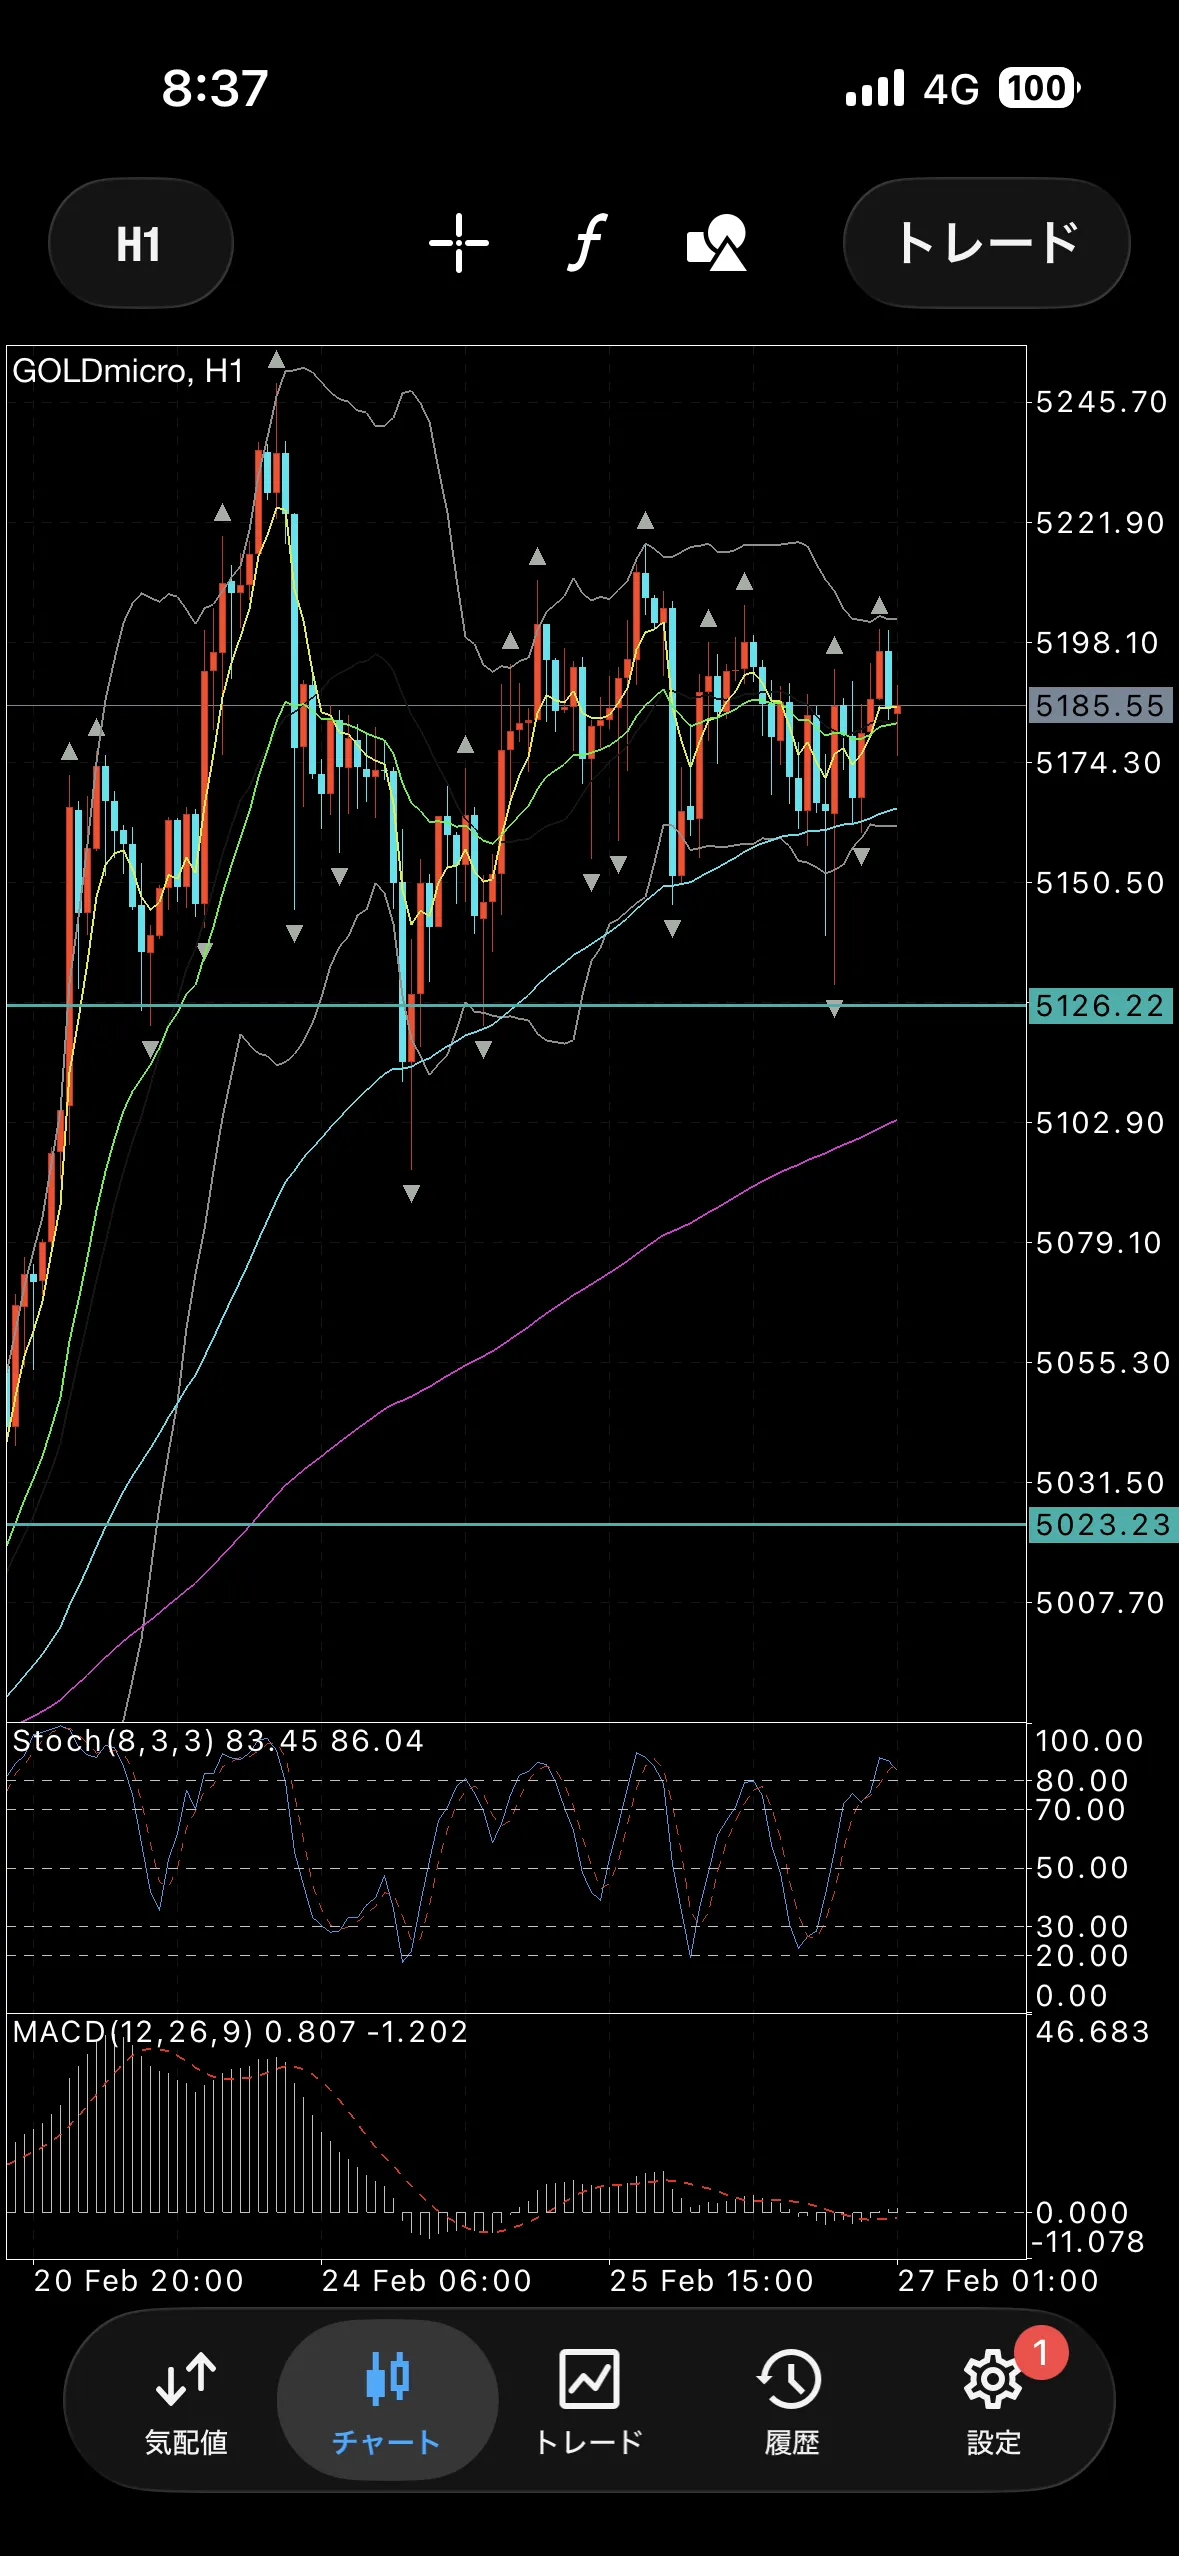
The hourly chart is forming a triangle, but since there is a regular pattern around the 75MA, if it breaks below this level, there is a high likelihood of further decline as stop-losses are triggered.
Conversely, backing this MA, there might be a long opportunity?
Defense line for buying
5126
5023
Defense line for selling
Around 5236
5425
5566