
#30 : Outsmarting the monitoring of vendors - A冷徹な code that turns 70% of losses into profit
0
Two weeks of苦しみ seen through
If you do it manually, there is a “Crossline Method” that you can judge at a glance from the chart.
However, perfectly reproducing this in the world of programming was an unimaginably difficult task.
Just like the previous “Beard Shaving Method,” the biggest hurdle was giving the program a “human eye.”
How to replace the instinctive feeling of looking at a chart and thinking “Ah, this is it” with cold, digital data.
In that one aspect, I tasted disappointment many times.
Honestly, turning this method into an EA was halfway to giving up.
Sudden success!
However, the success arrived far too abruptly and in a ironic way.
The previous EA relied on the logic of trimming the “wicks” of candlesticks, so it used the close of the 1-minute chart as the criterion.
Ideally, I would want to use tick data, but considering the enormous load of downloads and backtests, it was impossible for an individual.
Following that flow this time as well, I tested a kind of “dense” control that captures the big trend on daily, 4-hour, and 1-hour charts, while decision-making for entries and exits was based on 1-minute moves.
But no matter what I tweaked, the result was defeat or, at best, only a small profit.
The more complex it became, the more it felt distant from the essence of the market.
After hitting a wall, I briefly returned to my初心 (beginnings).
“When humans trade this method, aren’t we only looking at the base timeframe (D1, H4, H1) to begin with?”
If so, what would happen if I entrusted all judgments to only the close of the base timeframe?
Open orders, take profits, and stop losses would all be executed after the base timeframe’s close is confirmed…
With that decision, I ran tests with a simple source code pared down to the extreme.
“There will be profit, but the drawdown will surely be quite large as well.”
That was my expectation.
However, when I saw the graph on the monitor, I doubted my own eyes.
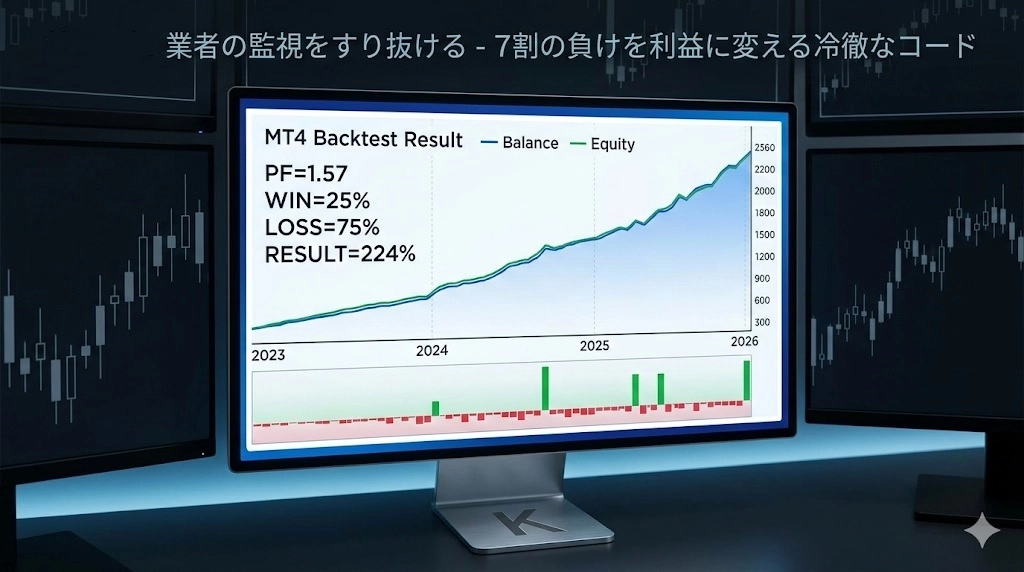
Over the entire three years of backtesting, the line of usable equity and the balance overlapped almost like a single thread.
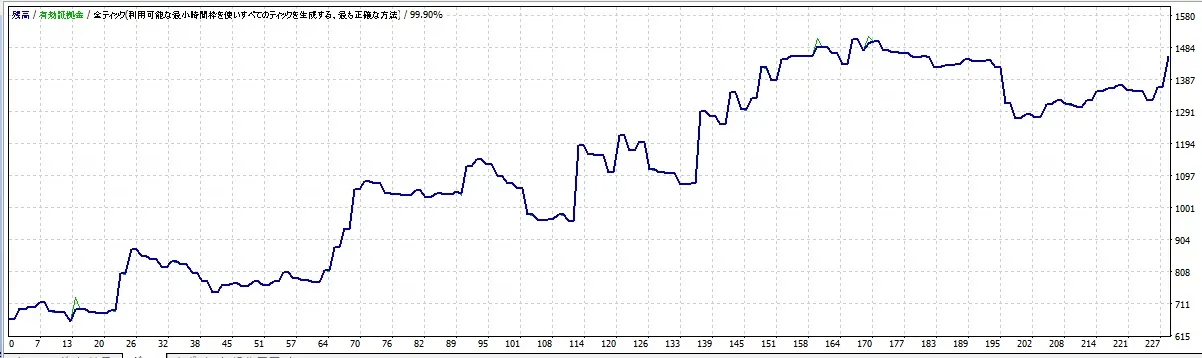
What does this mean?
It means there is no unrealized loss at all.
From the moment a position is held until the moment it is decided, capital moves without stagnation.
In other words, the more capital you have, the more profits you can gain while keeping risk to a minimum—the ideal form.
Loss rate 75% (laughs)
And what is notable is that win rate.
A mere “25%.”
The loss rate is three times that at “75%.”
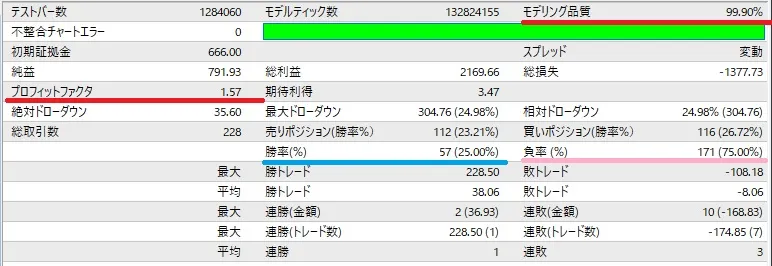
This low win rate is the greatest weapon of this EA.
A CEO-level EA with too high a win rate would attract attention from brokers’ algorithms and be hunted down quickly.
However, with this code that “loses small and beautifully” more than 70% of the time, it can slip through brokers’ monitoring nets with a cool face.
Amazingly, after running a backtest once with this new logic, there was no need to modify the source or optimize external variables.
In fact, this EA has no external variables that need optimization at all.
As if the two weeks of苦闘 were a lie, the “Crossline Method” suddenly completed.
A冷徹な code, feeding on 70% losses, steadily pushes assets to 2.24 times.
This was the “real” form I had been pursuing.
Next time:
I plan to submit to Gogojan… (intended)
List of paid content
A method that wins even without scalping: Beard Shaving Method https://www.gogojungle.co.jp/finance/navi/articles/109460
150 yen! Cheap!... Boss, cheap! ٩(ˊᗜˋ*)و
9 out of 10 of your losing trades are broker-made scams.
How to prevent that?
E-book: [Broker Countermeasures] Beard Shaving Method in the Era of Prohibition on Scalping
× ![]()