
Today's macro correlation: "A 'unusual correlation' that occurred before the Iran nuclear talks" [February 26, 2026]
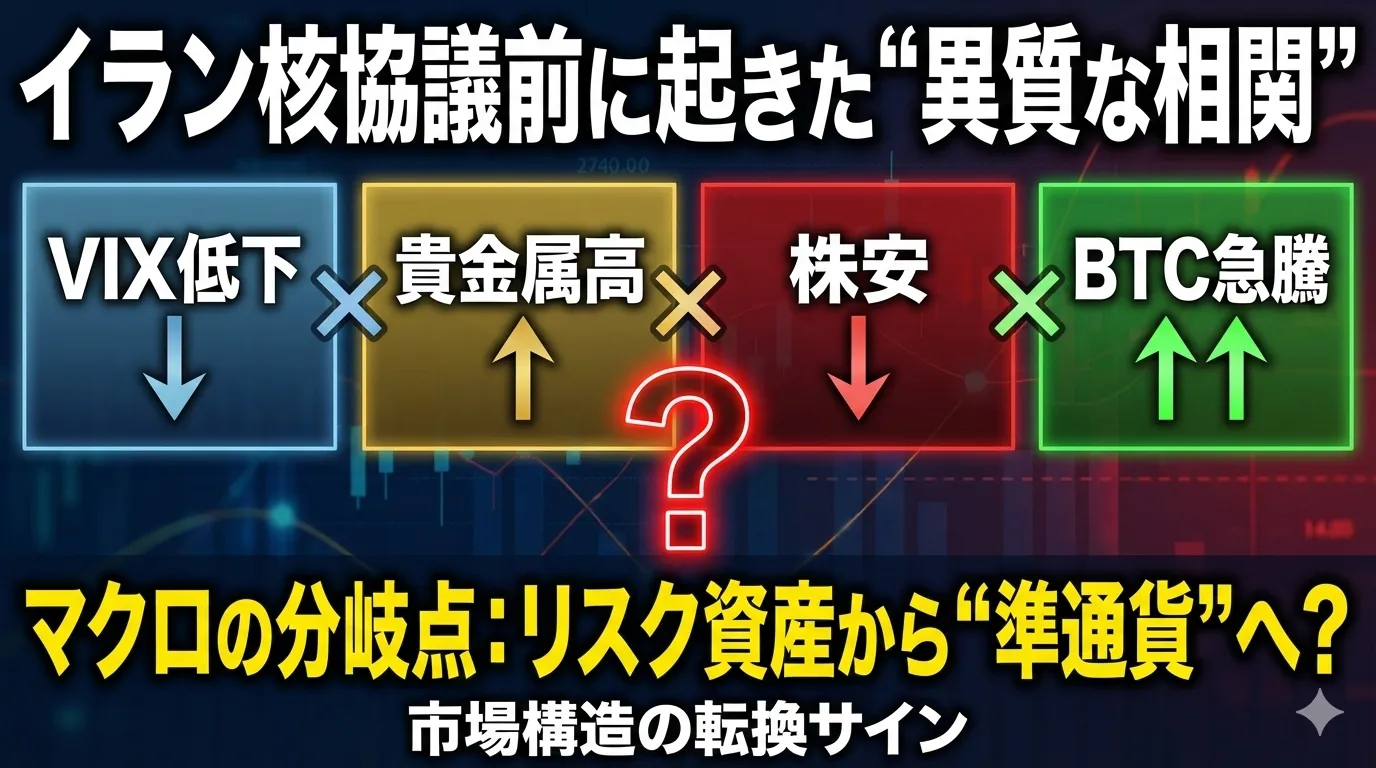
An Unusual Correlation That Occurred Before the Iran Nuclear Deal Talks
— Meaning of a Decline in VIX × Rise in Precious Metals × Stock Decline × Sudden BTC Rally —
Today, a very interesting correlation structure appeared.
Ahead of the Iran nuclear talks
VIX fell
Precious metals rose
U.S. and Japanese stocks fell
AndBitcoin surged
This is a combination that is hard to explain with a standard macro textbook.
In this article,
① Factors behind recent BTC decline
② Recent capital flow structure
③ Why this rebound occurred
④ What has broken macro-consistently
⑤ Possible future scenario branches
— organized into five structures.
① Essential factors behind the recent BTC decline
To understand the sudden rally, we must first break down the reasons for the decline.
▼ Recent pullback factors
Risk asset compression accompanying the stock market correction
Unwinding of leveraged positions
Outflows via ETFs
Temporary tightening of dollar liquidity
Speculative positions being unwound due to Iran-related uncertainty
Risk asset compression accompanying the stock market correction
Unwinding of leveraged positions
Outflows via ETFs
Temporary tightening of dollar liquidity
Speculative positions being unwound due to Iran-related uncertainty
What was especially important was
the unwinding (reversal) of speculative funds
BTC still retains a high-beta asset characteristic and
continued to have a positive correlation with Nasdaq.
In other words, the recent decline was
not a credit-contraction type
but a leverage-cleaning type
of decline.
This is not structural bearishness.
② Capital flow that supported this rally
This rise is not merely a short-cover rally.
▼ Observable flow structure
Front-month futures short-covering squeeze
Increased call buying in the options market
Inflow into spot exchanges
Signs of inflows via ETFs
Increased issuance of stablecoins
Front-month futures short-covering squeeze
Increased call buying in the options market
Inflow into spot exchanges
Signs of inflows via ETFs
Increased issuance of stablecoins
What’s important here is
Stocks are falling while BTC is rising
This suggests
not a “risk-on recovery,” but another type of demand
is signaling.
③ Abnormal structure: VIX low × precious metals high
Normally:
Geopolitical risk rises → VIX rises
Anxiety increases → gold rises
Stocks fall
But today:
VIX falls
Precious metals rise
Stocks fall
This is a twist in the structure.
What does it mean?
The answer is:
A simultaneous existence of
“a stock-market-specific adjustment”
and “a quiet watchfulness toward currency and credit.”
④ Meaning of BTC surge: from risk assets to a “near-currency”?
This is the essence.
BTC typically moves as:
rises in risk-on environments
falls in risk-off environments
But today:
stock decline
gold rise
VIX decline
BTC rise
In other words,
BTC began to move differently from equities.
This is a breakdown of the correlation.
If this movement continues,
BTC = from a purely high-beta asset
to
BTC = a currency-diversification asset
potentially shifting toward.
⑤ The meaning of timing before the Iran nuclear talks
The premise today is the Iran situation.
If an agreement is reached:
Oil falls
Inflation concerns ease
Dollar weakness pressure
If talks break down:
Oil surges
Inflation reignites
Risk assets adjust
The market stands at that fork.
And what is happening now is:
“Pre-positioning”
Stocks shrink risk
Gold as insurance
BTC as currency diversification
This represents a potential multi-faceted strategy.
⑥ The current locus of macro correlations
To summarize today's correlation characteristics:
Stock × BTC correlation is fading
→ Softening of traditional risk-on structure
Gold × BTC moving in the same direction
→ Re-emergence of the digital-gold hypothesis
VIX at low levels
→ Not panic
Precious metals high
→ Quiet credit vigil
This is
“an entry point of soft credit concerns”
potentially.
⑦ What this rebound might mean
There are three possible scenarios.
Scenario A: Short-cover-type temporary rebound
→ If stocks continue to fall, BTC may fall again
Scenario B: Widespread currency-diversification demand
→ BTC and gold stay elevated together
Scenario C: Liquidity expansionary rebound
→ Stocks follow higher
In the current configuration, the most interesting is the seed of Scenario B.
⑧ Indicators to watch going forward
30-day correlation BTC × GOLD
Continued decline in stock × BTC correlation
ETF net inflow data
Stablecoin issuance volume
Credit spreads
30-day correlation BTC × GOLD
Continued decline in stock × BTC correlation
ETF net inflow data
Stablecoin issuance volume
Credit spreads
If these are corroborated,
the structural change becomes evident.
In conclusion, consider the following.
Today's market may not be merely a rebound.
VIX fell
Stock decline
Gold rise
BTC surge
This is a signal of a “macro turning point.”
If BTC begins to detach from equities and move independently,
that would signify a shift in market structure.
Right now it is still a sign.
But the very fact that correlations are breaking is the strongest signal of all.
This may present a once-in-a-years opportunity.