

Gold Analysis 2026/02/25
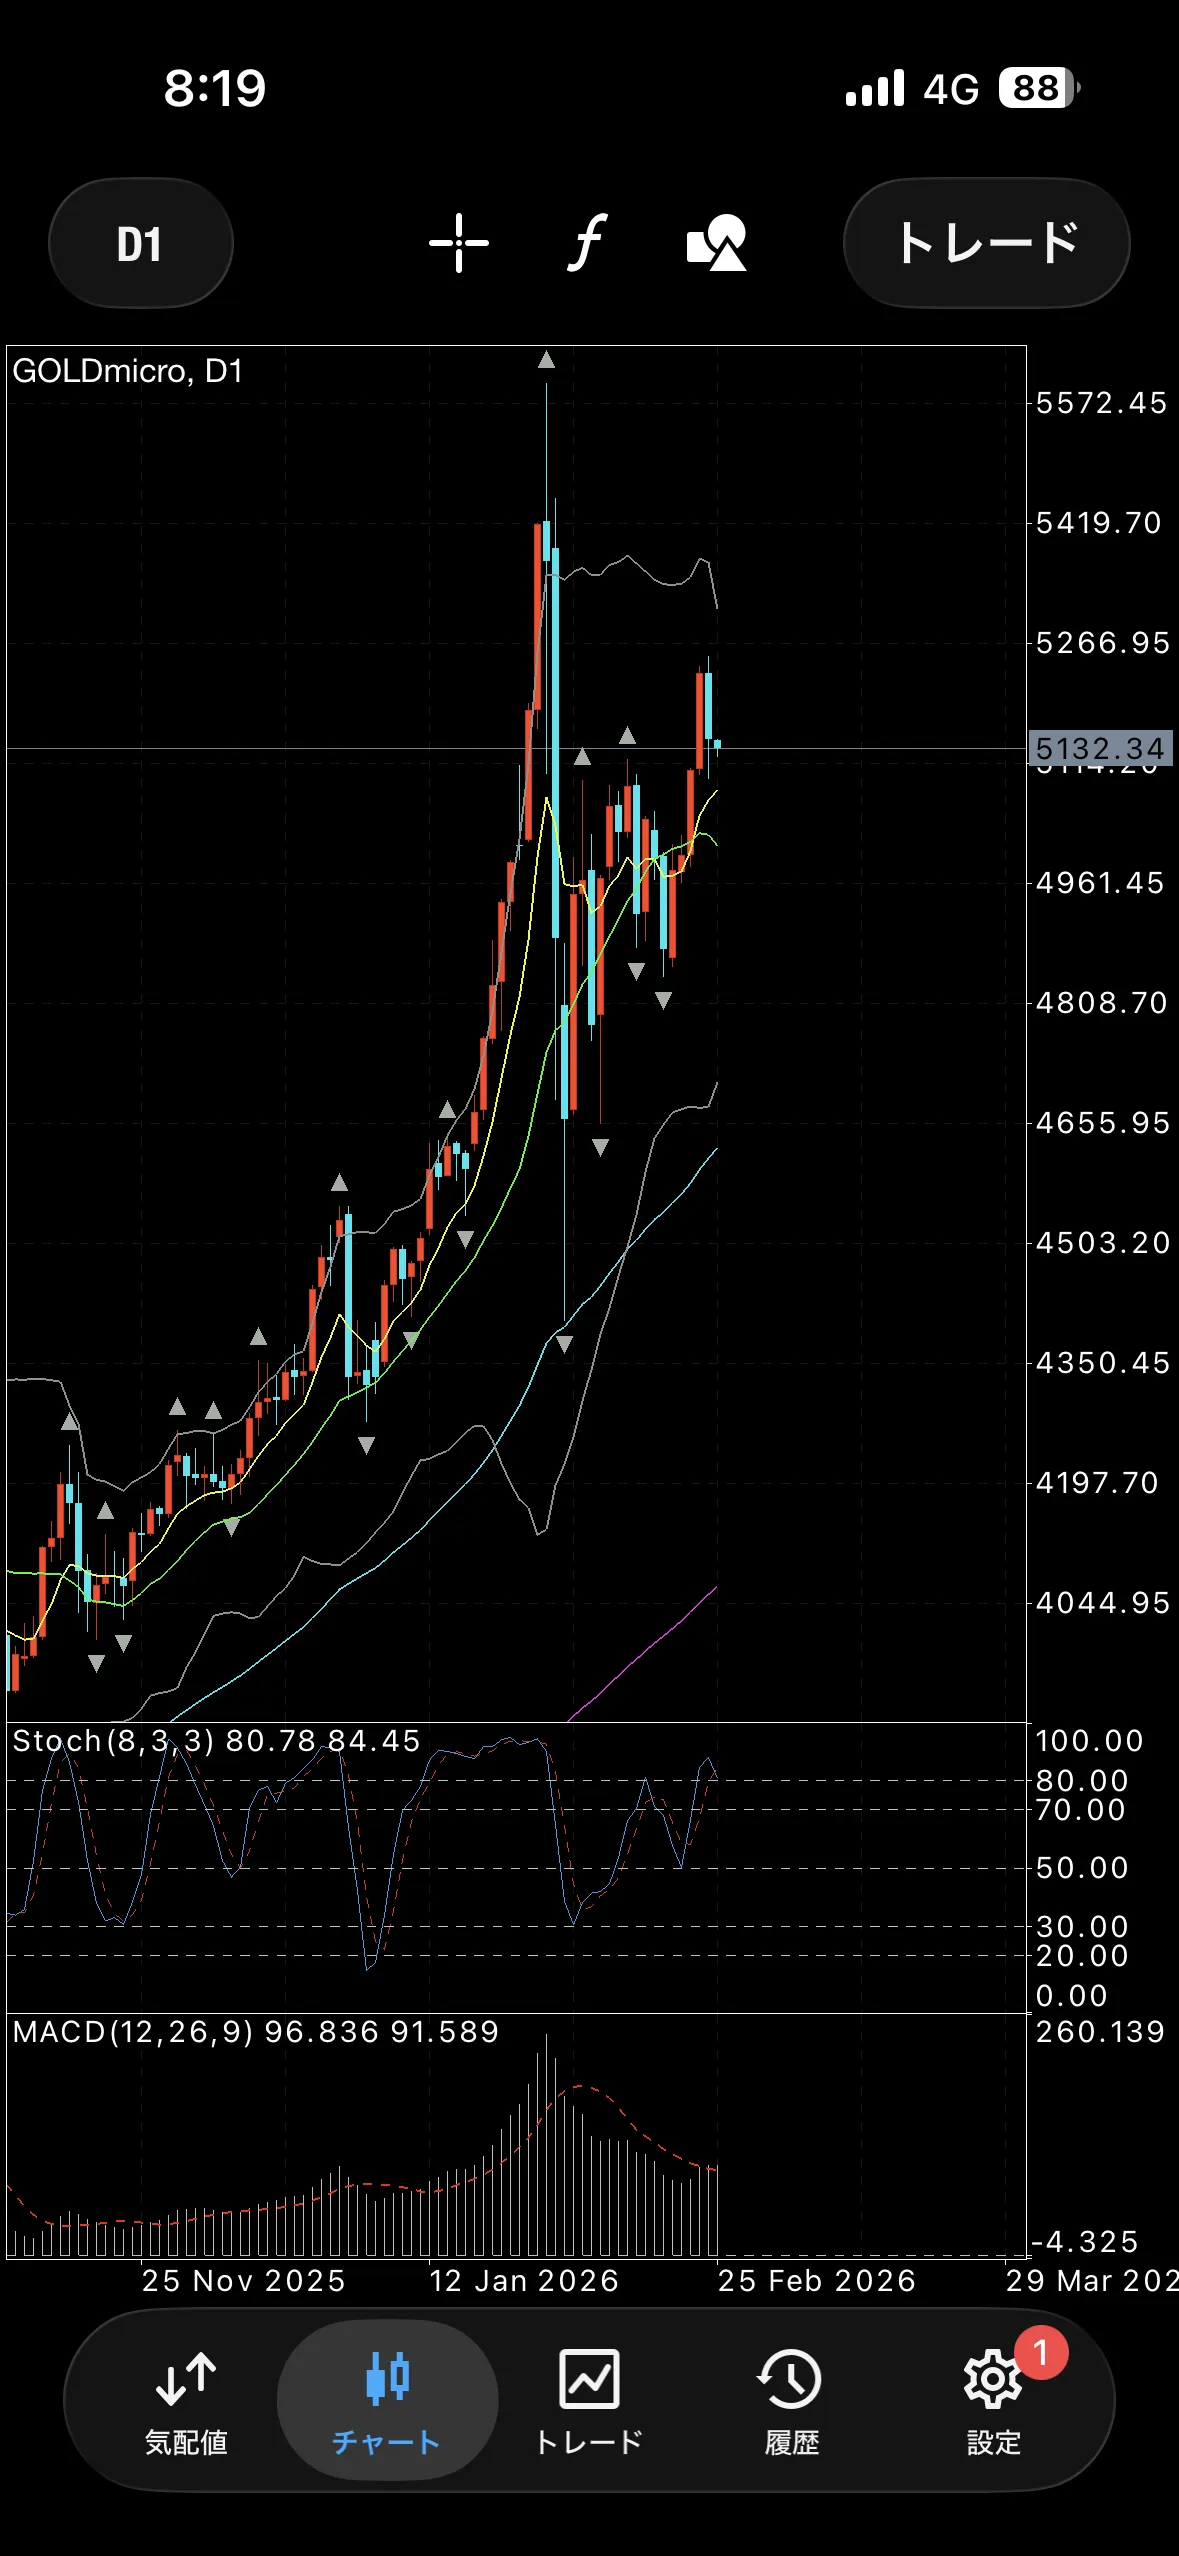
Yesterday, 2/24, the gold daily chart showed a lower shadow bearish candle.
It fell from near the Bollinger Band 1σ territory without exceeding the high of the big bearish candle, but the short-term MA has crossed, indicating a slight bullish bias.
On the 4-hour level, it has surpassed the high.
Today, attention is on whether it will form a pullback.
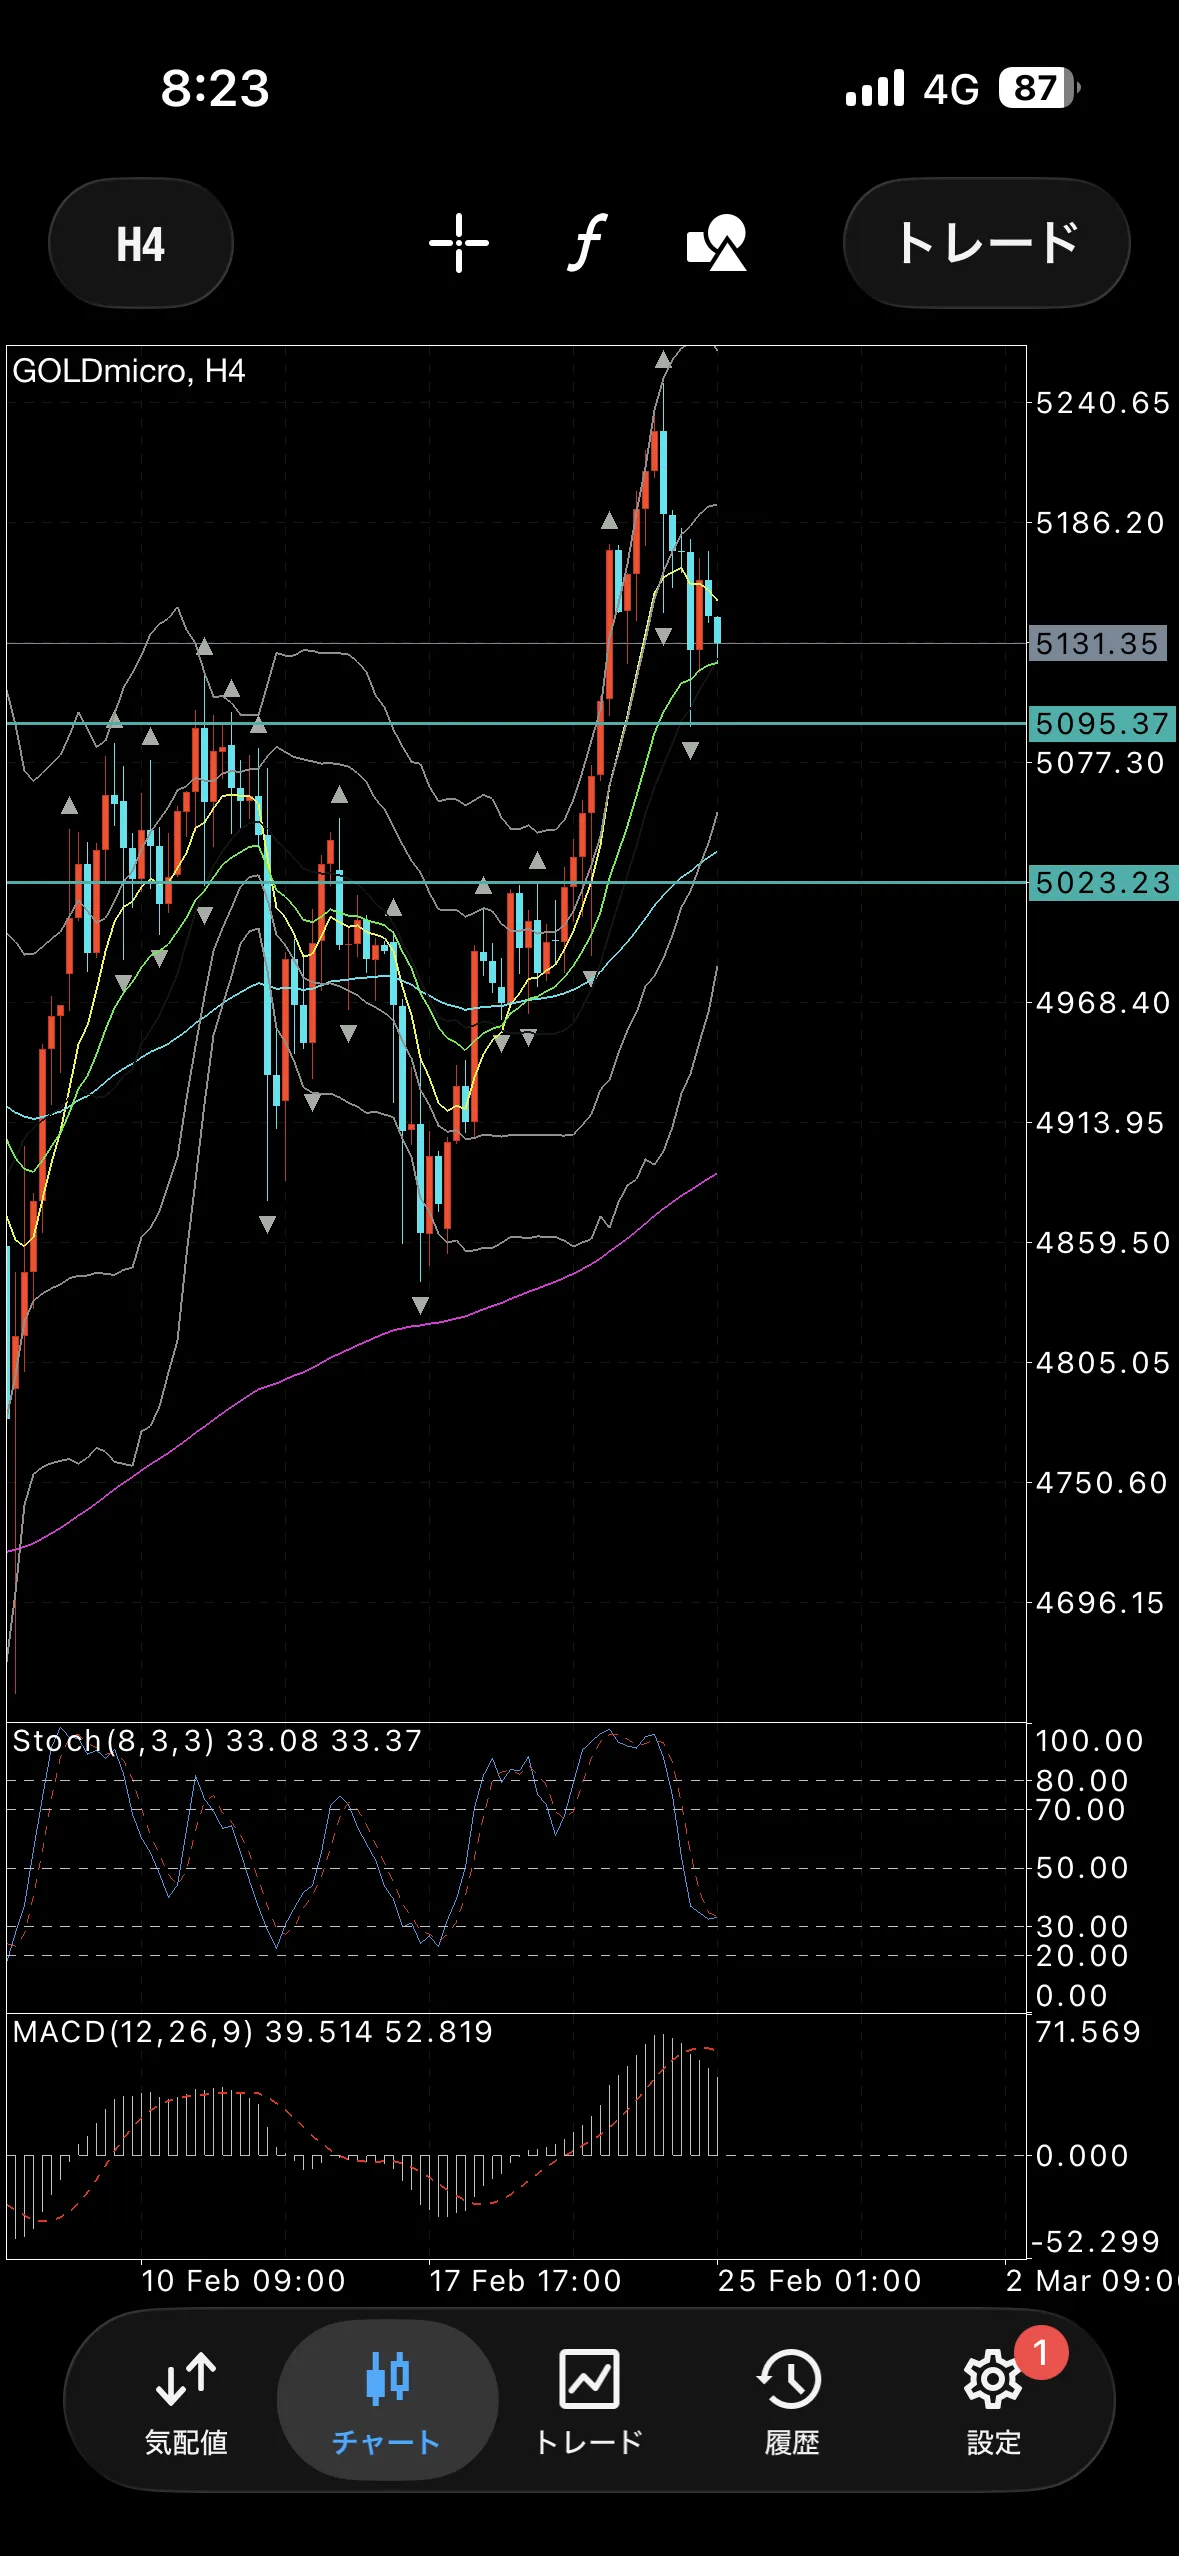
Since the gold 4-hour chart has broken through the recent high, the bias remains bullish.
MA is in a PO (pullback) phase, and the Stochastic is in the hidden zone, so depending on PA (price action), this could become a pullback area.
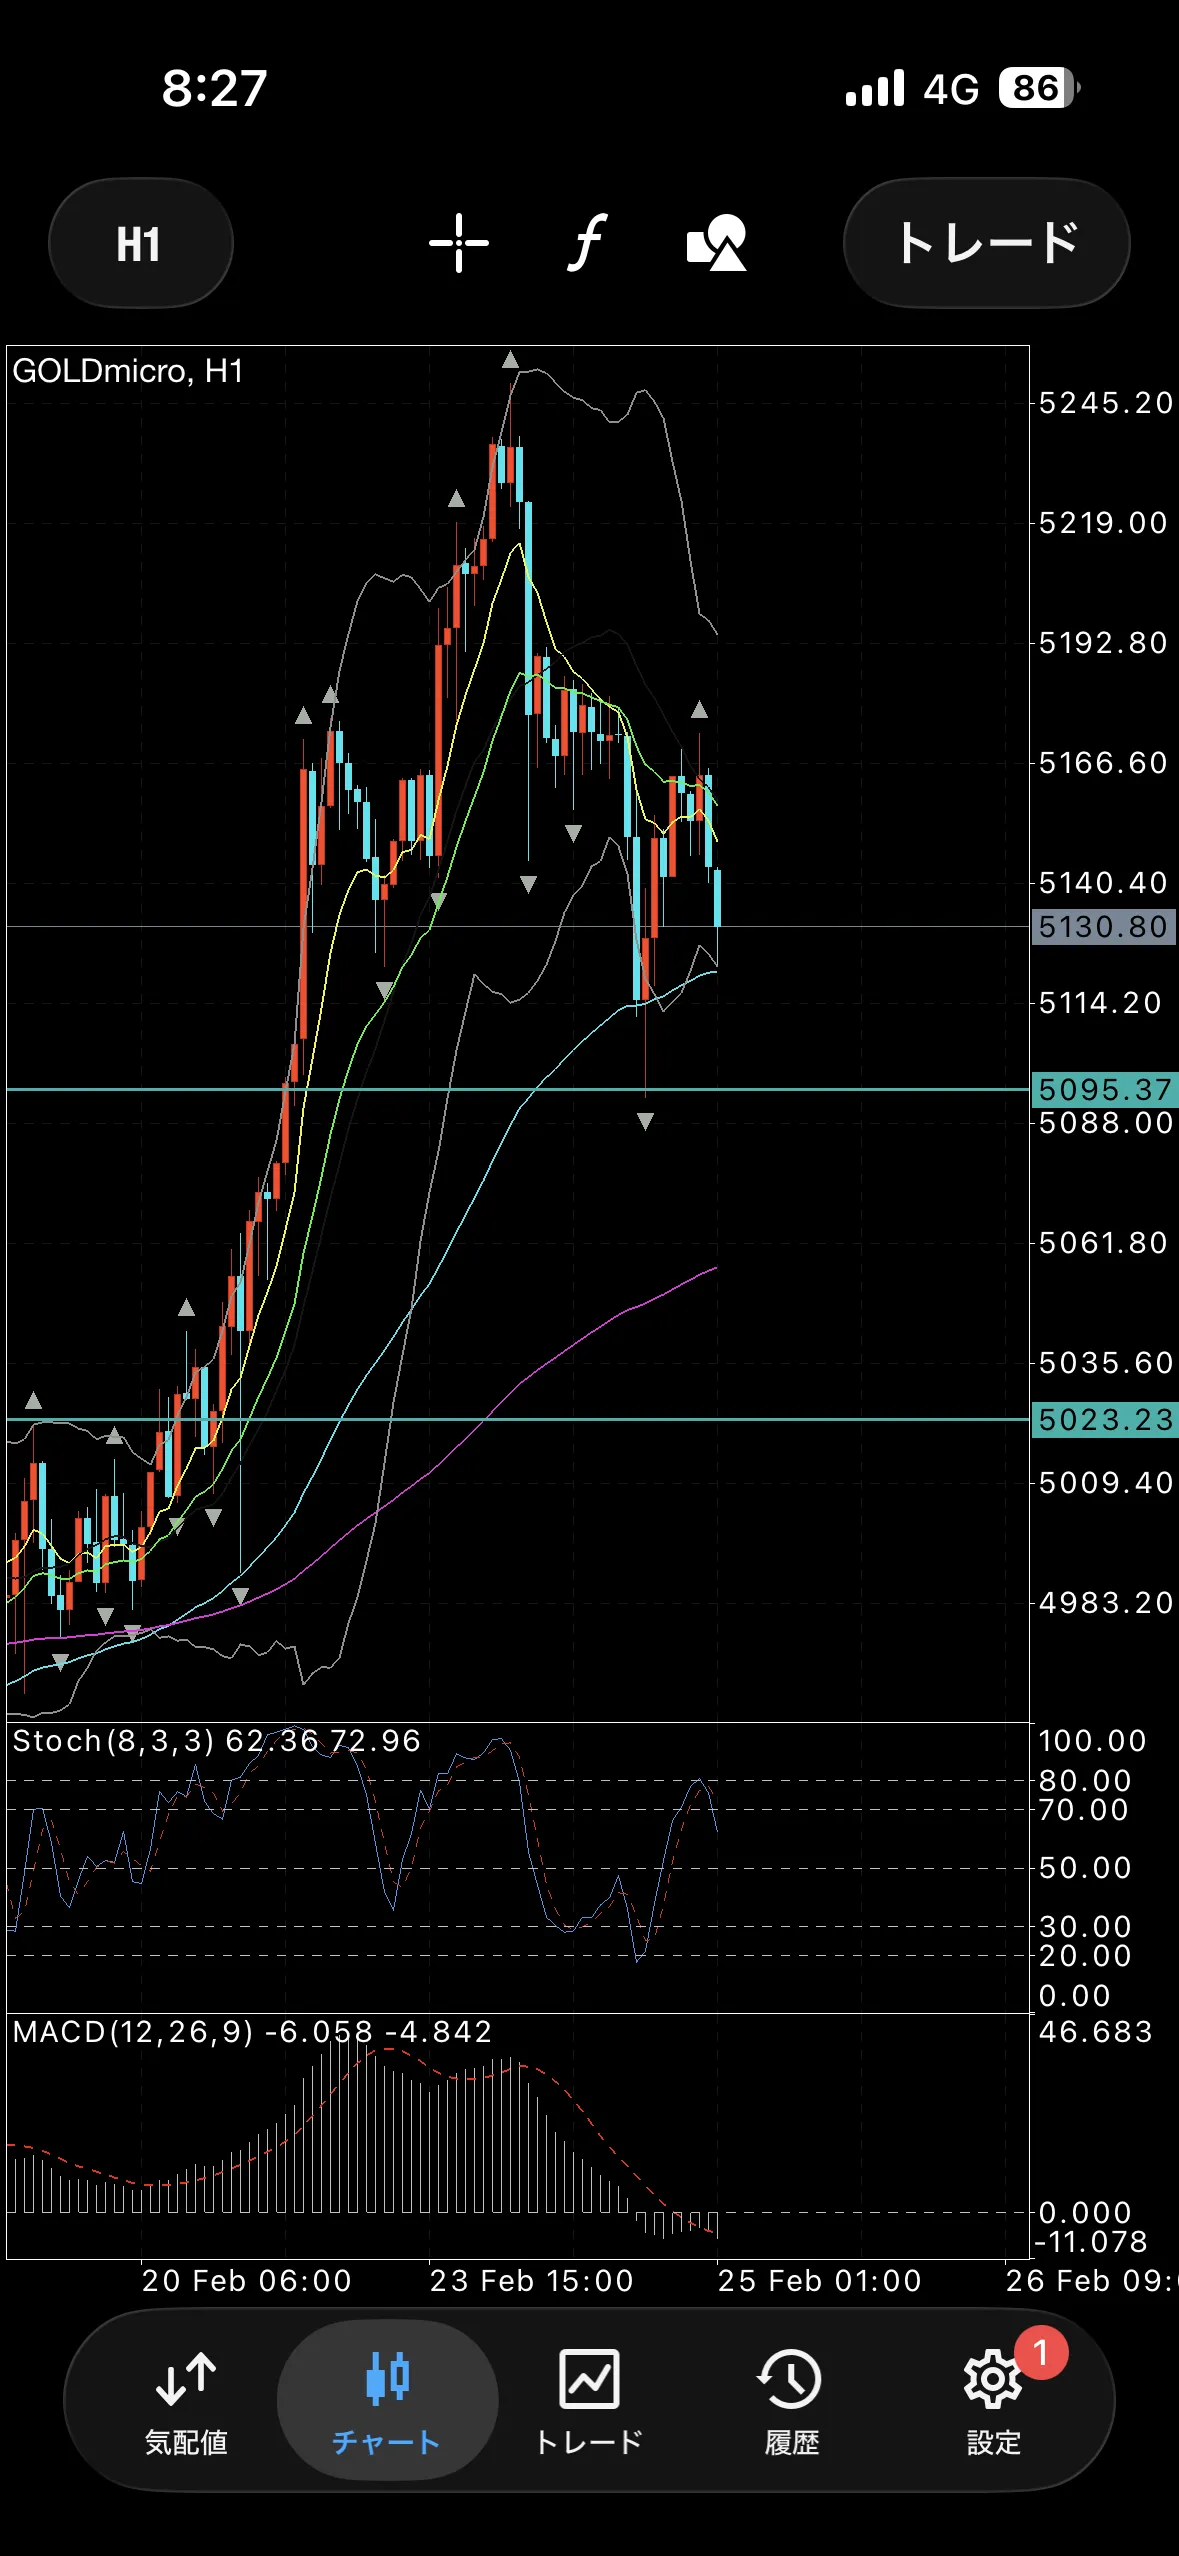
The 1-hour chart is moving around near the right shoulder of a descending three-bar pattern.
It remains bearish until the right shoulder's bearish candle outside starting near 5164 is surpassed.
Buy defense line
5095
5023
Sell defense line
5283
5425
5566