

Limited-time discount "The Strongest Moving Average Indicator" Entry when the two lines' colors align, you can capture a large number of pips!
In my own years of continuing to trade,
I have been searching for “reproducible rules that work in any market.”
But reality is a succession of things not going as planned.
When a trend seems to appear, it reverses immediately,
even when I felt the form looked good I get caught in a stop loss――.
As I repeated such experiences many times, I felt strongly:
“If only there were simpler, decisive criteria.”
Have you ever had experiences like this?
・Missed the buy timing and ended up buying at a high
・After entry, price moves against you and you’re unsure of the next move
・Overlaid too many indicators and can’t tell which signal to trust
To consistently make profits in trading,
it is most important to have a “clear and unwavering judgment standard.”
So I developed,
a tool that visually captures the trend and lets anyone judge without hesitation. This is—‘the strongest moving average indicator’.
The biggest feature of this indicator is,
eliminating complex logic and letting you intuitively grasp the trend just by color change.
The moment the two moving averages become the same color,
that is the “trend occurrence signal.”
There is no longer a need to compare multiple indicators as before.
Because you can judge at a glance whether it is Go Up or Go Down,
beginners and advanced traders can trade by the same standard—
a simple design aimed at reproducibility.
Moreover, to prevent the most common trading hesitations on the field,
we fine-tuned the layout and colors of lines and signals, their reaction speeds, and so on.
Removing extraneous information, we designed to clearly identify only the “trend flow.”
It is built to help you focus on the essence of the market.
The concept of this tool is,
“simple, accurate, intuitive.”
Disproving the preconception that trading is difficult,
this indicator embodies the idea of “you can see it and act without hesitation.”
Of course it is not universal in every market condition.
However, by having a clear standard, you can remove emotional judgments and
create a state where you can trade according to the rules.
That is the foundation for winning in the long term.
Since I started using this tool,
I no longer stay glued to the charts.
Because I can see the direction just by color changes,
I gain the ability to view the market from above, and my trading accuracy has improved significantly.
The essence of trading is not prediction but “adaptation.”
Always follow your rules and decide calmly in any situation.
This indicator provides that “axis of judgment.”
You no longer need to enter while hesitating.
The ‘Strongest Moving Average Indicator’
will remove market noise and support your decisions.
Traders tired of the old, complex chart analysis should
experience this combination of simplicity and high precision.
Version upgrade contents: Added a 16-page product manual (PDF).
With the upgrade, three types of notifications are fully synchronized, so you won’t miss opportunities.
✅Open a chart and check instantly with a popup!
✅Notifications reach your smartphone, so you won’t miss signs when you’re away!
✅Email notifications let you monitor multiple currencies at once!
In particular, part-time traders or busy professionals will find this notification feature a reliable ally that lets you participate in the market while working.
No more regrets of “I realized it too late.”
It will reliably help you catch the initial move of the trend.
For example, the following usage methods are effective
Combined use across multiple timeframes
→ Check the overall trend on the 4-hour chart, and if the same color (blue or red) aligns on the 1-hour or 15-minute chart, it signals a strong trend.
(Note: the image shown uses the 4-hour chart as an example; you can use the same principle on any timeframe)Volatile currencies (GOLD, GBP/NZD, EUR/AUD, etc.)
→ Tend to move strongly during the initial trend, offering opportunities for short-term large gains.Scalping/Day trading (15-min, 5-min charts, etc.)
→ Use short-term color changes to accumulate small waves. If you confirm direction on a higher timeframe before entering, accuracy improves.
Across any method, what remains important is tofocus only on the moment when the two lines’ colors perfectly match.
Just by following this, you can dramatically reduce unnecessary entries.
Purchase here ↓
https://www.gogojungle.co.jp/tools/indicators/38007
First, a report of recent results!


※The above performance figures are from past verifications and individual results, and do not guarantee the same results in all trades.
※On November 21, 2022, we upgraded the product.
Upgraded: Added alert features.
There are popup alerts, email notifications, and smartphone notifications.
※This product is targeted at online community members only※
The “Strongest Moving Average Indicator” yields large pips when the two lines align for entry!
<Product description video (no voice other than the initial advert)>
How to use the indicator
Entry method (3 steps)
① Confirm that both lines have the same color.
② Wait for the candles to close above (blue) or below (red) the lines.
③ When the next candle starts, enter in the direction.
Furthermore, combining with other indicators (RSI, Bollinger Bands, etc.)
can prevent false signals and improve entry accuracy.
Key point?
Confirm the trend on the 1-hour or 4-hour chart and then enter on the shorter timeframe to increase success rate
Set stop loss using recent highs/lows to minimize risk
By following this procedure, a simple color change of moving averages becomes a high-precision trend-detection tool.
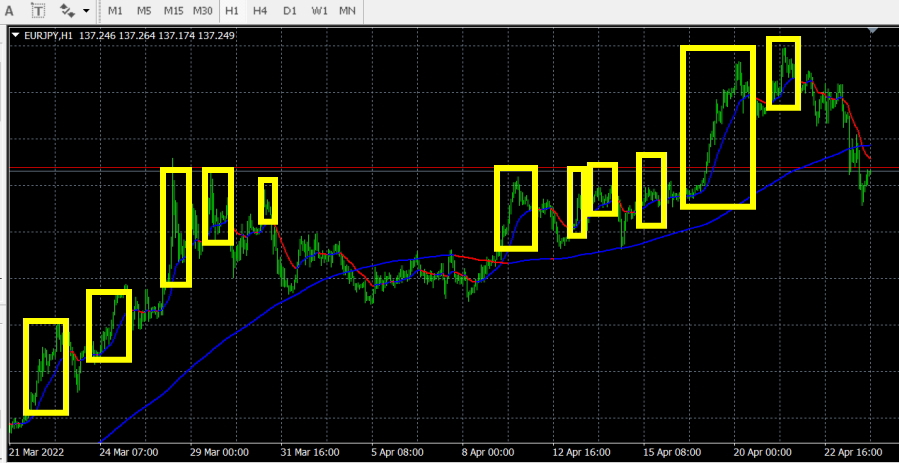
If both lines are blue, it is a buy.
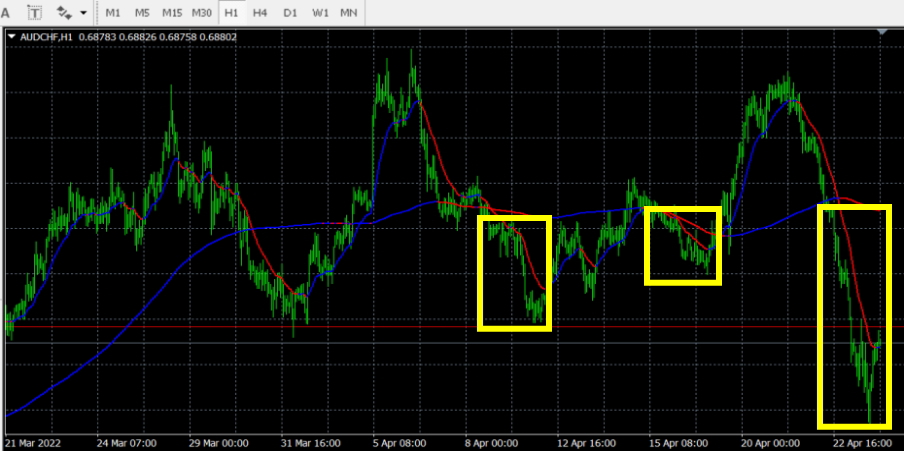
If both lines are red, it is a sell.
Indicator Results
AUD/JPY 1-hour
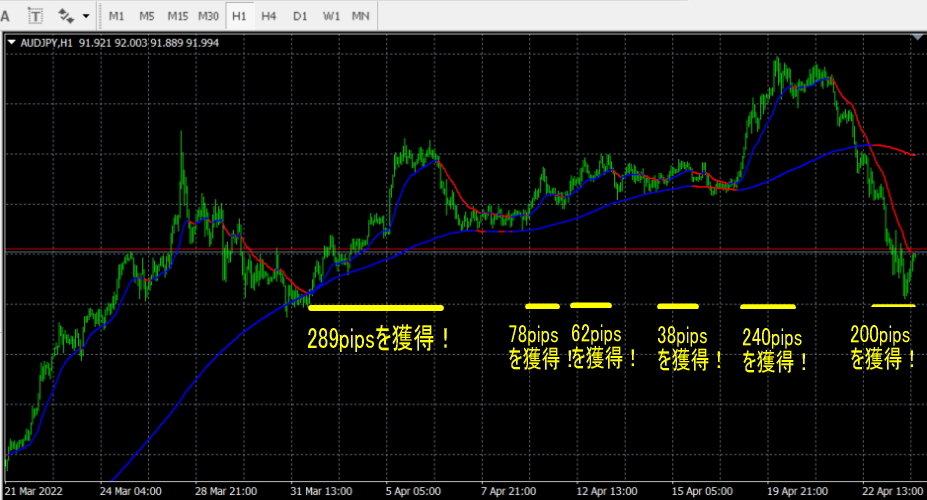
When both lines turn blue, or are blue, the price rises significantly.
NZD/USD 1-hour
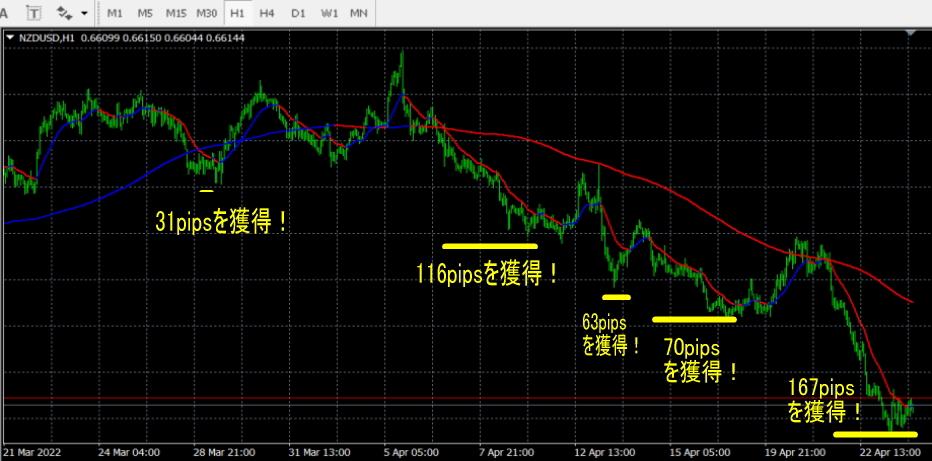
When both lines turn red, or are red, the price falls significantly.
GBP/NZD 1-hour
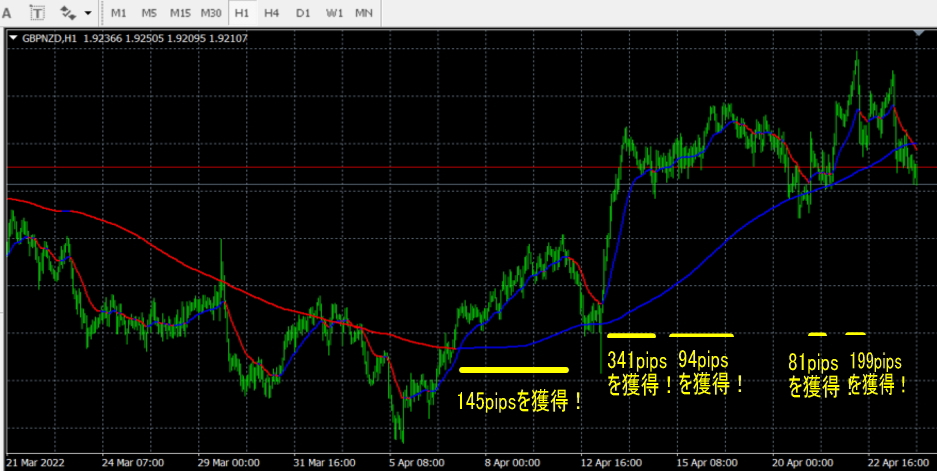
When both lines turn blue, or are blue, the price rises significantly.
【Indicator Results】
The advantage of this indicator is clearly shown in past charts as well.
Signals that properly capture the initial movement of a strong trend show stable subsequent gains,
recreating the ideal entry timing to ride the momentum.
EUR/JPY (1-hour) … Maximum +573 pips
USD/CHF (1-hour) … Maximum +268 pips
GOLD (15-min) … Maximum +368 pips
GBP/AUD (5-min) … Maximum +108 pips
CAD/CHF (1-hour) … Maximum +252 pips
USD/CAD (5-min) … Maximum +78 pips
As numerous verification data show,
signals that precisely capture the initial movement of a trend continue to yield profits steadily.
In one trade, for example with EUR/JPY, you can target 200–500 pips,
with 100,000 units, profits could be 200,000–500,000.
For me, using this signal tool has allowed me to consistently secure more than 1,000,000 yen in monthly profit.
※The pips values and profit examples above are based on past verifications and individual trading results and do not guarantee the same outcomes in all environments. Please use with proper money management and strict risk controls.
Indicator Features
- Works on all timeframes and all currencies.
- Available on MT4.
- Sell timing: when both lines are red.
- Buy timing: when both lines are blue.
The market moves today as well.
Are you ready to ride the trend waves?
The ‘Strongest Moving Average Indicator’
will simplify your trading decisions and make them confident.
Begin owning the power to catch trends starting today.
Purchase here ↓