February 21, 2026 USD/JPY, Gold, S&P 500, and Nikkei 225 Environment

The indicator in the attached image uses the indicators above.
※ The larger the displayed time frame, the more it helps to loosen short-sighted thinking and form next week’s image.
※ Please treat the attached commentary as a参考 note. In many situations, adaptability is more important than forecasts or policies.
Dollar/Yen
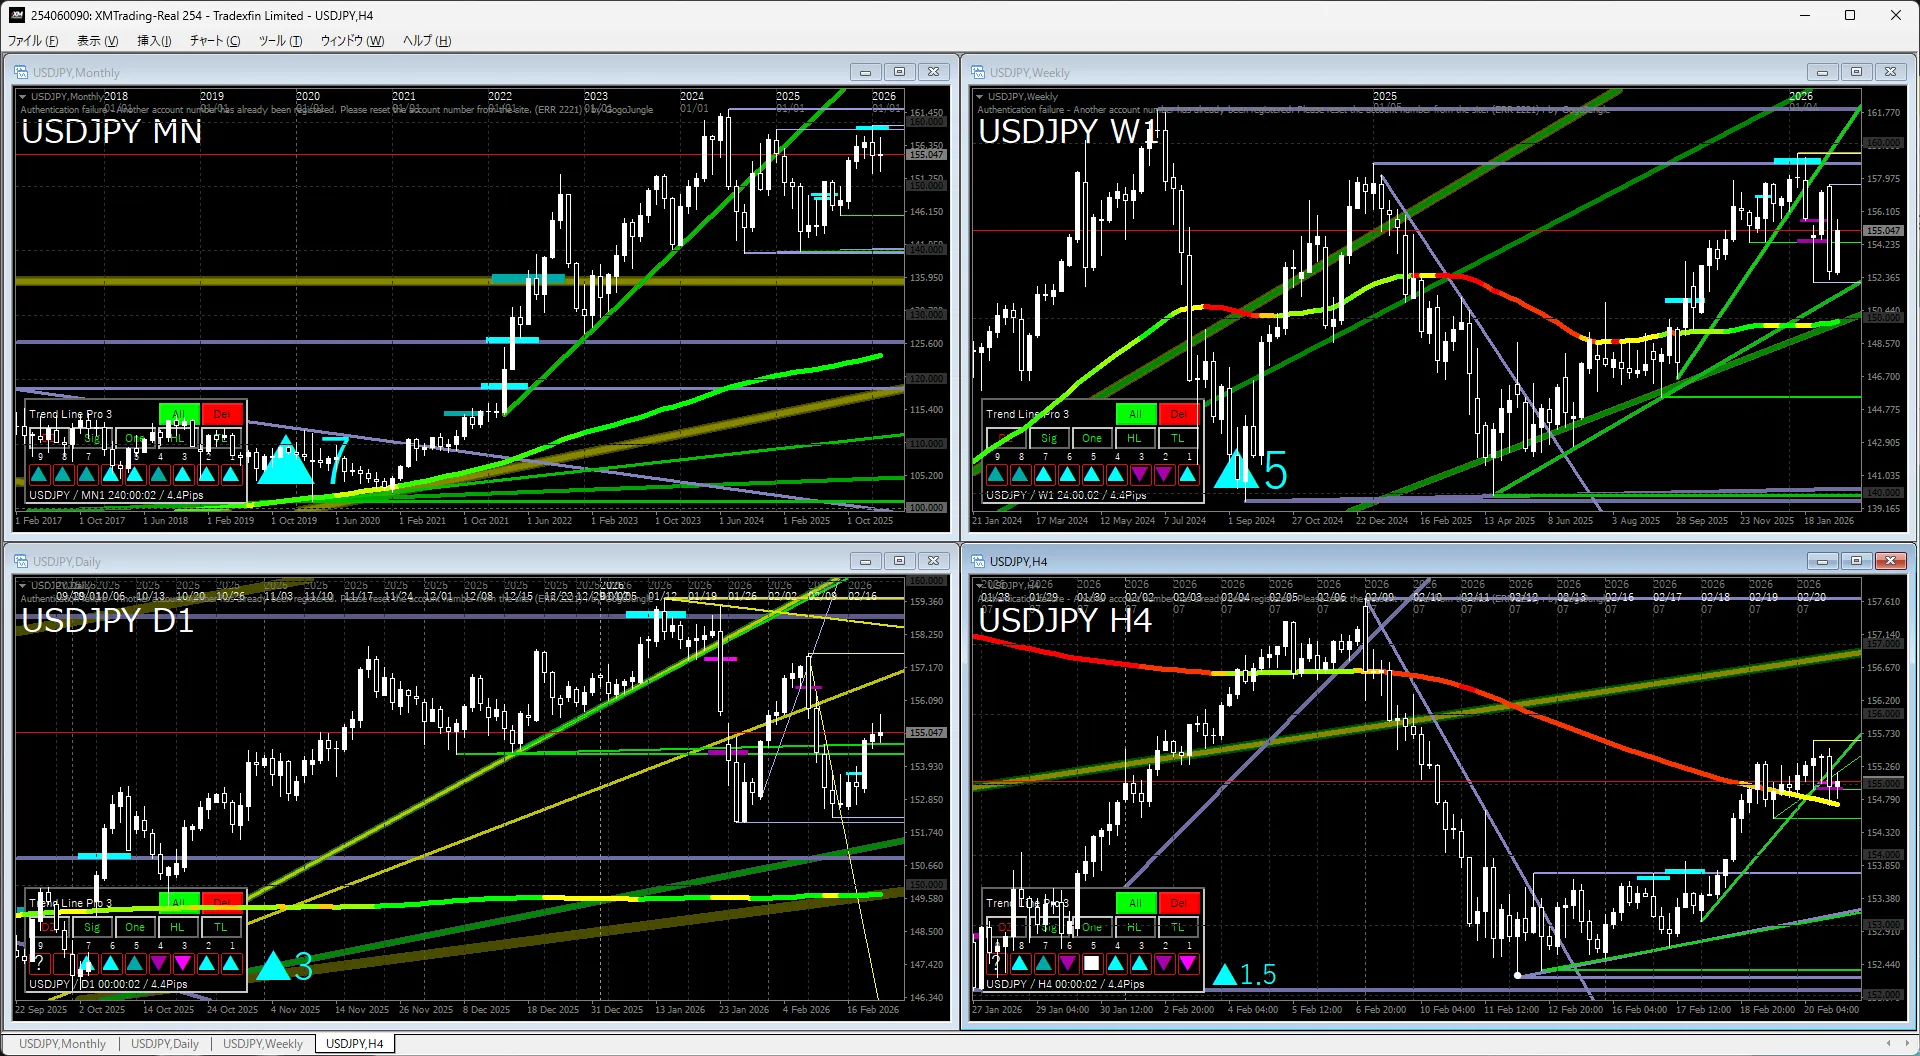
Monthly and WeeklyIn the long term, the shape of appreciation (yen depreciation) has not broken, but it seems to have entered a price-day adjustment phase. Since MA is not keeping up, the impression is that the adjustment will continue for a while.
Daily and 4-hourIn this context, the MA around 150 yen on the weekly and daily charts is easily watched, but first we need to confirm whether the recent low will be broken. The market is hard to read, so price action may weaken.
Gold
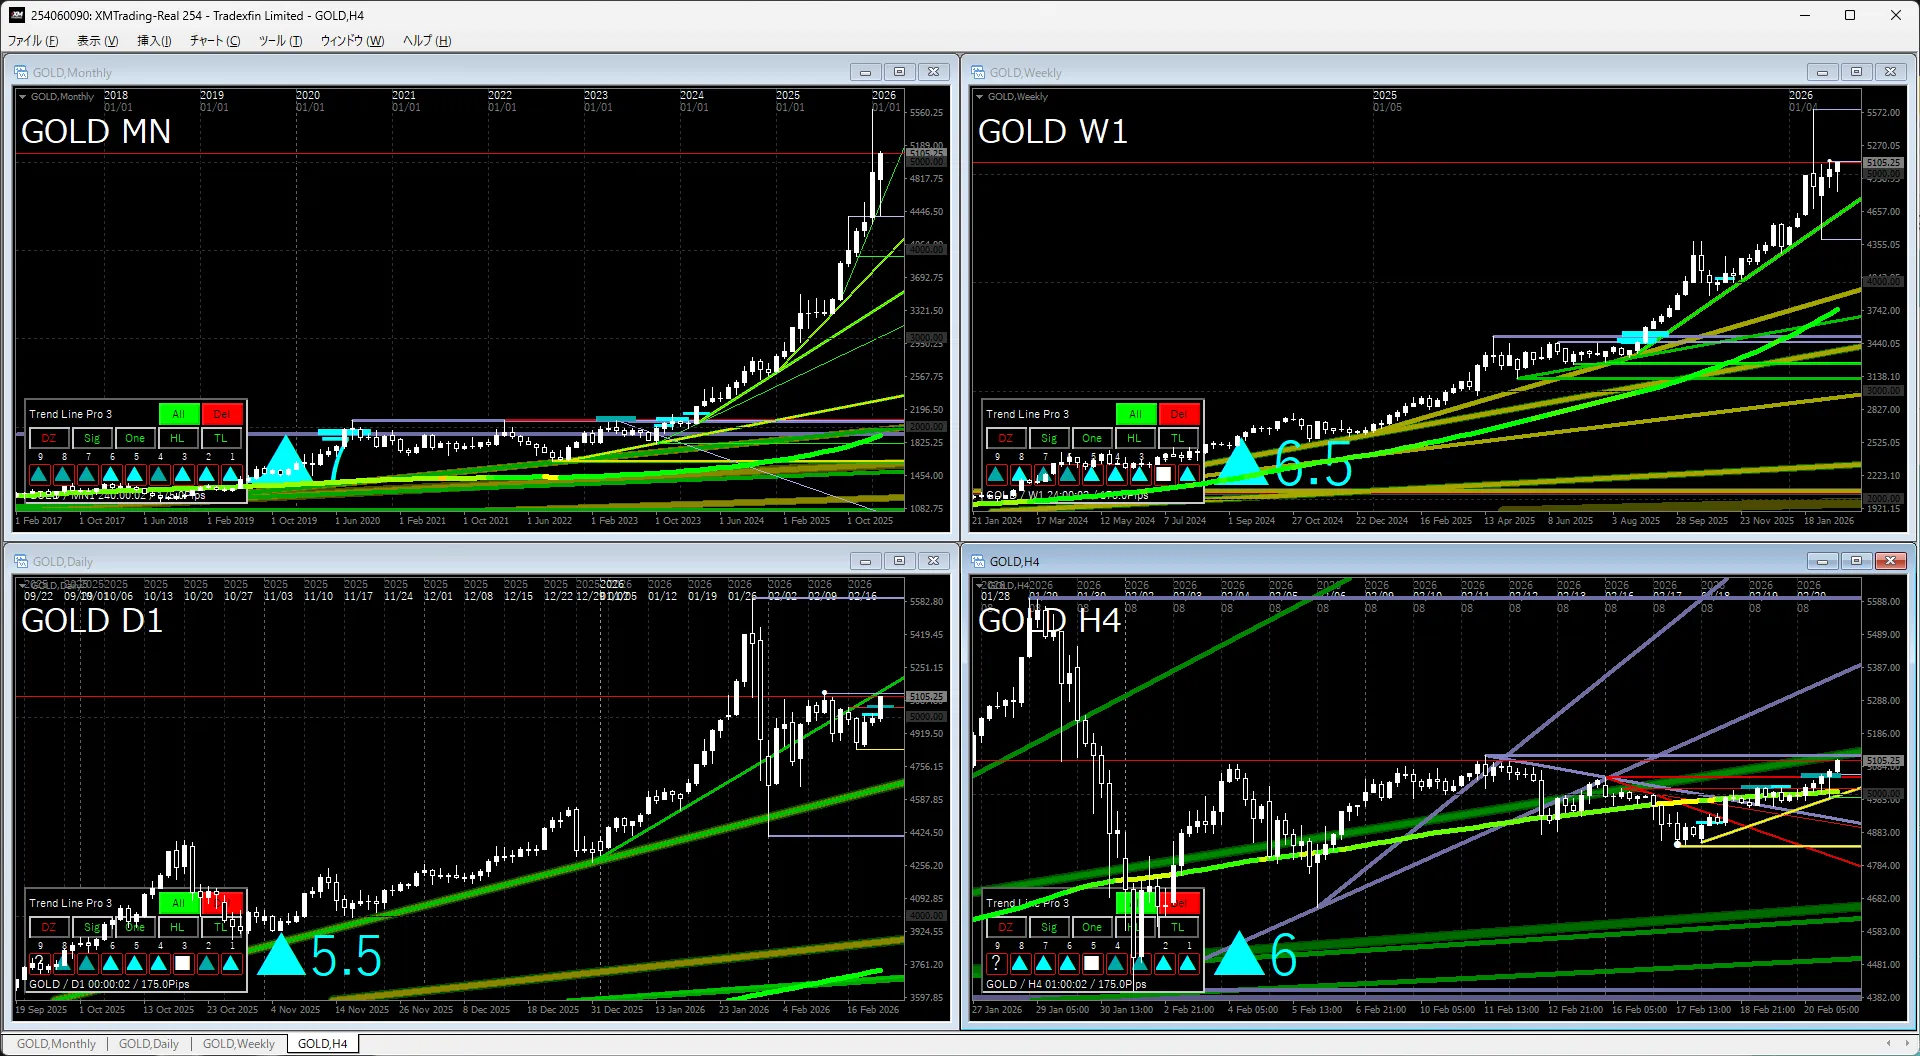
Attention is on the decline in currency value, and gold remains a clear buy คือ方向でした。
Although the overheated feel has subsided, buying remains strong.
S&P 500
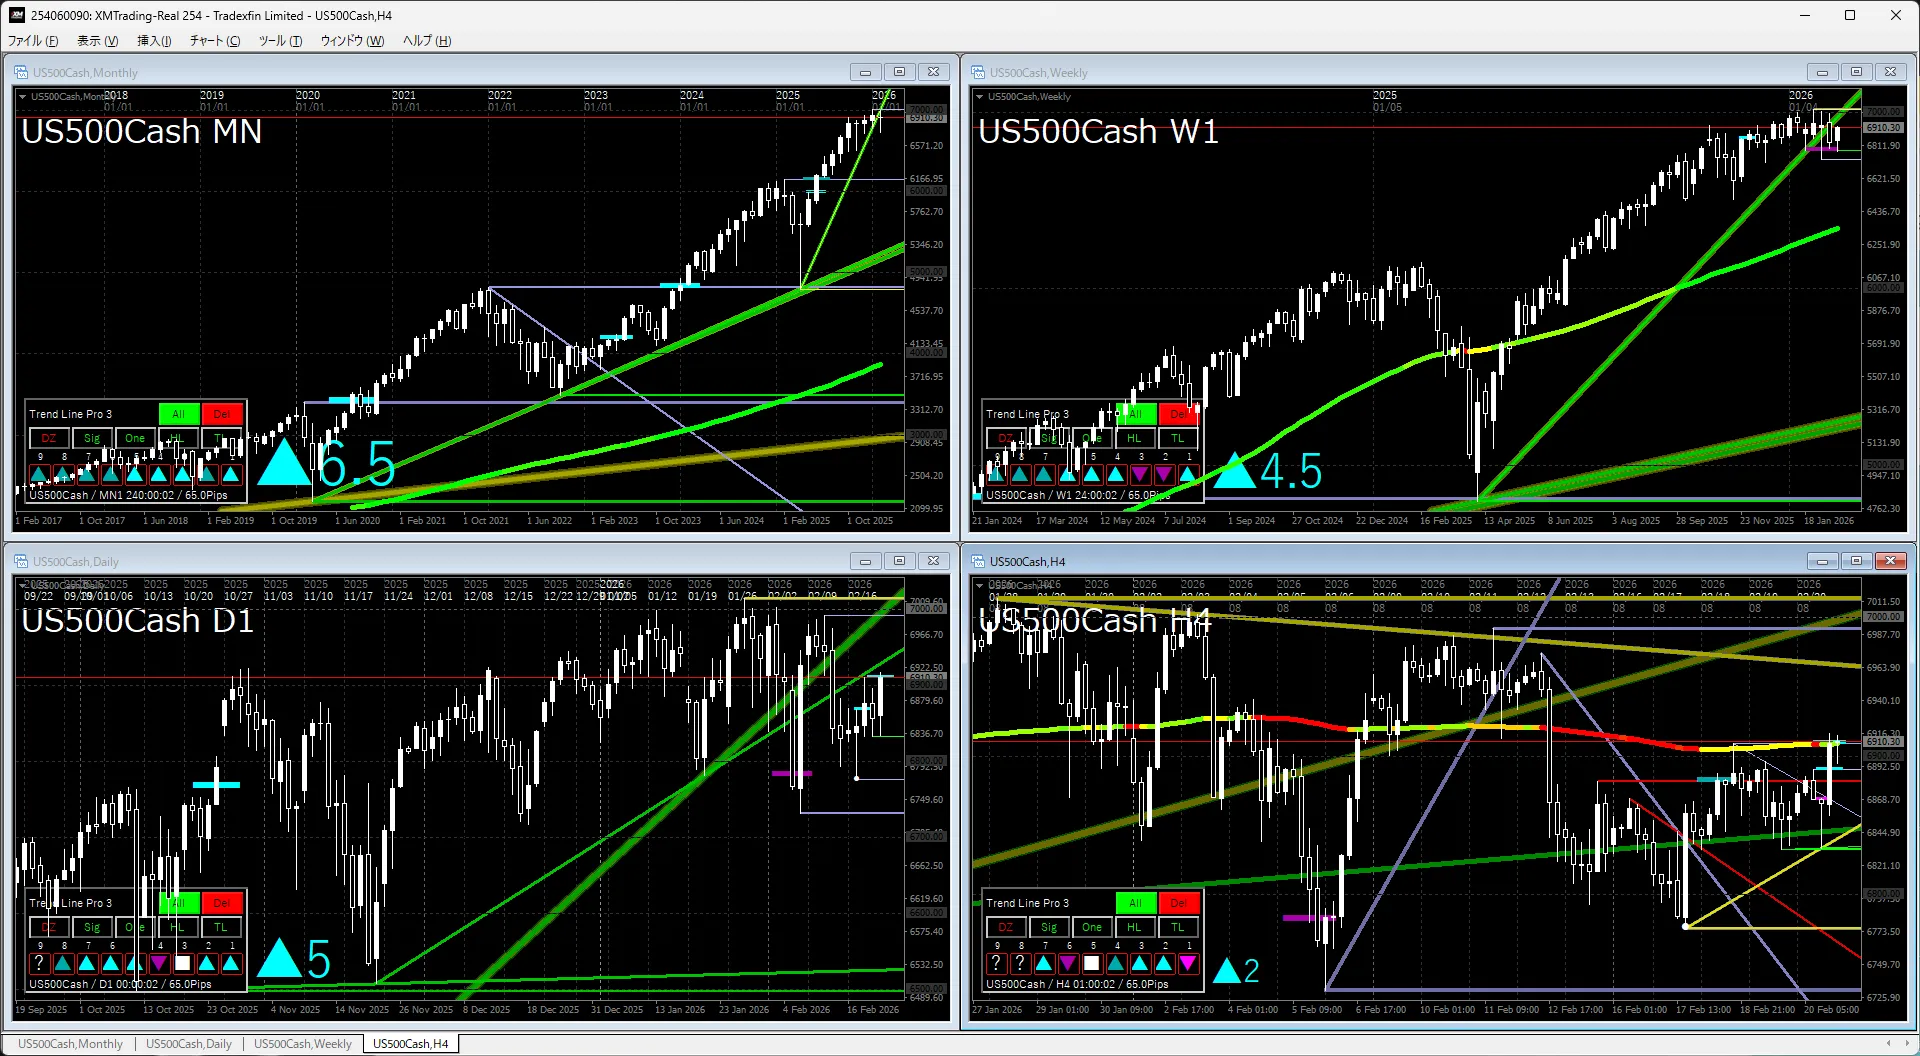
Monthly and WeeklyAfter a rebound from a trendline, the uptrend continues, with focus on currency depreciation making it an easy upward market.
Daily and 4-hourThere is no clear direction. Personally, I expect a sideways trend with occasional new highs.
Nikkei 225
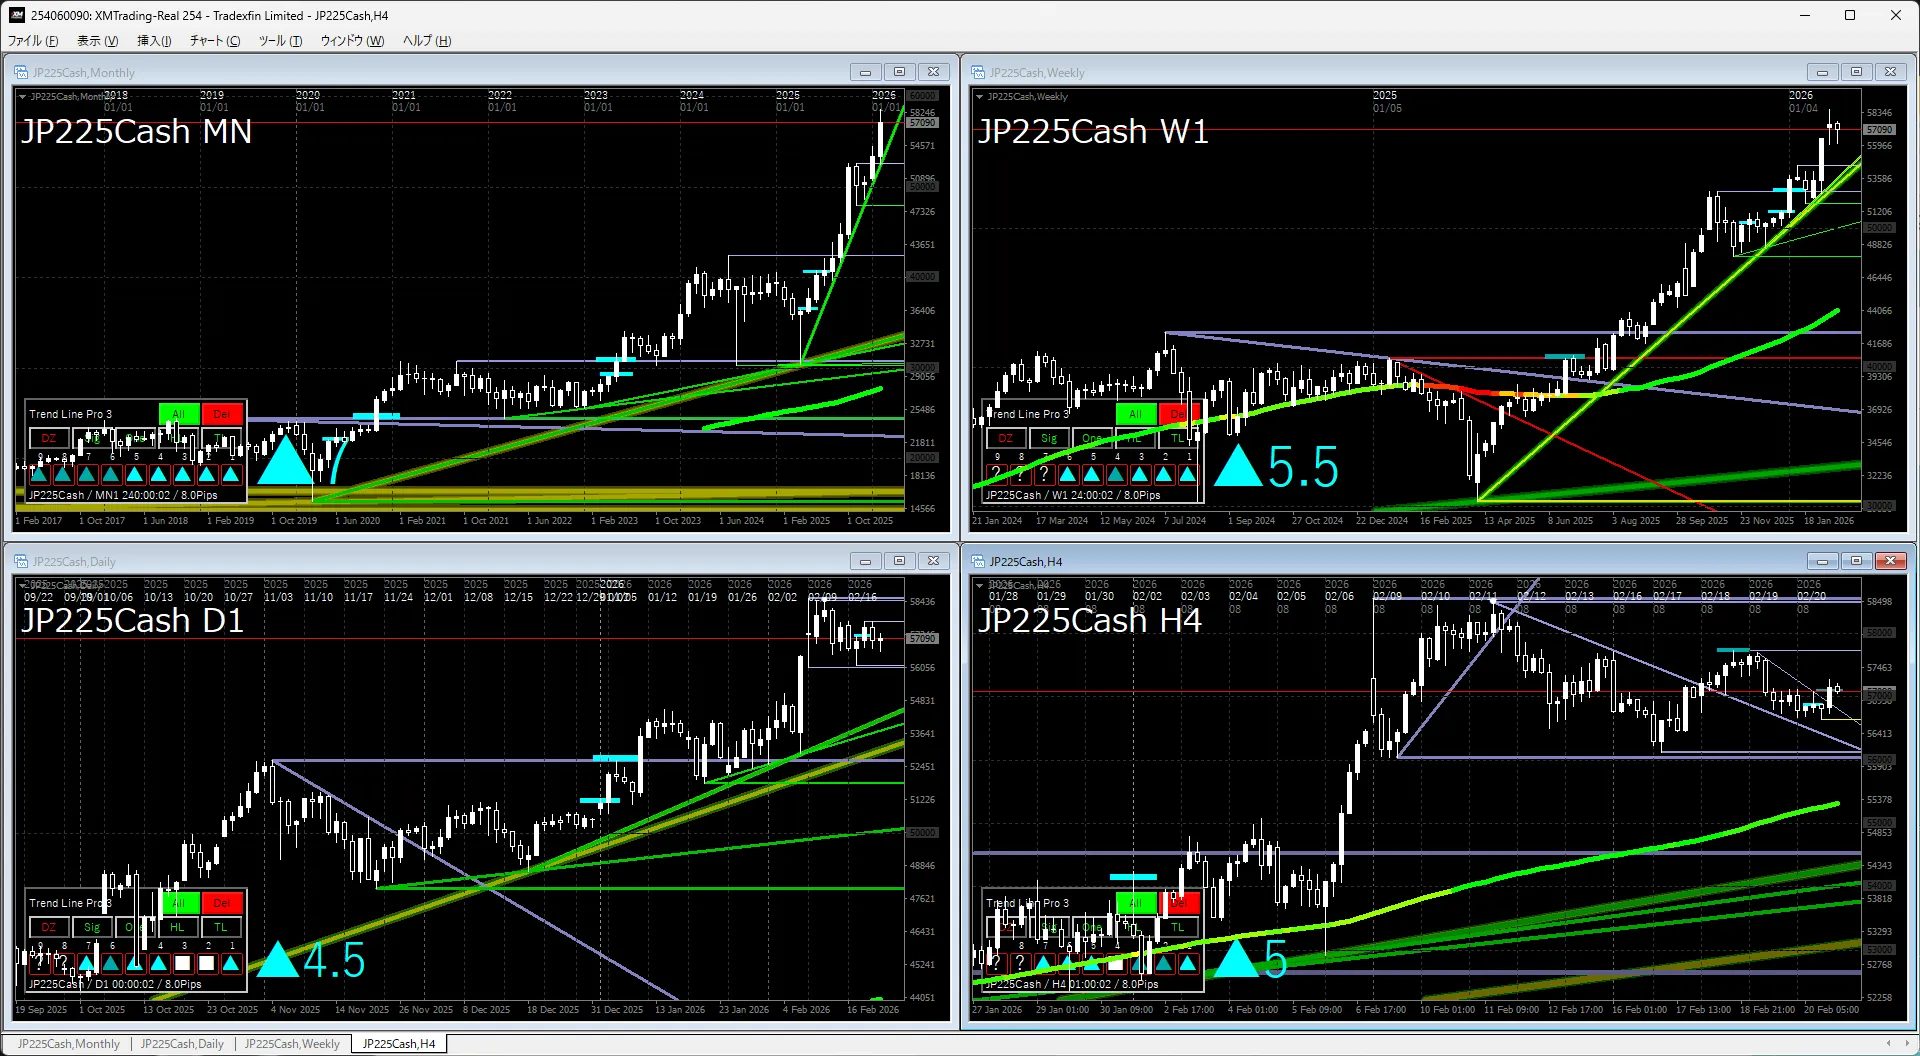
Monthly and WeeklyWith a breakout above the double bottom, the uptrend continues and aligns neatly with the drawn trendline.
Daily and 4-hourThe trendline was respected and price moved into a time-based consolidation. If nothing changes, the time-based consolidation is expected to continue a bit longer.
The indicator in the attached image uses the indicators below.
If you’re interested, please take a look.