

Gold Analysis on 2026/02/19
Daily chart →
4-hour chart ↑
1-hour chart ↑
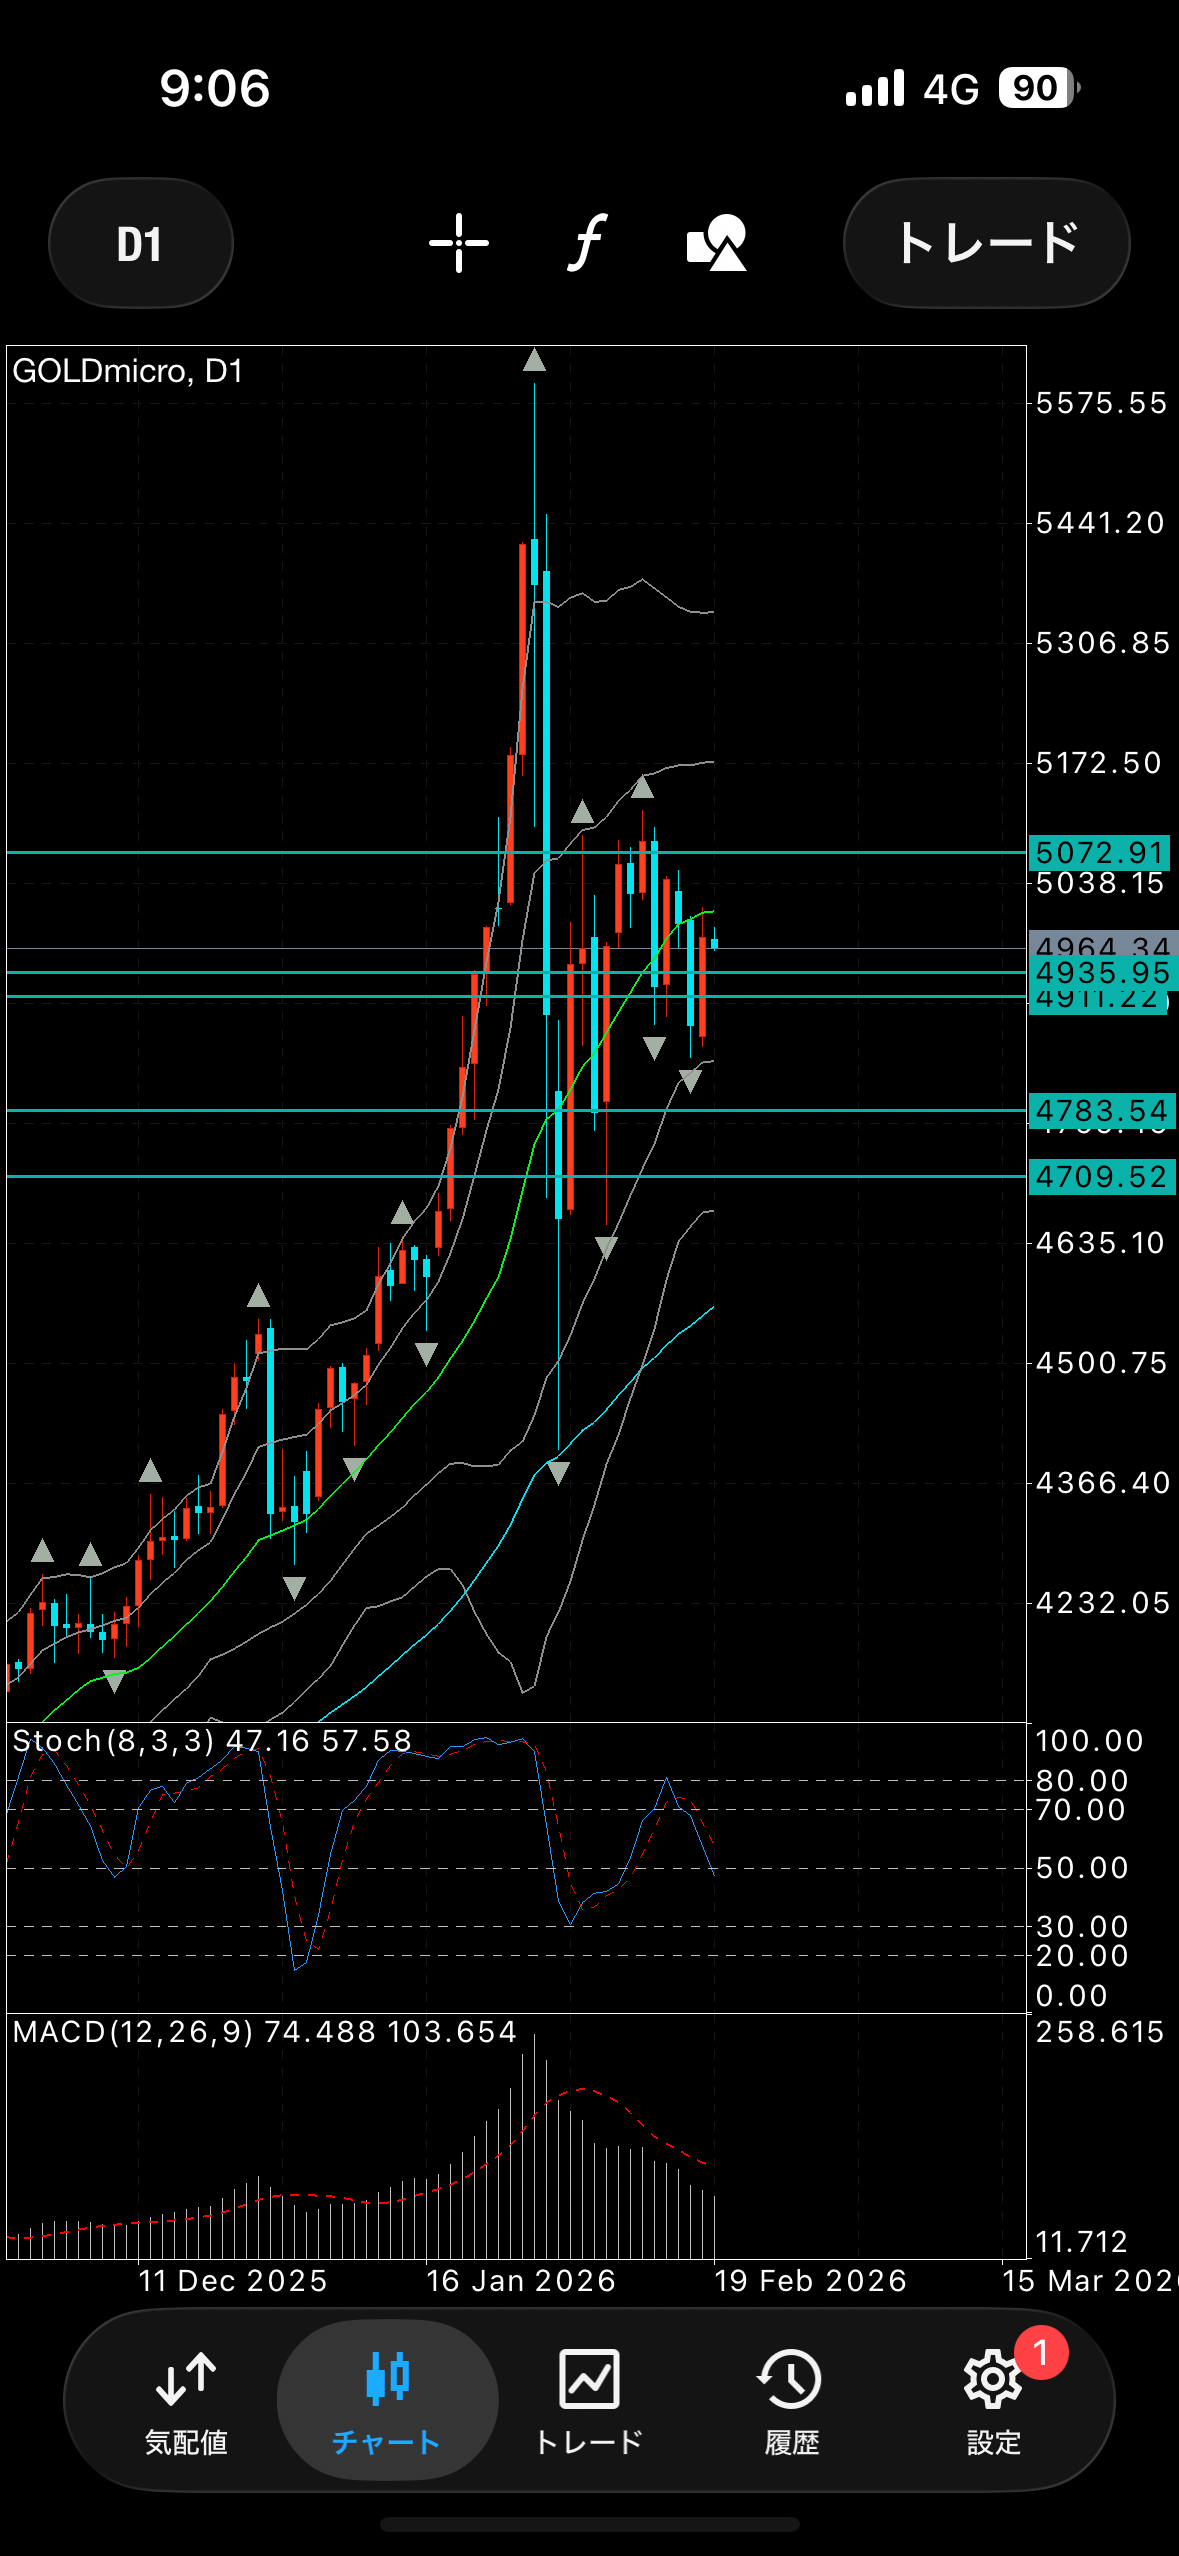
Yesterday's daily candlestick was bullish.
① Inside bar (upper shadow to the daily middle)
② 1σ Rebound
③ It has fallen below the daily middle, but is starting to become parallel
Therefore, there is not much directional clarity.
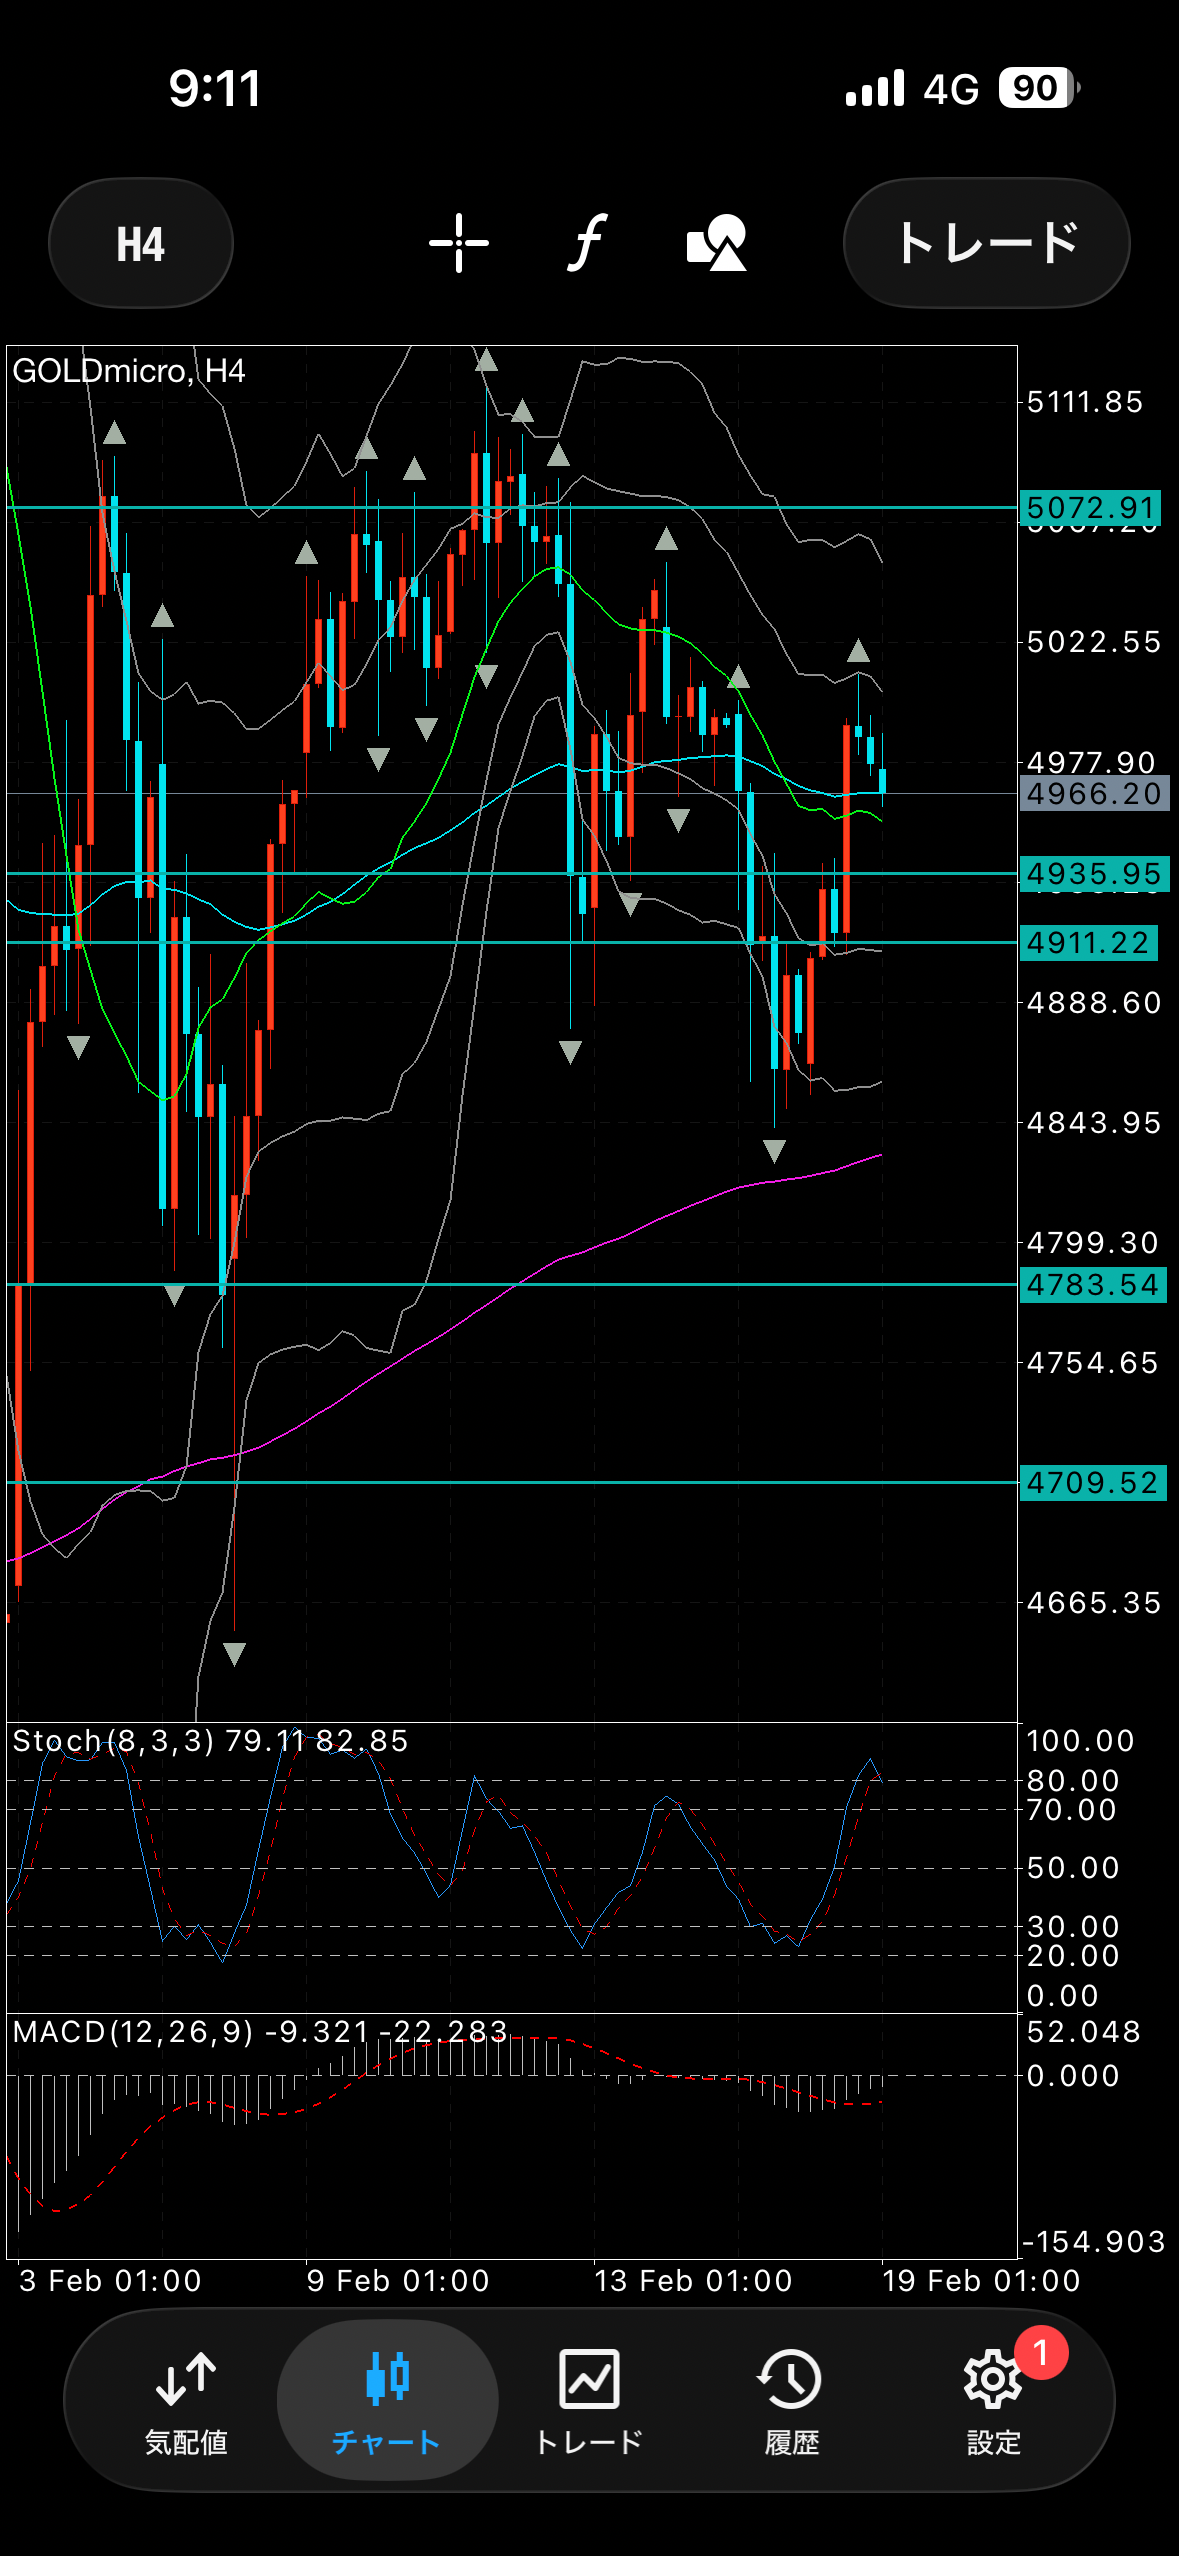
The 4-hour chart is in a range as well.
The top is protected by a horizontal line, the bottom by the 200 EMA.
As long as it does not fall below the most recent outside, the view remains bullish.
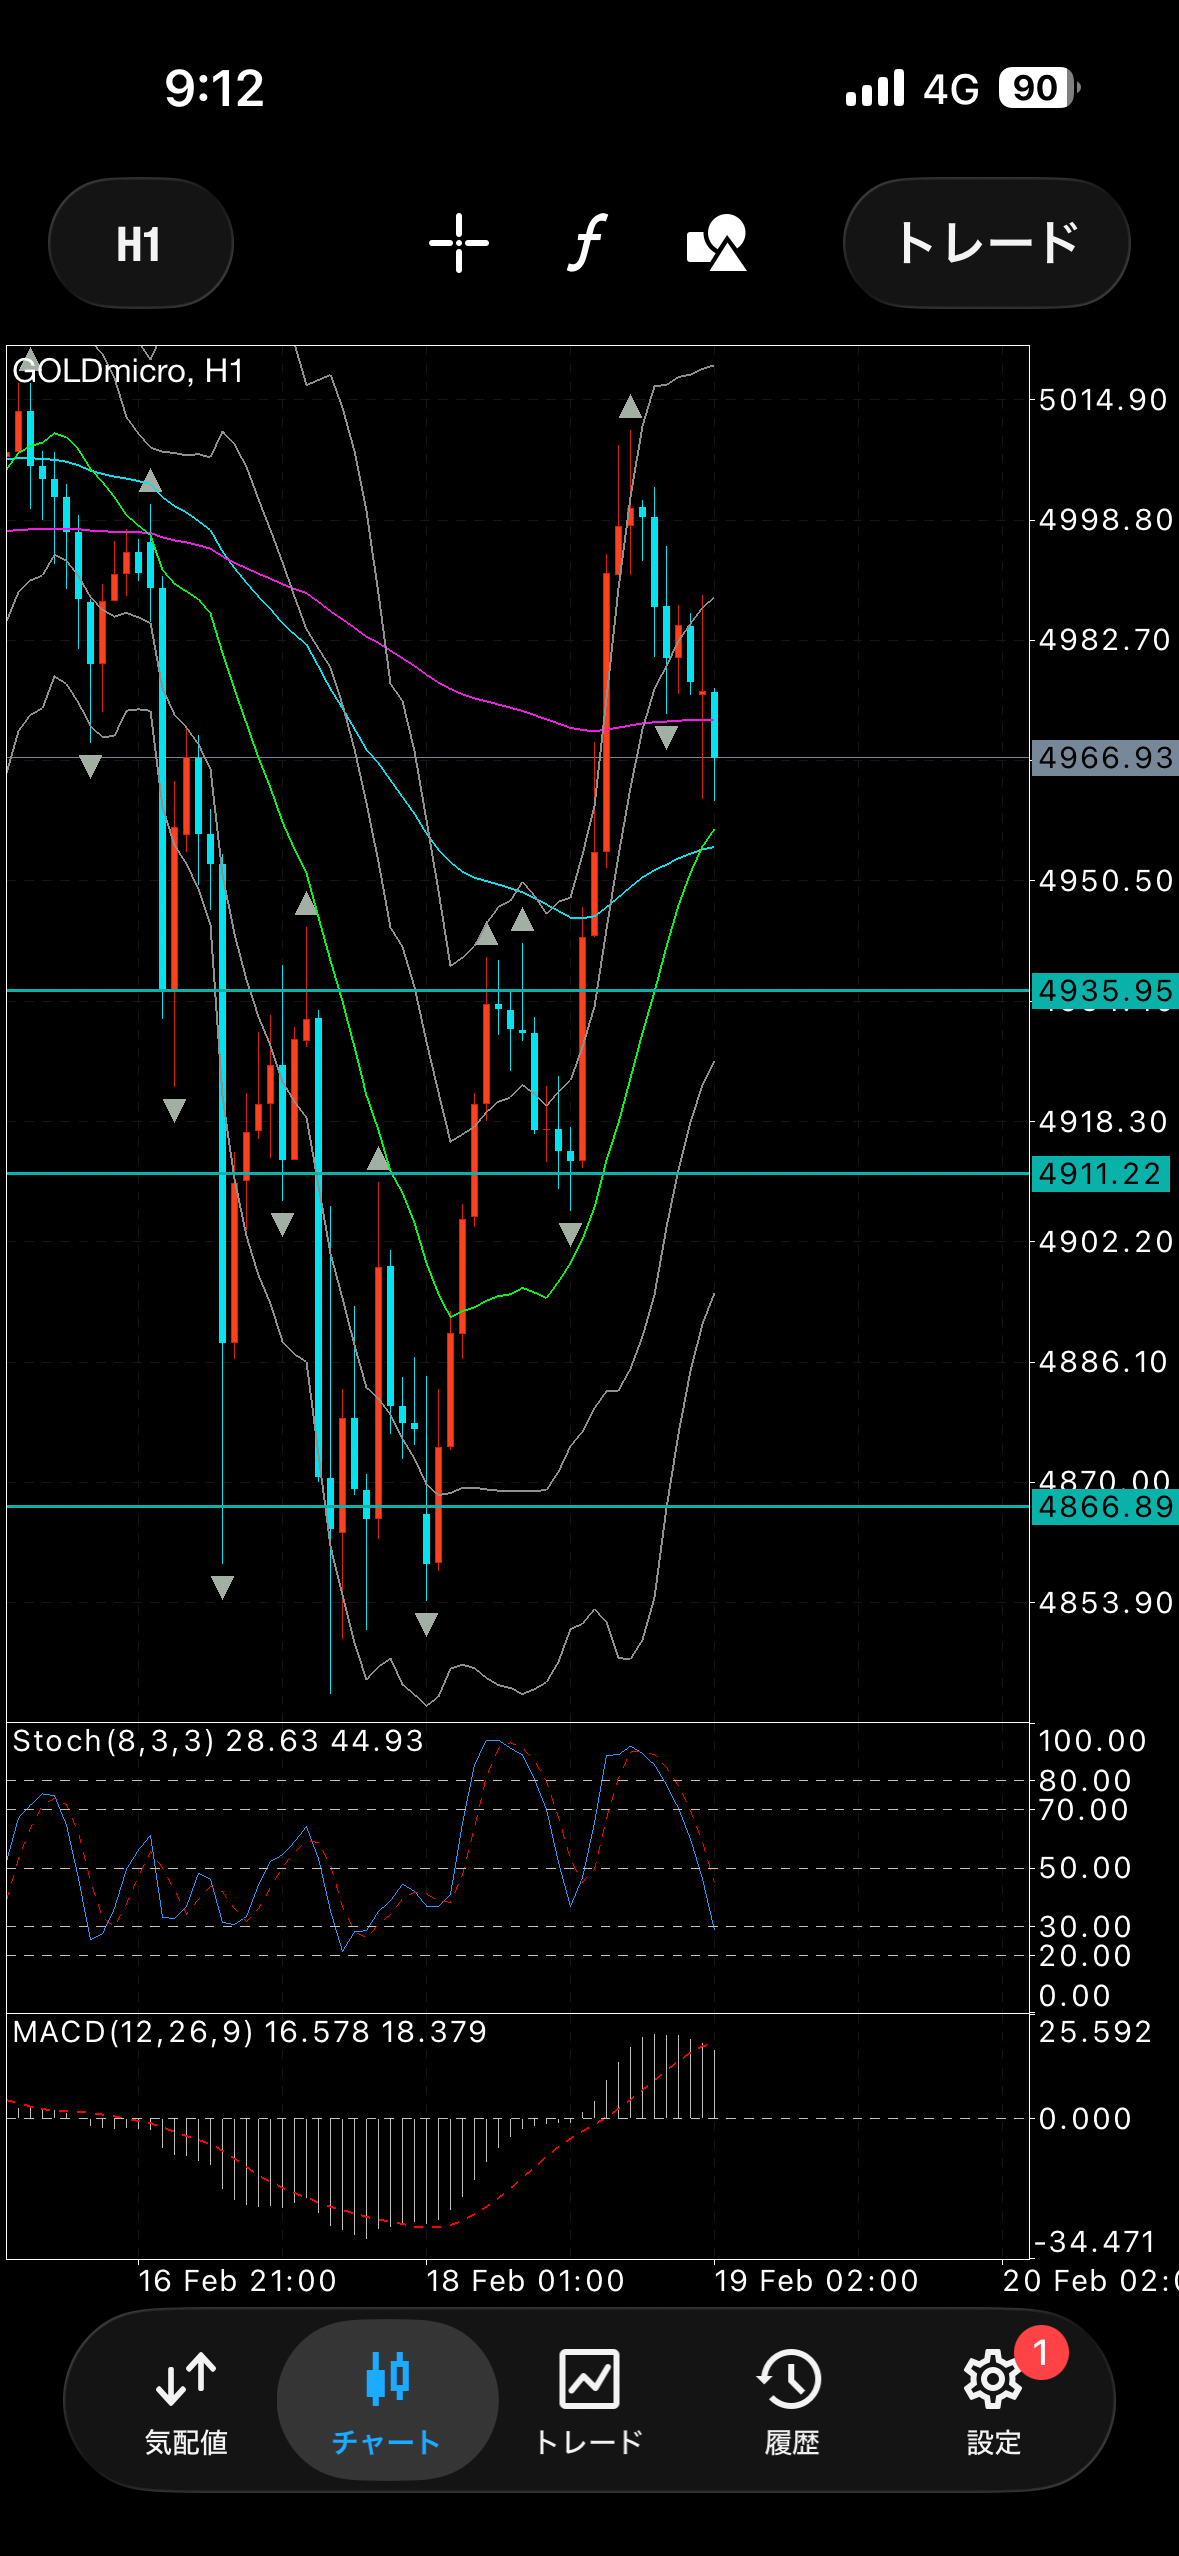
The 1-hour chart rose from a sharp reversal to the right shoulder of the inverted head and shoulders pattern.
Since the price range has been achieved, there is a possibility of a decline afterward, but as a price action (PA) today’s perspective remains bullish.
Buying defense line
Inverse head and shoulders neckline 4935
Inverse head and shoulders right shoulder starting point 4911
Peak 4866
Selling defense line
5009
5050
5070
That is all.