

2026/02/18 Gold Analysis
Using indicator
BB period 20
EMA 10/40/75/200
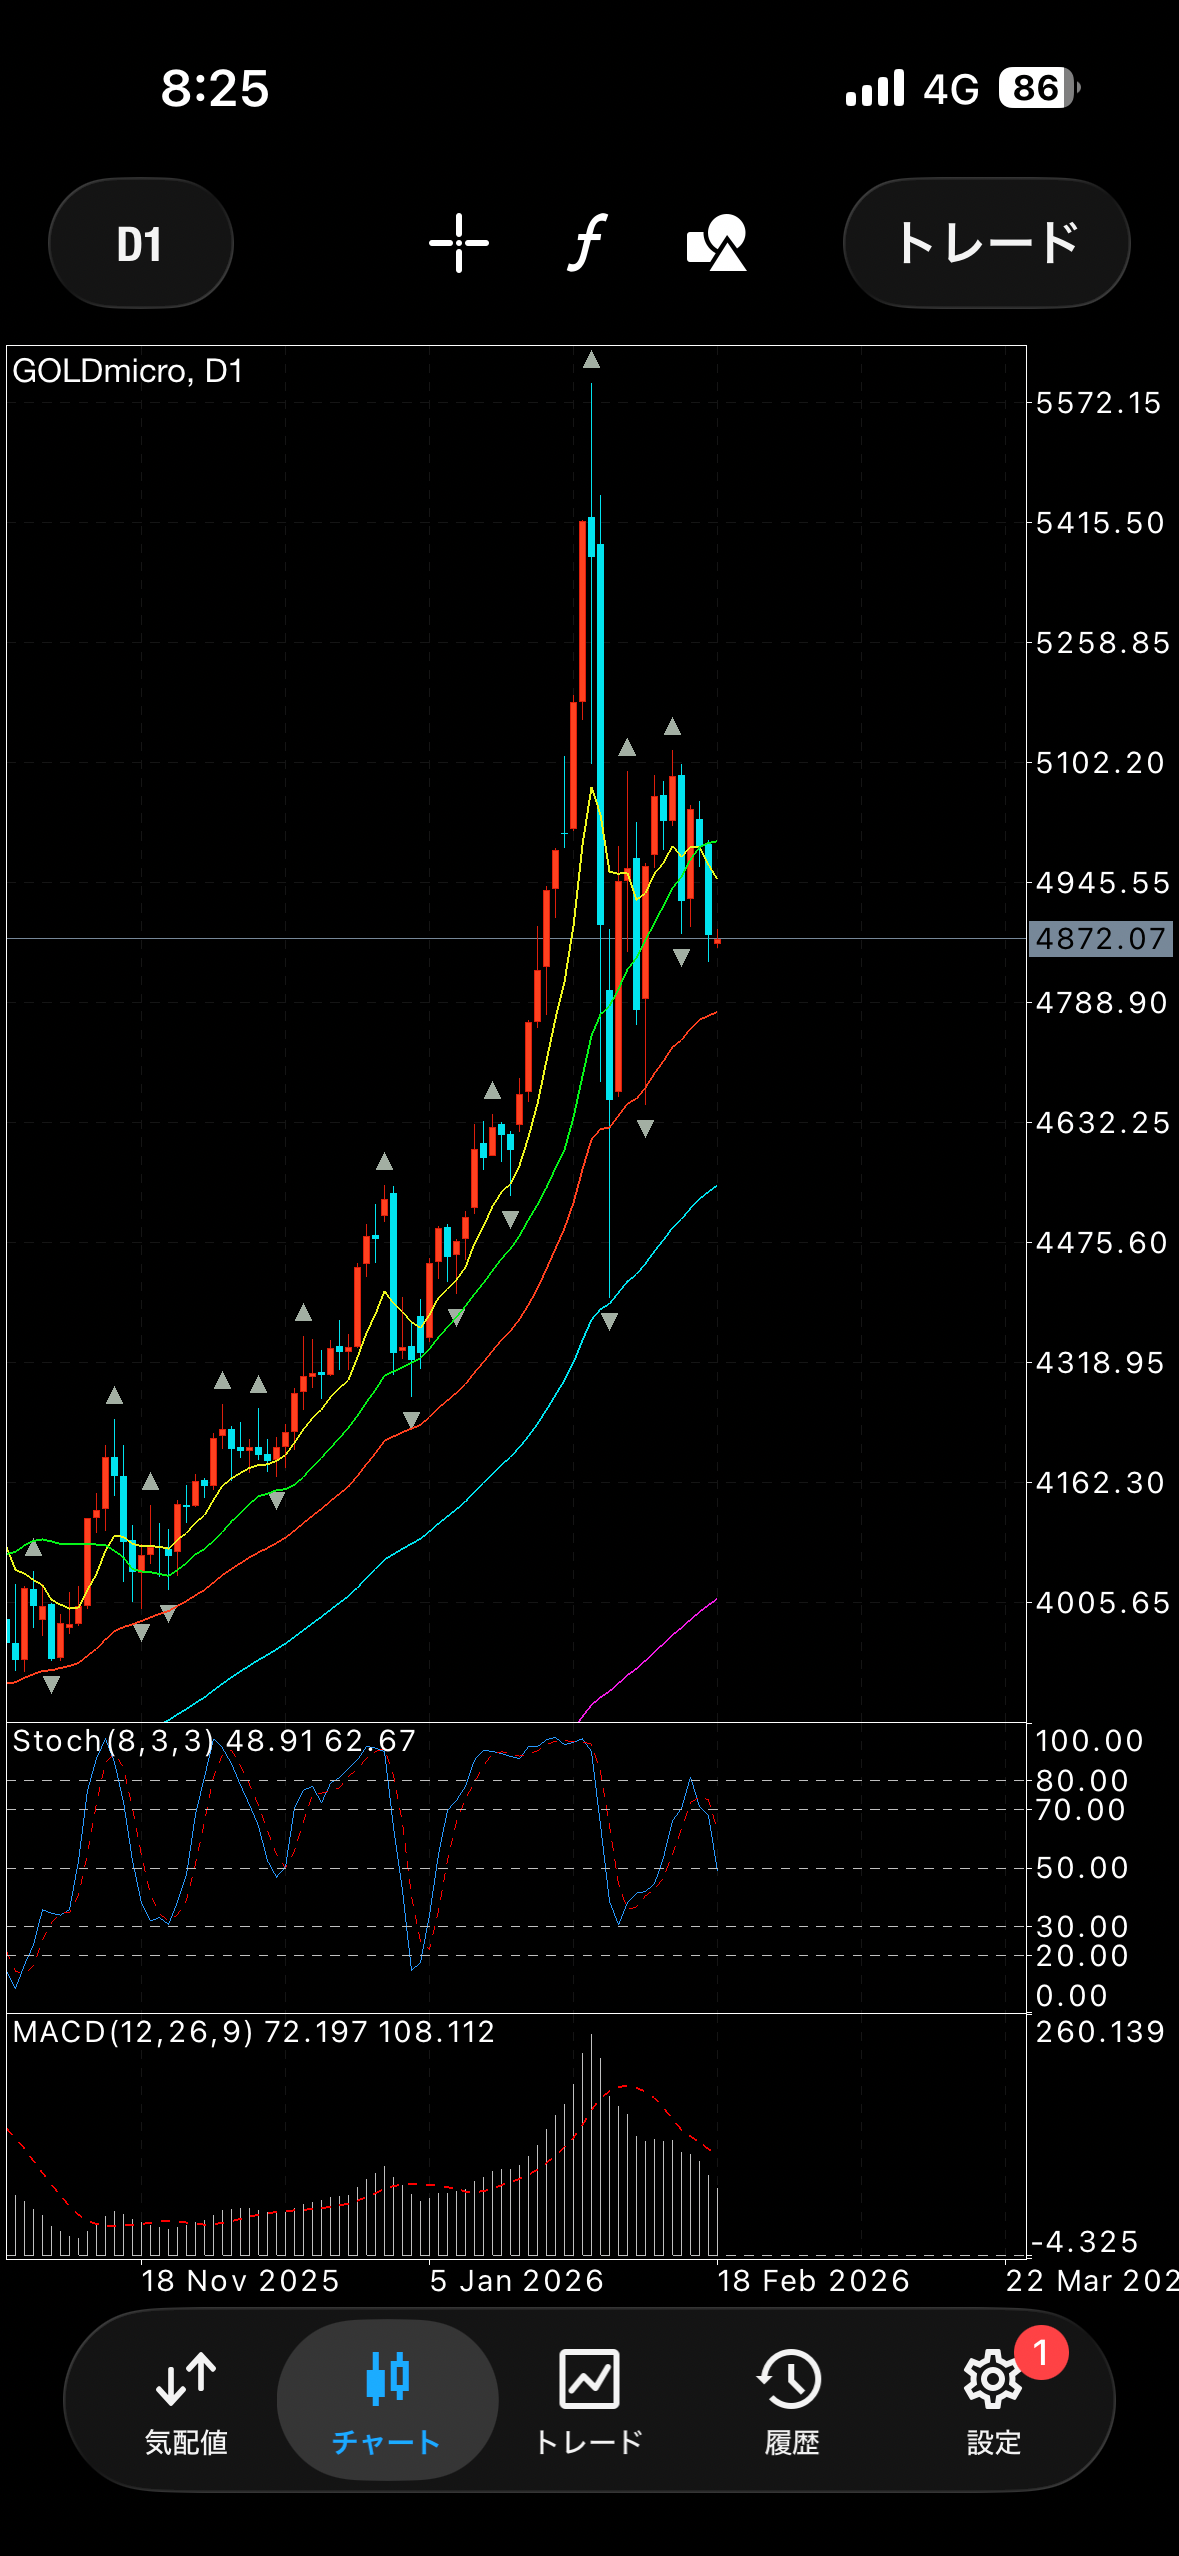
Yesterday, 2/17, the gold daily chart was a bearish candle.
It would be a decline of about 1000 pips.
The body of the previously appearing bullish candle also fell below, and the 20MA was broken, so the bearish outlook appears stronger.
× ![]()