

TDM (the Moon’s trading day) reveals the dollar-yen’s “true face”
While many traders seek the "reasons for price movements" in the news, what truly governs the market is the physical constraint of the calendar—its cycle. In this analysis, the daily range of USD/JPY was tallied by Trading Day of Month (TDM), revealing an interesting anomaly.
Based on this data, we explain why USD/JPY tends to be sold on certain days and why certain days become sanctuaries for "buys." A thorough behind-the-scenes market解説.
1. Early-month "yen-strength bias": The TDM 1-2 trap
The graph highlights the most notable feature: a strong negative move (yen appreciation direction) at the start of the month, during TDM 1 and 2.
Generally, the impression is that early month attracts new investment and buying pressure, but the reality for USD/JPY is the opposite.
Background: Institutional investors and hedge funds reset the enlarged positions at the end of the previous month and reconsider new strategies at the start of the month. In this process, the unwinding of positions that had become too dollar-strong tends to lead.
Market events: In the face of important indicators at the start of the month, such as the U.S. Manufacturing ISM, there is a statistical tendency for dollar de-risking and selling, contributing to this strong move down.
2. Mid-month "darkening": Sharp declines at TDM 8-9 and 17
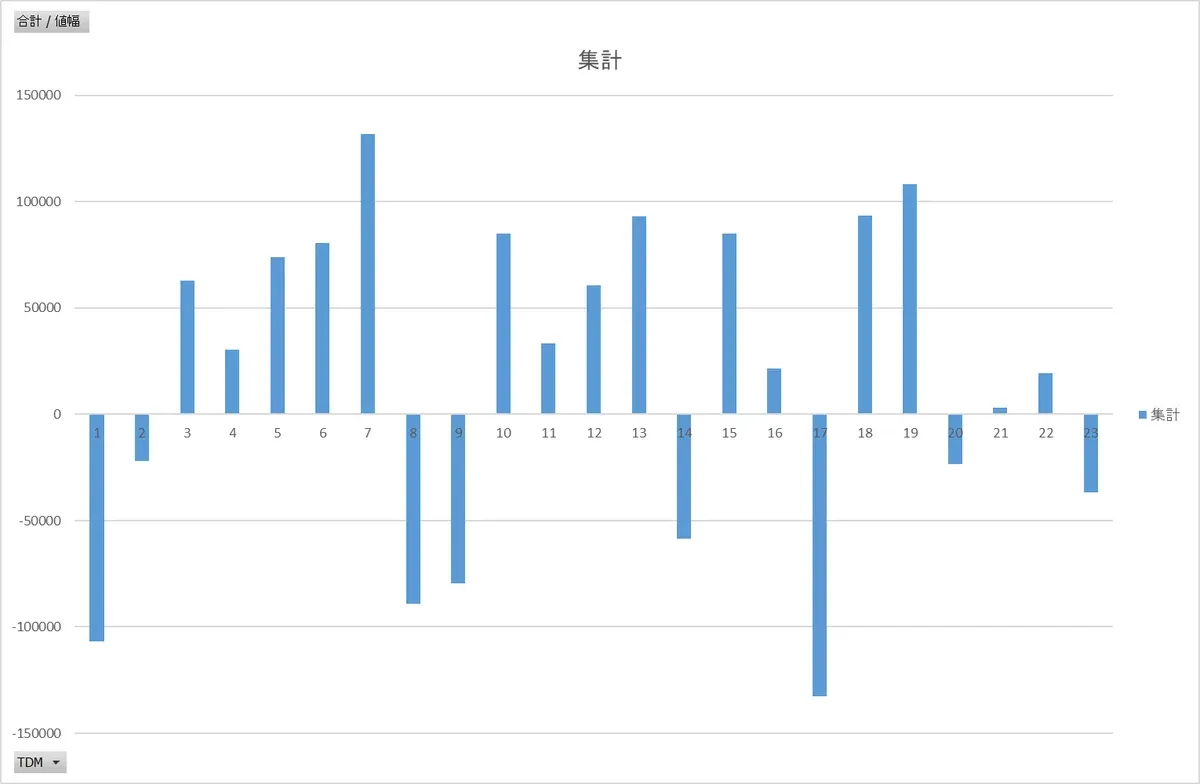
Next, the large declines at mid-month—TDM 8, 9, and 17—are particularly noteworthy.
This is a critical point where the unique USD/JPY "supply-demand turnover" occurs.
Reversal of real demand: After the dollar-buying by Japanese importing companies (50-day demand) has run its course, speculative funds push to sell in an attempt to exhaust liquidity.
News gaps: After the big event of the U.S. employment report (usually around TDM 5-7) passes and while awaiting the next CPI and policy meetings, dollar has been bought on expectations and then adjusts as reality sets in, which fits TDM 8-9.
The peculiarity of the 17th: Overseas players' technical fund movements, such as options cuts by the U.S. and mid-month bond redemptions, tend to tilt toward dollar selling and yen buying.
3. End-of-month "stall" mystery after the 20th
Viewed from above, TDM 10-19 shows a relatively upward trend, but after the 20th, at month-end, USD/JPY loses its upward momentum again.
The magic of Longfin: As month-end London fixing approaches (around 24:00), multinational corporations and public pension funds adjust currency allocations. In recent years, there is a tendency for “dollar selling and foreign currency buying” balance to rebalance against excessive dollar strength, dampening dollar upside near month-end.
Japanese players’ profit-taking: Export-oriented Japanese companies and investors seek to lock in monthly gains by converting profits back into yen, which tends to dampen upside after the 20th.
4. Summary: The TDM strategy investors should embed in their mindset
The rule of thumb for USD/JPY that emerges from this analysis is very simple.
“Do not rush to buy dollar dips at the start of the month.”
First observe the heavy selling pressure at TDM 1-2 and wait for it to ease.
“Exploit the mid-month plunge (TDM 8-9, 17).”
These are often temporary pullbacks, so in an uptrend they can provide excellent buying opportunities.
“Don’t chase into month-end; lock in profits.”
After the 20th, judge that the window for dollar strength is closing and scale back positions as a professional move.
There are days when moves are predetermined before any news. If you incorporate this TDM analysis into your trading strategy, you can evolve from being swept up by large flows to anticipating and riding them.
‘Annual yield 3287%. USD/JPY correlations at the extreme — a macro-indicator-driven “late-to-the-game” investment strategy.’
“For those tired of the candlestick misleads, a fundamental FX operation model that wins through global economic causality.”
https://www.gogojungle.co.jp/tools/ebooks/75653?via=users