

Usage of “Visualization Indicator” (Part 238)
“Visualization Indicator” utilization(its2388)
1. “28Currency Pair List Indicator” to be further evolved into an indicator
“8CPVisualization Indicator” for USDJPY to be drawn
“8CPVisualization Indicator” includes Oceania edition, London edition, New York edition, AnyCP edition. This time, we used the London.
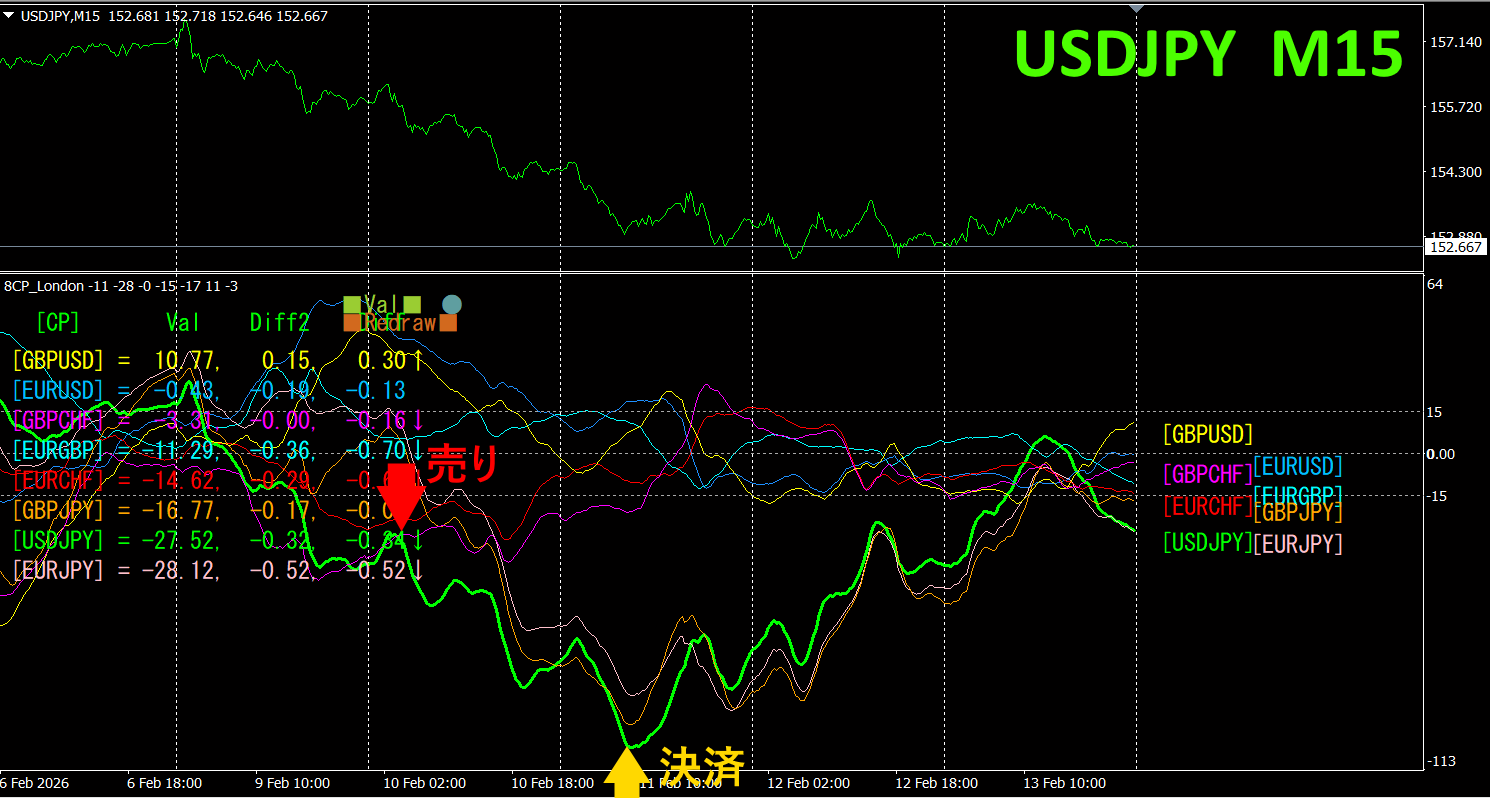
Upper half is, USDJPY 15-minute chart. Lower half is from the “8CP Visualization Indicator”, the green graph corresponds to USDJPY.
On Tuesday, the USDJPY graph fell below the other graphs group, so we sold. We closed the position at the bottom, earning about 330 pips. Take only what you can, and do not trade further.
Currency Strength-Weakness Graph
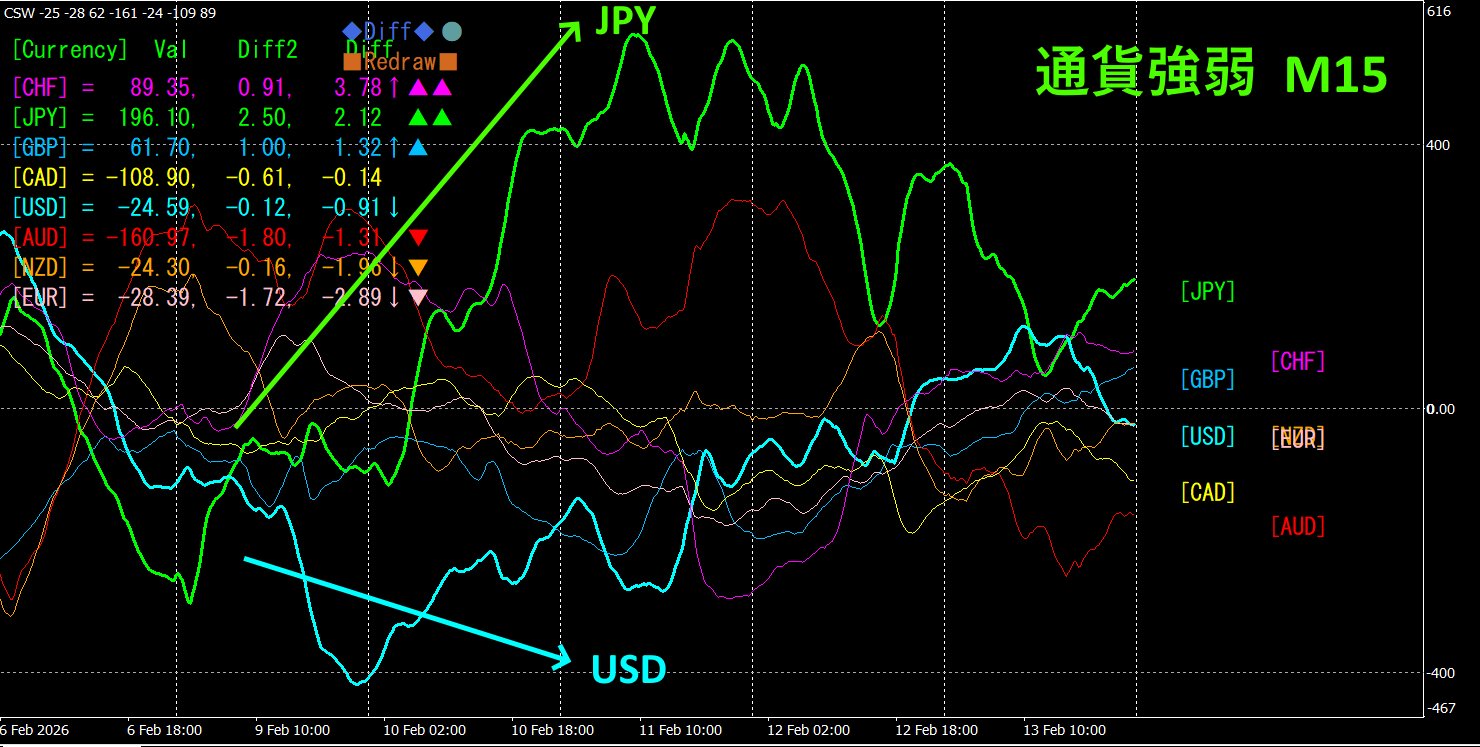
Looking at the 15-minute currency strength graph, JPY is strong, USD is weak, and in the currency strength graph, JPY and USD show a remarkable inverse correlation
The relationship between JPY and USD is at JPY > USD, focus only on the parts where USDJPY spreads wide, then sell USDJPY.
In FX trading, pick the currency pair that is currently growing the most and showing inverse correlation, and the results will follow naturally
“Target currency strength inverse correlation!” is a fundamental rule in FX.
Using “TrendLine-EX” allows entering and exiting automatically when slanted trendlines are breached. Since you can just leave it as is, easy trades become realizable. “TrendLine-EX” is a semi-automatic EA that can do automated selling on breakdowns and automated exiting on line breaks.
2. Try Best Select Indicator
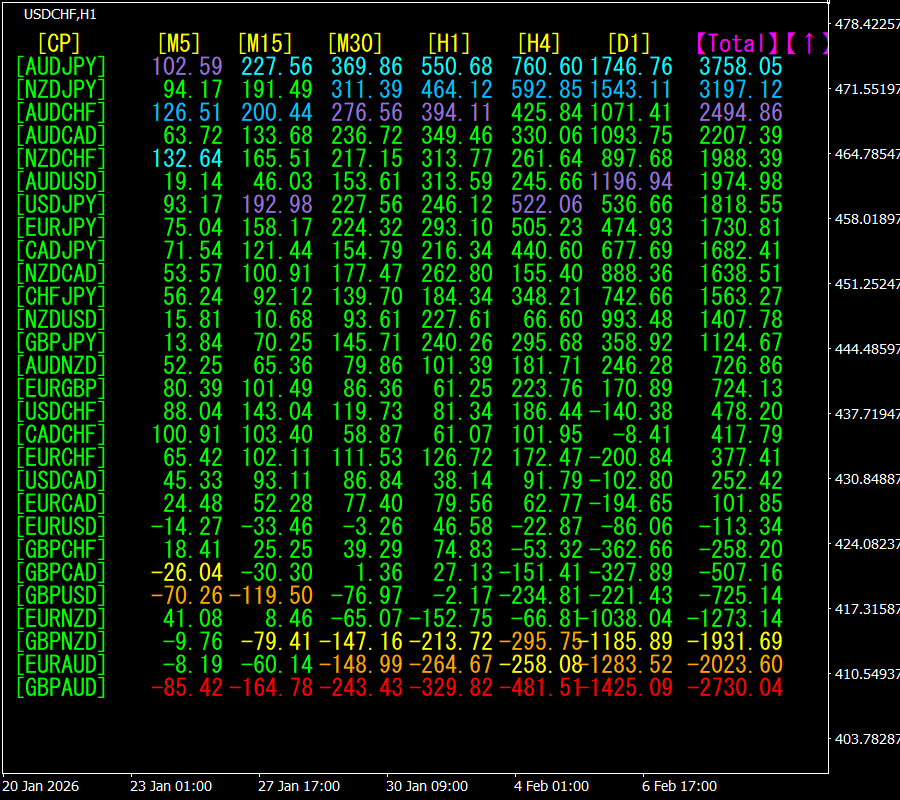
The below image is a screen capture from February 9, 2026, 08:28 (JST) .
[Total] is sorted in descending order. The top item, AUDJPY, shows blue on all timeframes as the color scheme of the entire display. The Total value is 3758.05, a large positive number. This indicates a strong uptrend in AUDJPY.
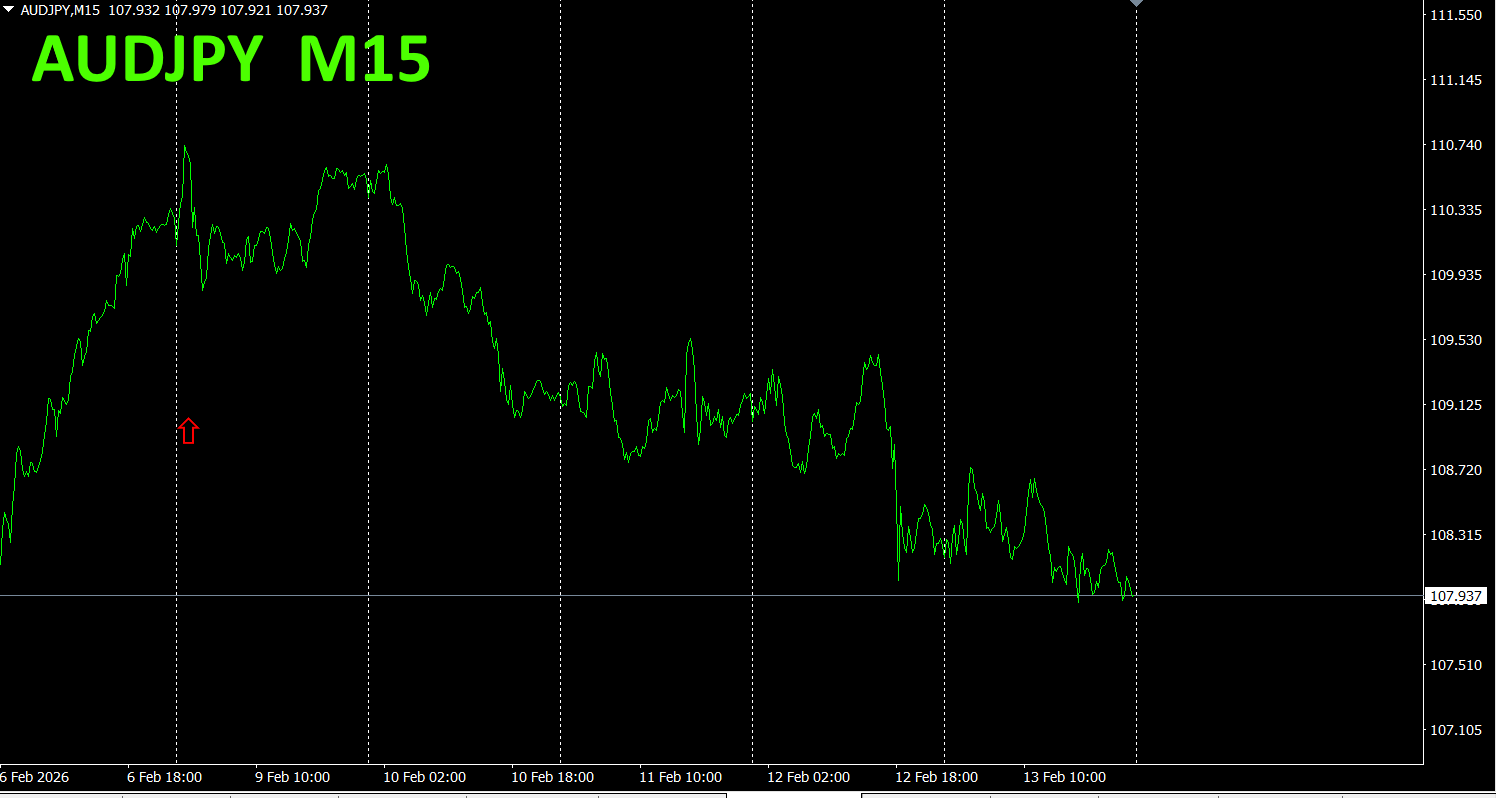
Now, let’s look at AUDJPY chart.
The red arrows mark where the screenshot was taken. It captures the rapid rise.
“28 Currency Pairs Best Select Indicator” lets you easily identify which of the 28 currency pairs is showing the strongest trend. It also indicates, via numbers and colors, whether you should trade now. This is an excellent indicator to judge all currency pairs at a glance.
“28 Currency Pairs Best Select Indicator”.

3. Since May 2021, what happened with EURJPY
We have tracked EURJPY since May 2021
To see the overall trend, we have drawn roughly the last three weeks on a 30-minute chart
Previously we wrote as follows
Pink is EUR, green is JPY.JPY has risen slightly, while EUR is moving horizontally or slightly down.Therefore EURJPY is expected to move downward.
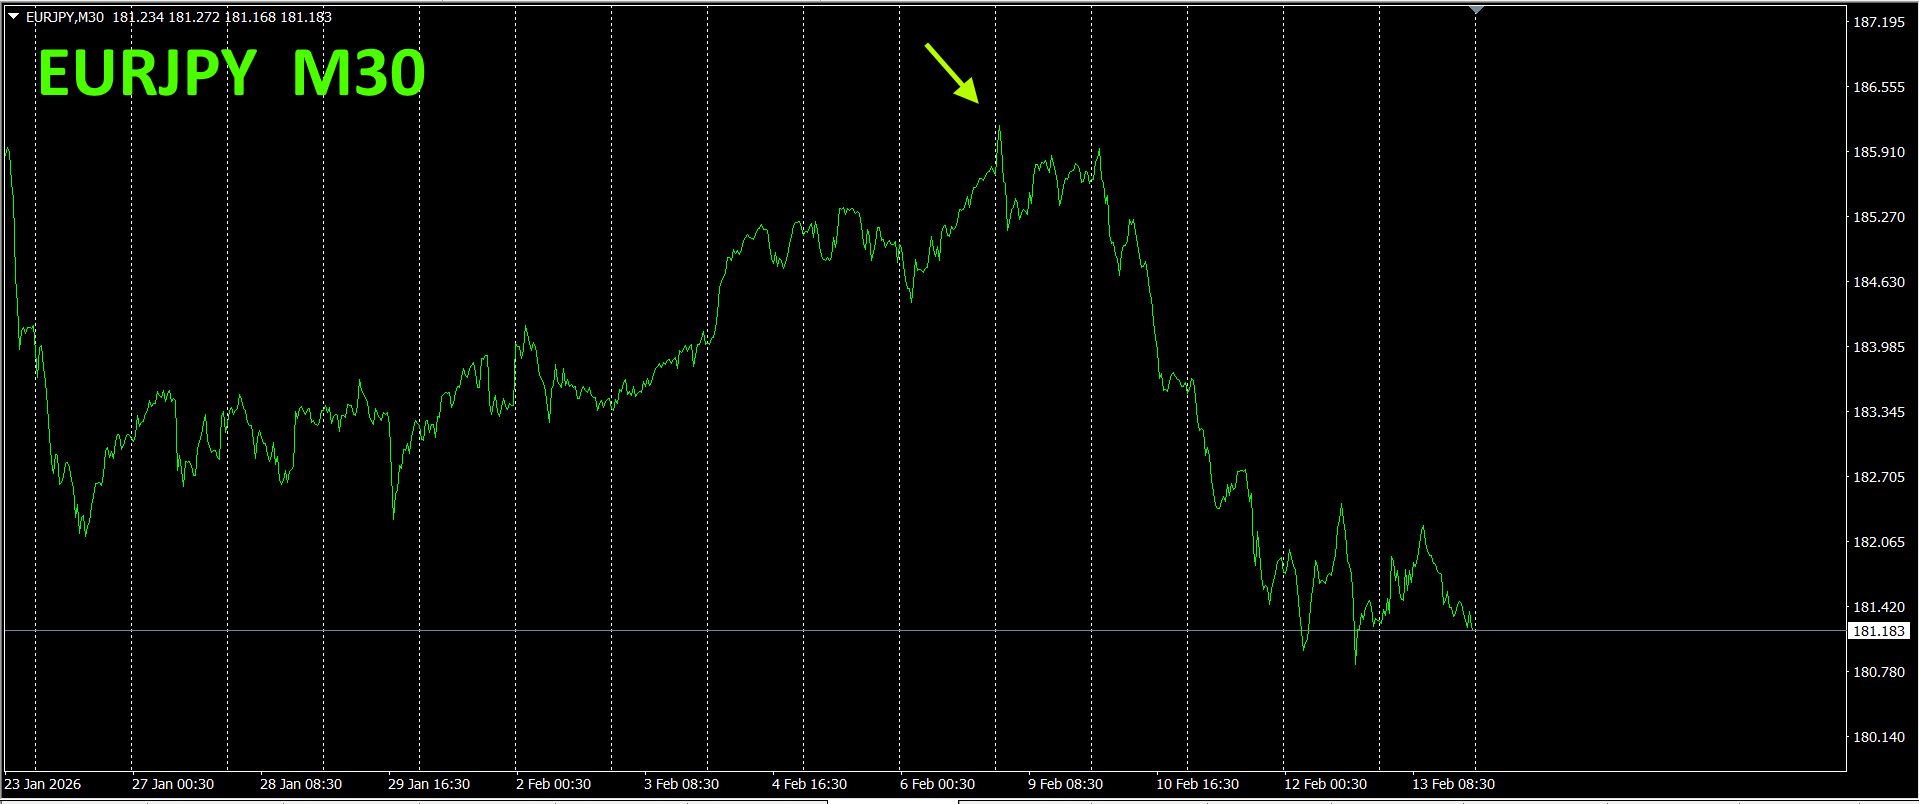
As predicted, it moved down significantly. Due to the strengthening of JPY, a large decline is considered likely.
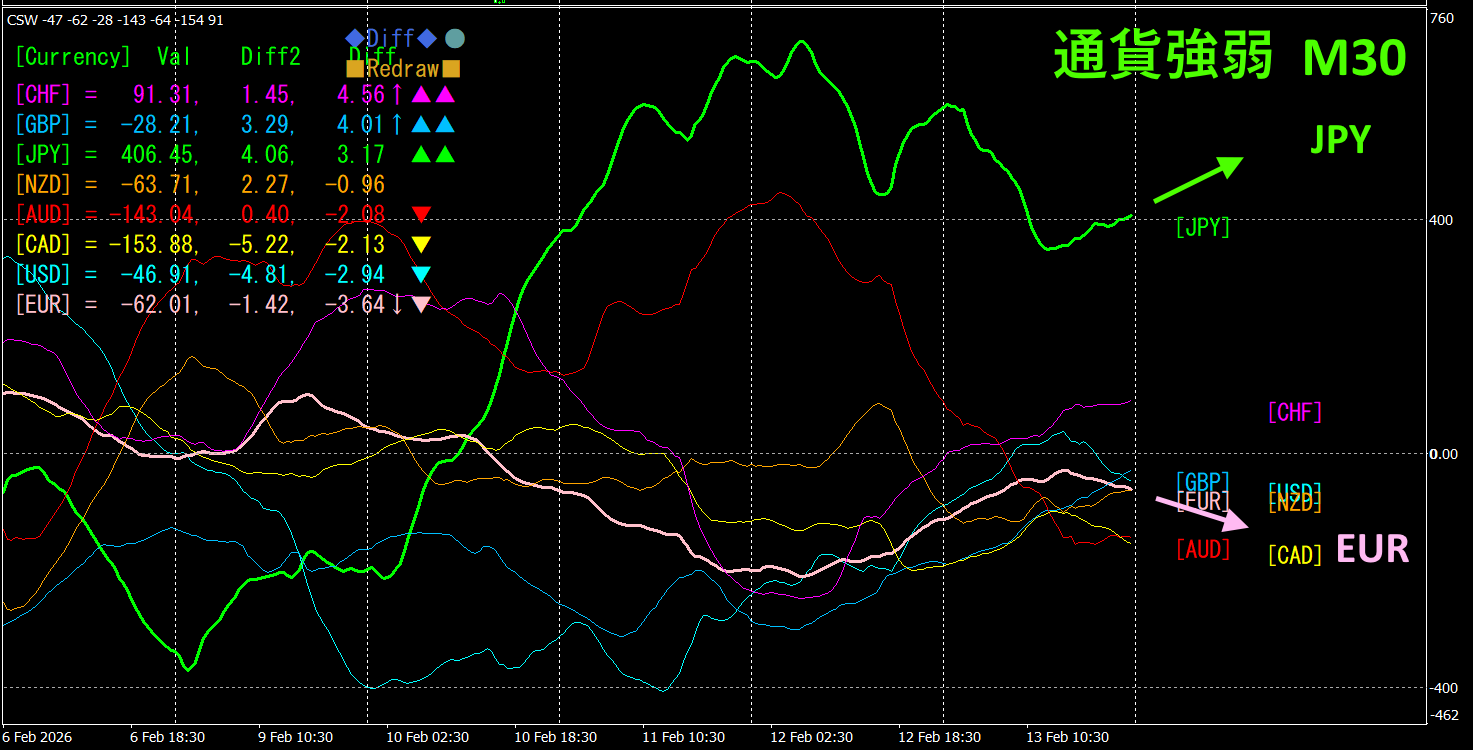
30-minute currency strength chart
Pink is EUR, green is JPY.JPY is rising, while EUR is flat to slightly downward. Therefore is expected to continue downward.
MT4
A trend indicator that clearly shows direction with colors. If the color bars are Lime, it’s a buy; if Red, it’s a sell. It’s easy for beginners to use. If bars are green, an uptrend; if red, a downtrend; if no color, no trend.With color indication, you can grasp trend state at a glance.
We applied this indicator to USDJPY on a 1-hour chart.
The red sell zone and green buy zone are clearly separated, making trading easy at a glance.Most of the chart is in red zone. In the above image, focus only on the white ellipse-marked area and trade by selling.
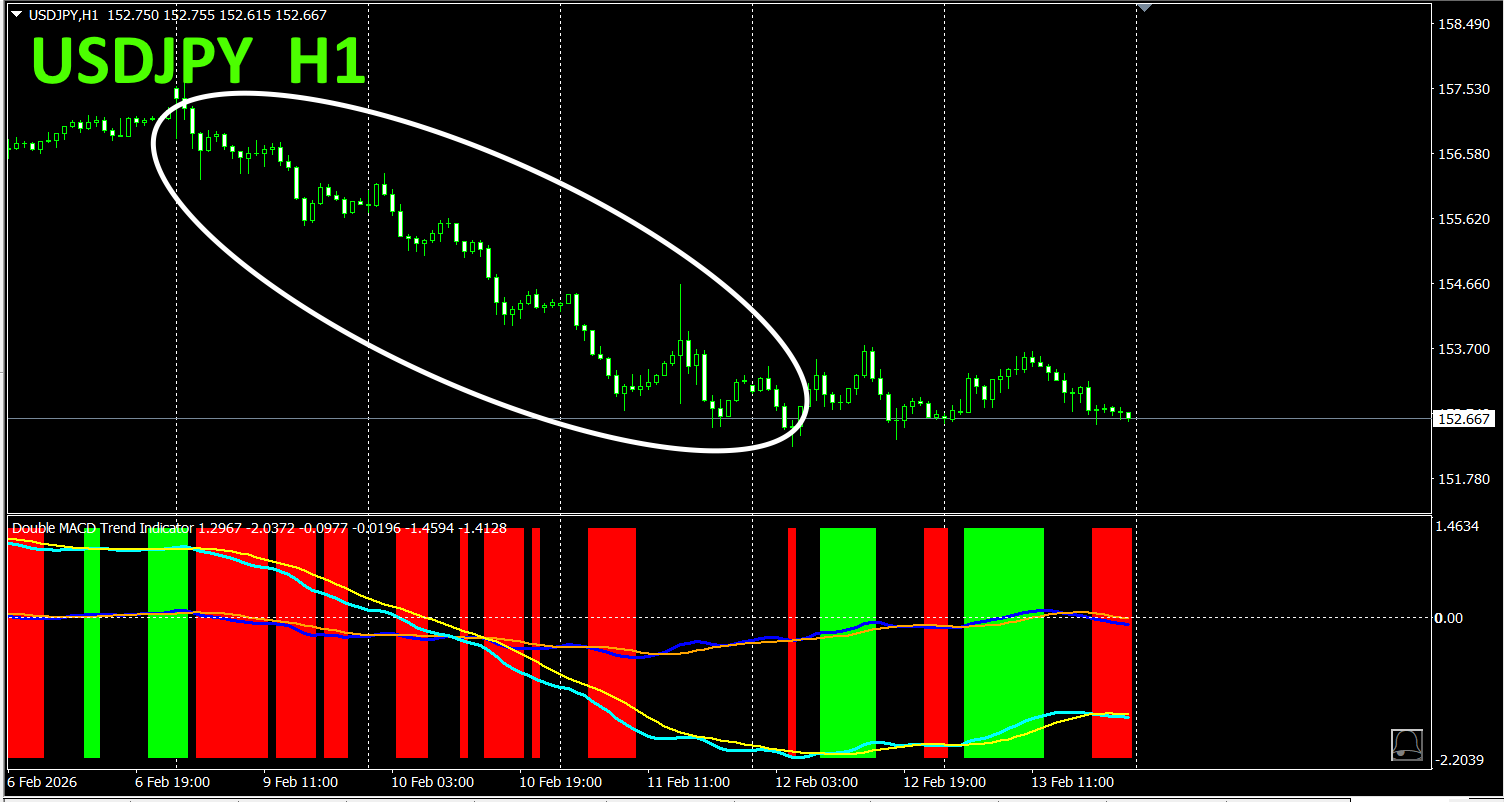
With “Dual_MACD_Trend_Indicator”, buy in green zones, sell in red zones, and do not trade otherwise.
Using “Dual_MACD_Trend_Indicator” removes any doubt about trading direction.
5. Hyper-CSW has been released
“Hyper-CSW” is a high-performance indicator that visually shows the strength of the eight major currencies at a glance. It records the strongest currency and score for the past 10 bars on the timeframe being displayed, helping to accurately capture trend persistence and turning points. Additionally, multi-timeframe analysis支持 shows currency strength rankings (top 4 currencies) across multiple timeframes such as M15, H1, H4, D1, W1 with scores. With high-visibility color lines and a separate window display, it gives you the power to discern market direction. For details, see the following link

https://www.gogojungle.co.jp/tools/indicators/65082
“8CFD Visualization Indicator Any Version”
https://www.gogojungle.co.jp/tools/indicators/32288
“Toretore Indicator”
https://www.gogojungle.co.jp/tools/indicators/50115
“TrendLine-EX”

https://www.gogojungle.co.jp/tools/indicators/42257
“8Currency Strength Visualization Indicator” described on the following page.
MT4 https://www.gogojungle.co.jp/tools/indicators/39150

https://www.gogojungle.co.jp/tools/indicators/39159
【】


