

Dashboard_Harmonics_v9's three strengths
Introduction
In FX trading, the “harmonic patterns” boast a high reversal probability.
However, there are barriers many traders face.
“It’s hard to spot patterns, and I miss them.”
“It’s physically impossible to monitor multiple currency pairs.”
“Fibonacci calculations are cumbersome.”
To solve these concerns at once,Dashboard_Harmonics_v9has been developed. This article explains in detail the overwhelming features of this tool and how to use them.
Three strengths of Dashboard_Harmonics_v9
1. One-shot monitoring of multiple currencies and multiple timeframes
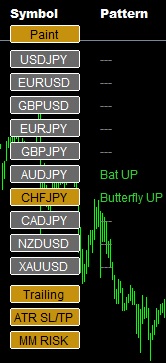
The biggest feature of this tool isthe ability to list the pattern detection status for all currency pairs and all timeframes on one chart.
Efficiency:You don’t need to open and close dozens of charts.
Visualization of opportunities:When a pattern forms, you are immediately notified on the dashboard.
2. An interface optimized for visibility and operability
In v9, operations have become even more intuitive than before.
| Function | Content |
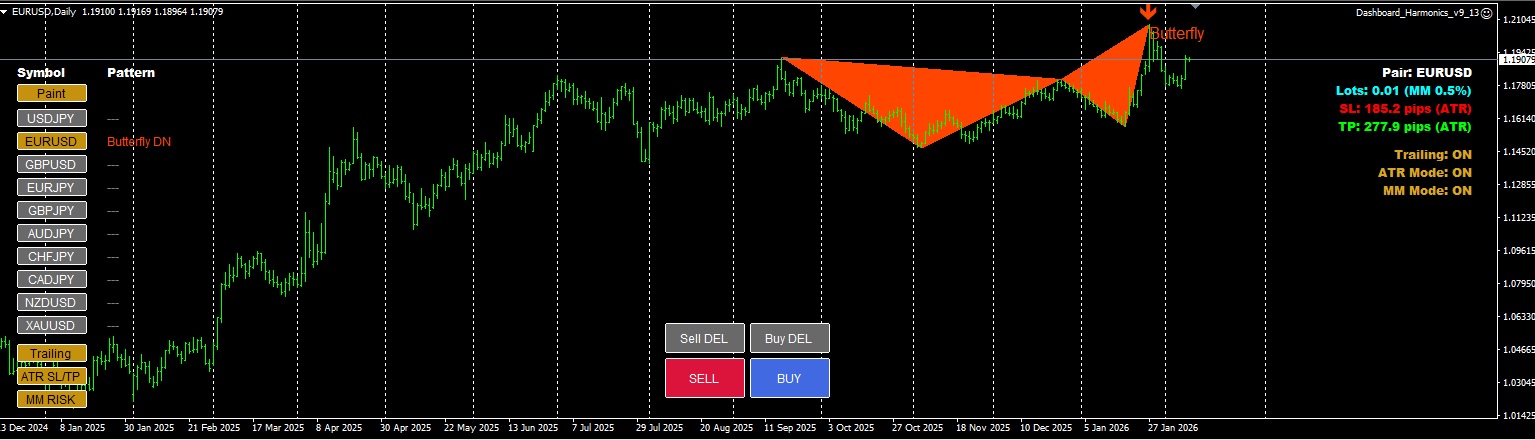
| One-click display | Simply click the currency name on the dashboard to instantly switch to the corresponding chart. |
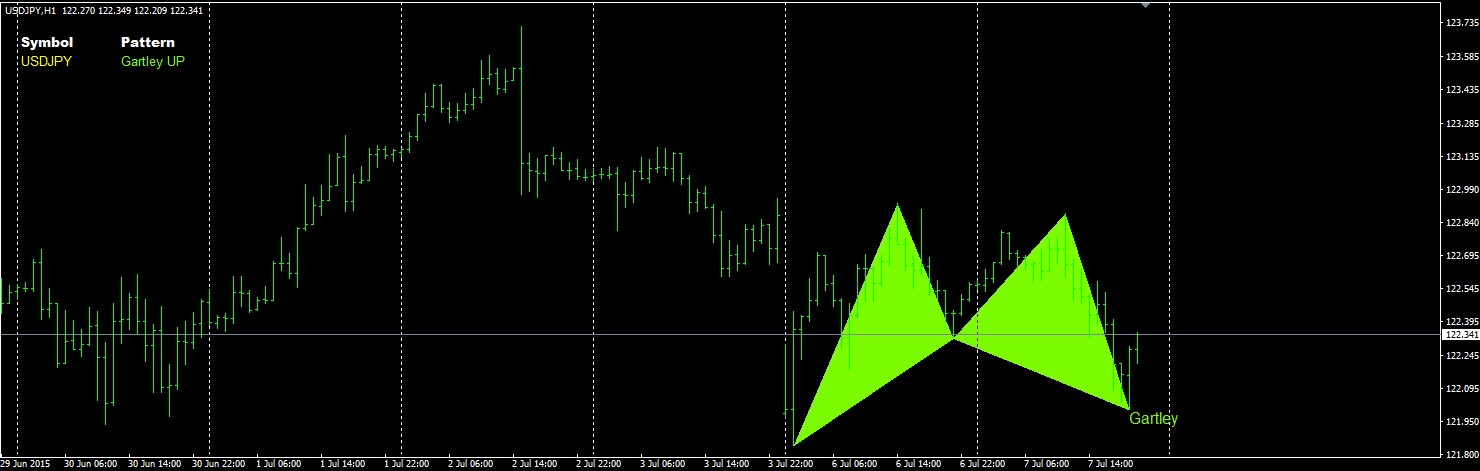
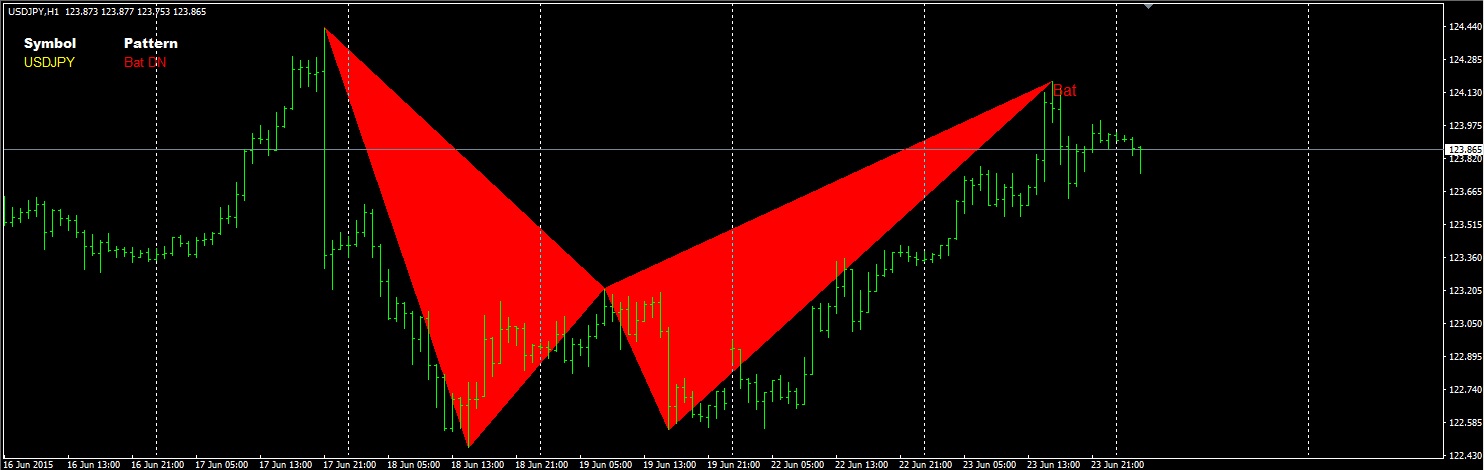
| Refined drawing | Covers major patterns such as Gartley, Bat, Butterfly, Crab, Shark, etc. |
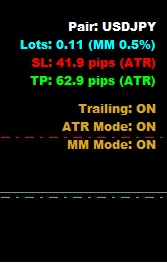
| Target display | Automatically draws the guidelines for entry, stop loss (SL), and take profit (TP). |
Practical trading usage image
Harmonic patterns aim to reverse at the “PRZ (potential reversal zone).” With Dashboard_Harmonics_v9, you can perform smart trades like the following.
Alert occurrence:Confirm pattern completion on the dashboard.
Environmental recognition:Check whether it aligns with the trend direction of the higher timeframe.
Entry:Place orders based on the drawn SL/TP guidelines.
Summary: For those who want to balance “time saving” and “precision” in trading
It is impossible to monitor the market 24 hours a day. However,Dashboard_Harmonics_v9will have the system monitor the market 24 hours a day on your behalf.
Want to improve the accuracy of discretionary trading.
Want to reduce monitoring time and gain more free time.
Want to know evidence-based entry points.
For those people, please try introducing this ultimate dashboard to your charts.
▼ The product page is here
https://www.gogojungle.co.jp/tools/indicators/75768