

[Master RCI and win with Moving Average Filter!!] Today's CHF/JPY 5-minute chart signal from mBDSR
【Mastering RCI!! Trend Reversal, Buy the Dip, and Sell on Retracements】
Indicator that shines in combination with RCI: 【BODSOR・mBDSR】
Methods, case studies (PDF) ★GogoJungle AWARD2020 winner★
https://www.gogojungle.co.jp/tools/indicators/11836
※This product【BODSOR・mBDSR】includes over 550 PDFs (totaling over 1,950 pages, over 1,900 chart images, and over 690,000 characters) as methods and case studies.
About the PDFs included in the above product
358 PDFs Included for 【BODSOR・mBDSR】
https://www.gogojungle.co.jp/finance/navi/articles/34271
【Mastering RCI!!】Summary of PDFs describing mBDSR (Moving Average Filter)
https://www.gogojungle.co.jp/finance/navi/articles/90127
【Mastering RCI!!】 PDF Additions: Collection of PDFs for trading using 5-minute signals (day trading)
https://www.gogojungle.co.jp/finance/navi/articles/89870
【Mastering RCI!!】 PDF collection for short-term trading on 1-minute charts (scalping)
https://www.gogojungle.co.jp/finance/navi/articles/88762
【Mastering RCI!!】 Summary of PDFs describing profit-taking points
https://www.gogojungle.co.jp/finance/navi/articles/89471
PDF collection for effectively using R1R2S2【Mastering RCI!!】
https://www.gogojungle.co.jp/finance/navi/articles/93154
【Mastering RCI!!】 PDF collection for effectively using the MT5 version of mBDSR
https://www.gogojungle.co.jp/finance/navi/articles/84918
mBDSR (RCI Filter)andmBDSR (Moving Average Filter)have different roles. The included PDFs also discuss how to differentiate their use.
Below, we introduce examples of signals formBDSR (Moving Average Filter)signals.
Swiss Franc / Japanese Yen CHFJPY 5-minute Chart
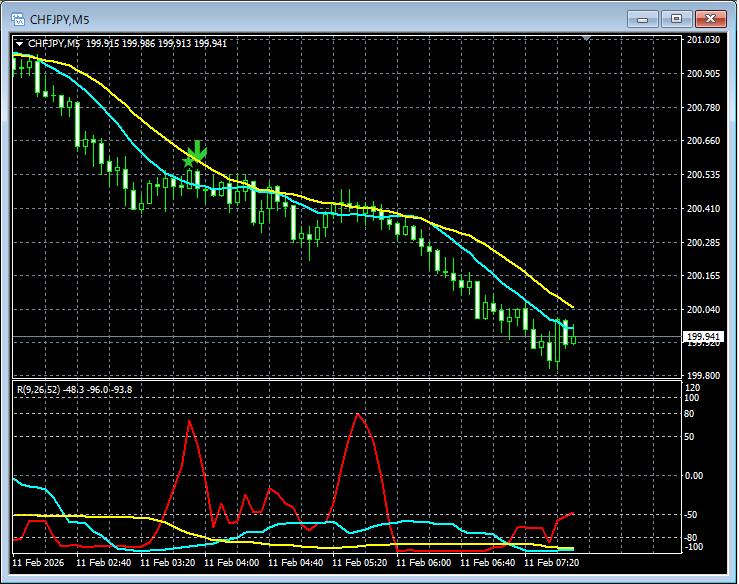
In the chart above,the signal from mBDSR (Moving Average Filter)lights up at an opportune timing.
In the case of the Moving Average Filter mBDSRas wellWhen combined with the higher-timeframe pullback using the three RCI linesfor a top-down analysis, you can achieve more favorable trades. This is also explained in the included PDFs.
※ Some charts mentioned in this article may have added circles, lines, or rectangles for clarity.
Indicator that shines in combination with RCI: 【BODSOR・mBDSR】
Methods and case studies (PDF) ★GogoJungle AWARD2020 winner★
https://www.gogojungle.co.jp/tools/indicators/11836
Over 550 PDF files (methods and case studies: over 1,950 pages, over 690,000 characters) are included.
Most of them are about logically linking the higher and lower timeframes using the three RCI lines, examining multiple lower-timeframe conditions sequentially, and ultimately waiting for buy-the-dip or sell-on-retracement signals on the lower timeframe (i.e., mBDSR signals).
Additionally,many materials focus on identifying points where multiple entry reasons overlap.There are also contents exploring methods to probe upside and downside targets using the three RCI lines.
In the PDFs,
more than 1,900 charts are used.
Blacksun's Indicators (List)
https://www.gogojungle.co.jp/finance/navi/articles/33779
Blacksun's Free Indicators and Free E-Books
https://www.gogojungle.co.jp/finance/navi/articles/90181
【Reference Videos (RCI and mBDSR Related)】
Signaling with environment recognition and multi-timeframe analysis using RCI (1)
https://www.youtube.com/watch?v=1prvET_M5mA
Signaling with environment recognition and multi-timeframe analysis using RCI (2)
https://www.youtube.com/watch?v=vR4oD-oMVQQ
Signaling with environment recognition and multi-timeframe analysis using RCI (3)
https://www.youtube.com/watch?v=C6DHn0lD-I4
Signaling with environment recognition and multi-timeframe analysis using RCI (4)
https://www.youtube.com/watch?v=QG1iNTnLyyQ
Signaling with environment recognition and multi-timeframe analysis using RCI (5)
https://www.youtube.com/watch?v=VYlGiy6Cllg
× ![]()


