

【Dollar-Yen】Intraday Level Assumptions / February 10 (Tue) Elliott Wave Analysis
[USD/JPY] 15-minute chart
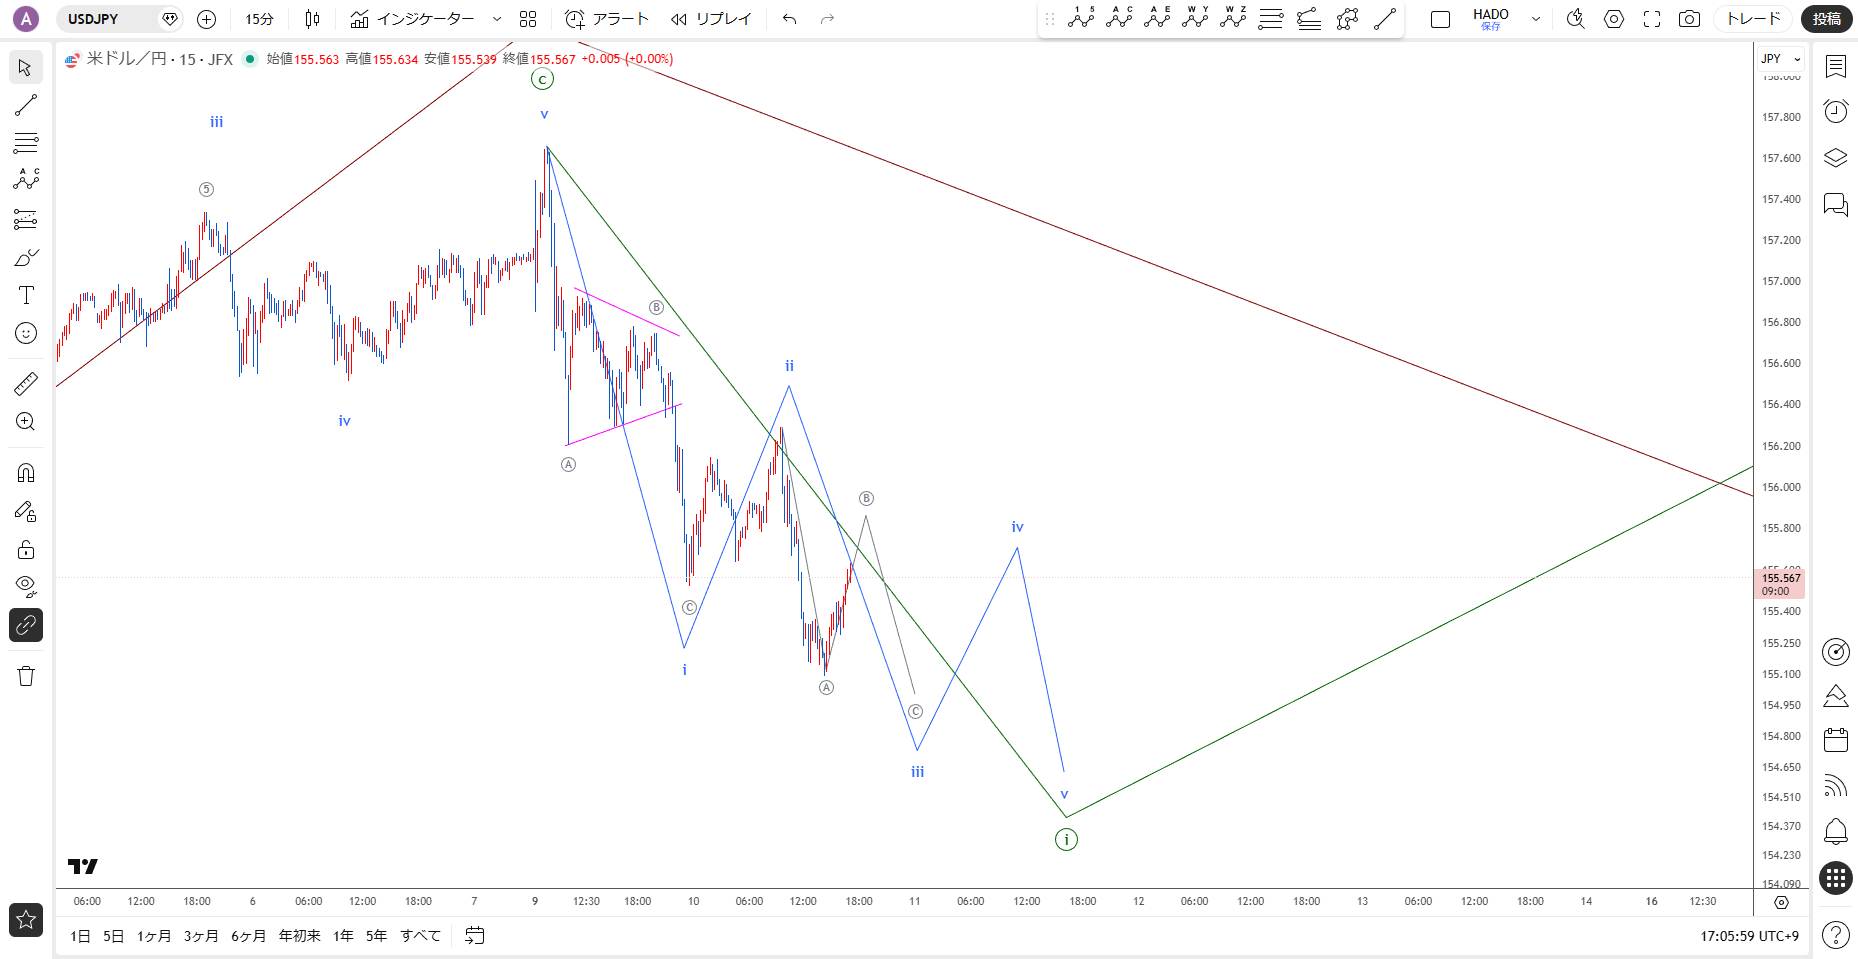
The pullback from the high looks like a zigzag of a B-wave triangle
I am considering the possibility of forming a green impulse wave 1 and a blue diagonal
From a fresh chart, you can perform the same high-precision analysis
You can read every price movement!
You can master the method of high-precision Elliott Wave analysis.
↓
× ![]()