

Utilization of the “Visualization Indicator” (Part 237)
「Visualization Indicator」 utilization(its237)
1. 「28currency pair list indicator」をさらに進化発展させインジケータ
「8CPVisualization Indicator」でto draw EURUSD
「8CPVisualization Indicator」にはOceania版、London版、NewYork版、AnyCP版があります。今回は、London版を使いました。
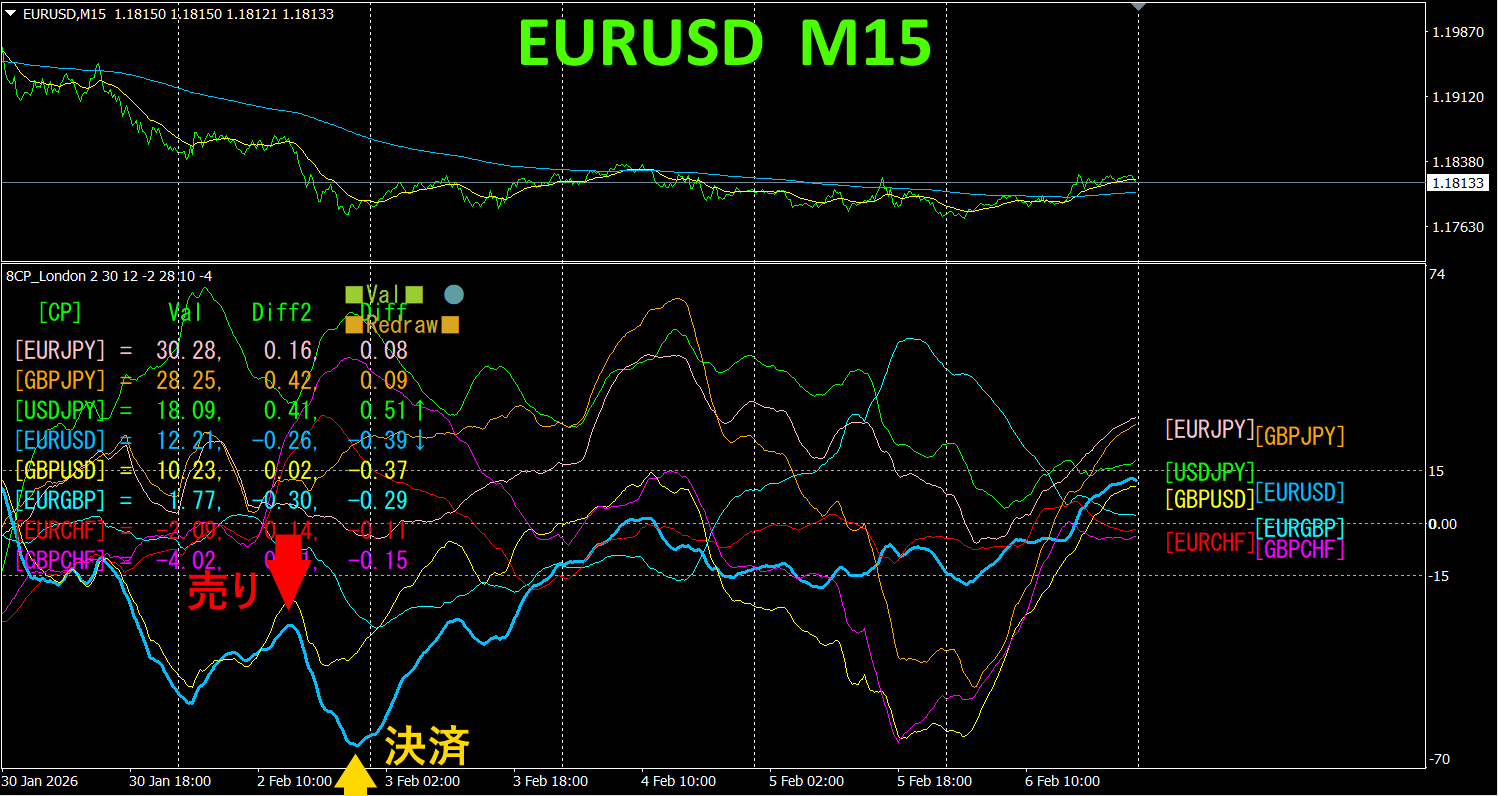
The upper half is、EURUSDの15分足チャートです。下半分は、colorful graph corresponds to EURUSD。水っているグラフが
On Monday, EURUSD graph dropped below other graphs, so、we sell。We close at the bottom、profit was about80pipsTake only what you can, and do not trade afterwards is the correct method。
Currency Strength/Weakness Graph
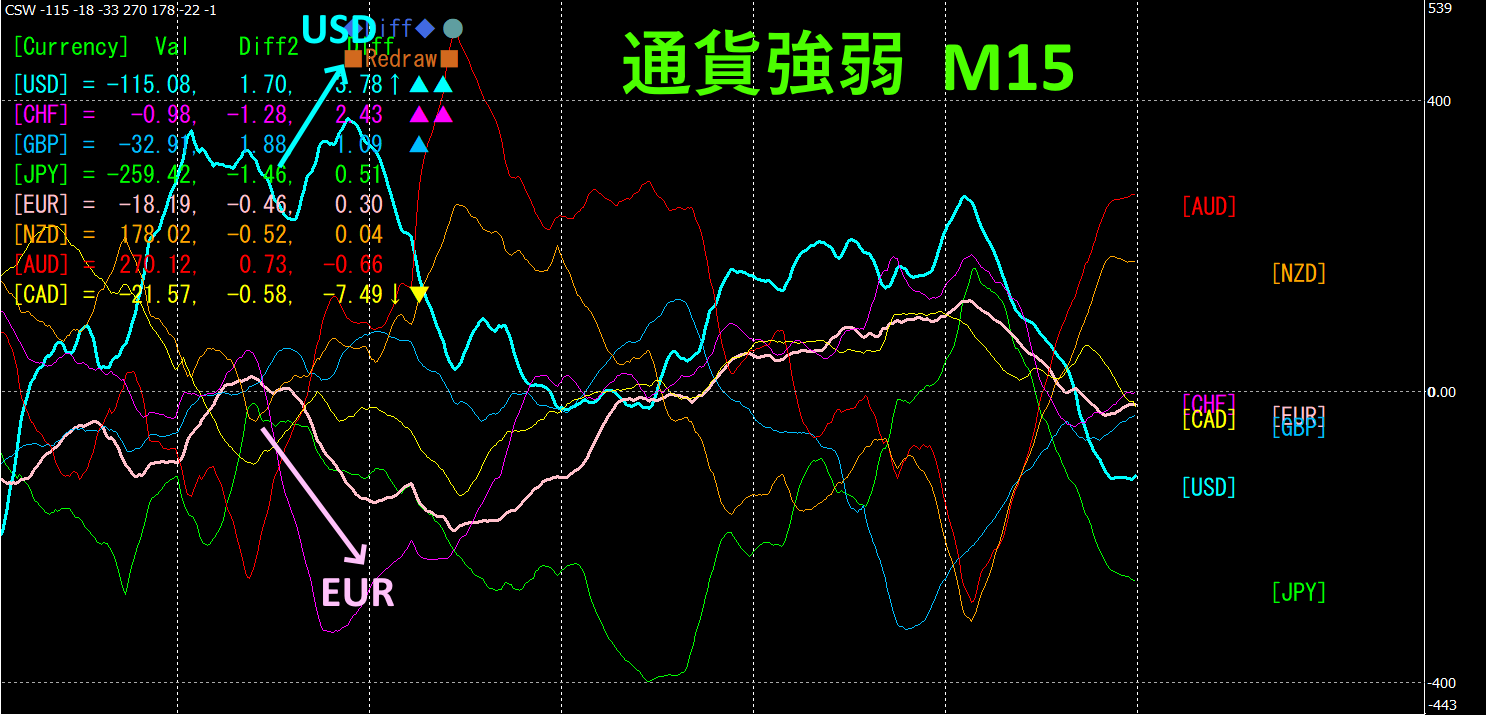
Looking at the 15-minute currency strength graph,、USD is strong、EUR is weak、and in the currency strength graph、USD and EUR show a clear inverse relationship.
The relationship between USD and EUR is USD>EUR, focus only on the areas where USD and EUR spread,trade EURUSD for selling.Because the inverse correlation chart is clean,
In FX,, results will come naturally
“Aim for Currency Strength Inverse Correlation!” is the iron rule of FX.
Using “TrendLine-EX”, you can automate entering and exiting on diagonal trendline breaks。Since you can leave it as is, you can realize easy trades. “TrendLine-EX” can automatically sell on trendline break below, automatically close on above - a semi-automatic EA.
2. Try Best Select Indicator
Below is a screenshot dated 2026 year 2 3日13:28(JST) のスクリーンショットです。
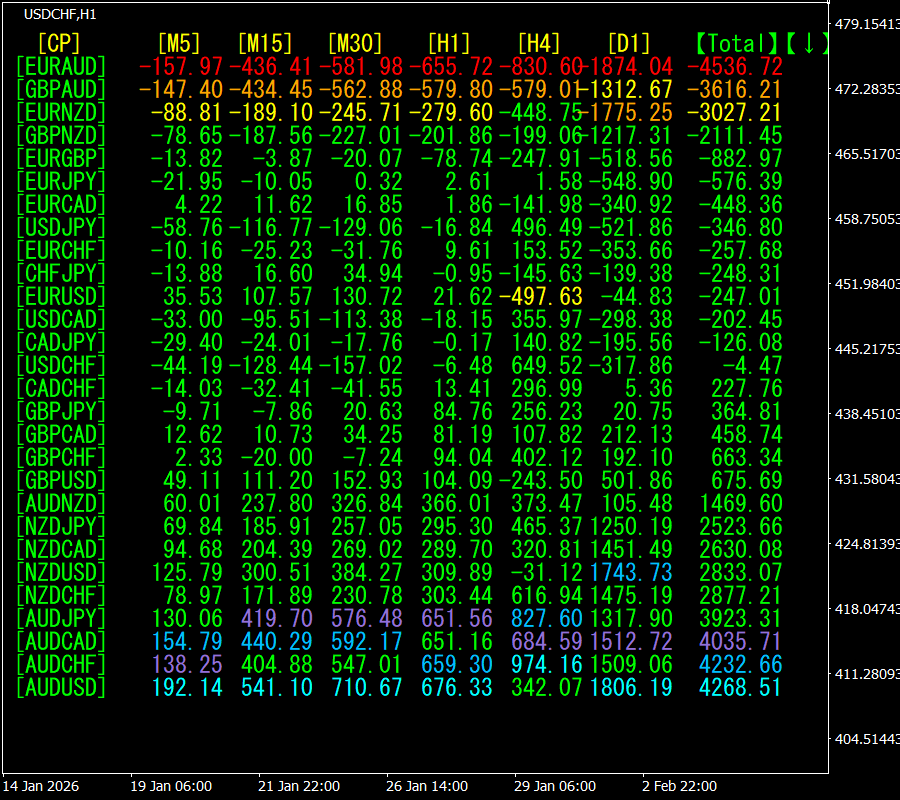
[Total] is sorted in descending order. The top EURAUD shows red color across all timeframes.Total value is -4536.72, indicating a large negative trend for EURAUD.This suggests a strong downtrend in EURAUD.
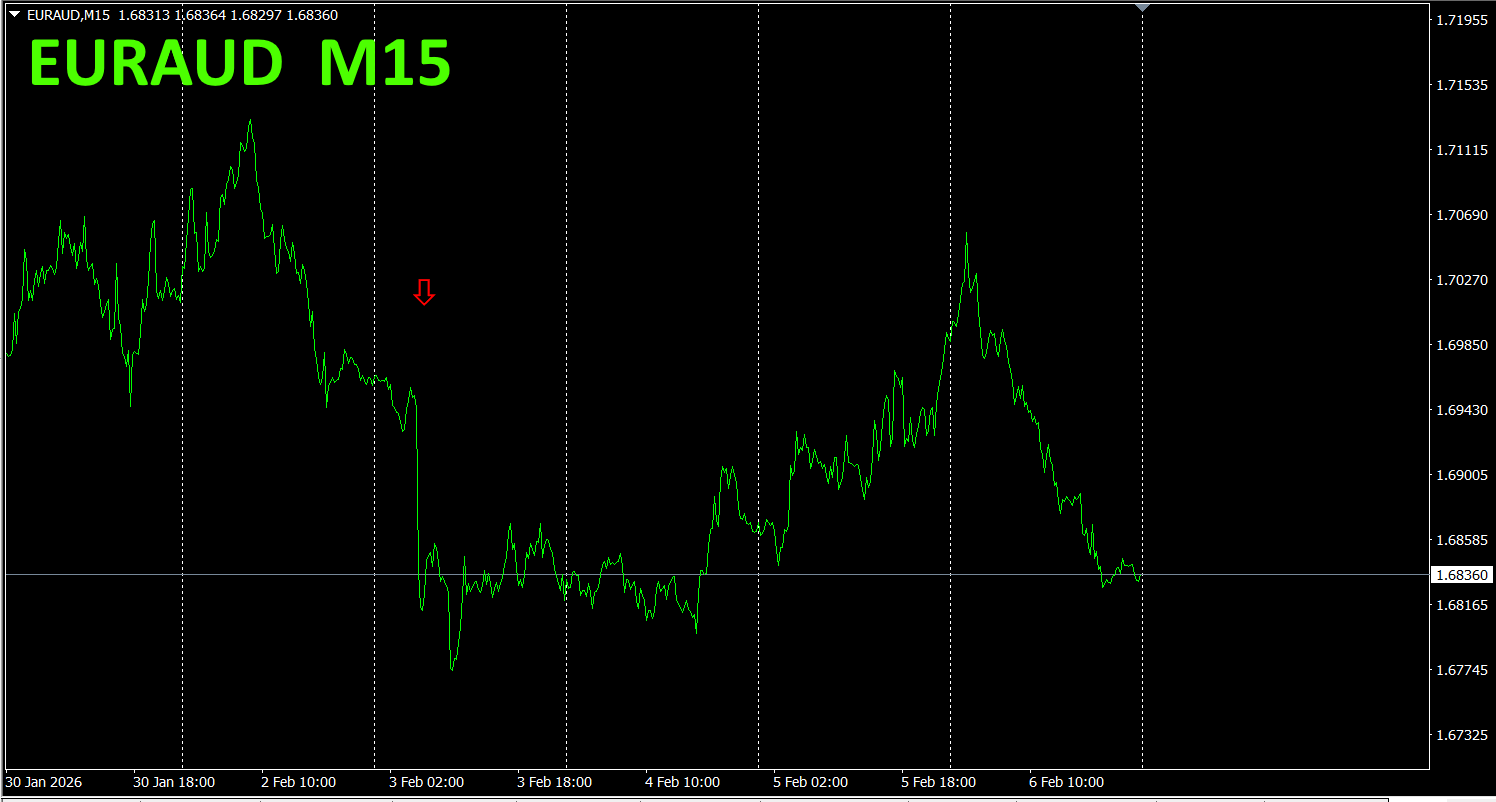
Now, look at EURAUD chart.
Red arrows indicate the point where the screenshot was taken。We captured a sharp decline.
The “28 Currency Pairs Best Select Indicator” helps you easily identify which of the 28 currency pairs is exhibiting the strongest trend. It also indicates, via numbers and colors, whether you should trade now. A single indicator that allows judging all currency pairs at a glance.
“28 Currency Pairs Best Select Indicator” can be found at”

https://www.gogojungle.co.jp/tools/indicators/35128
3. Since May 2021, EURJPY movement
We have tracked EURJPY movement since May 2021.
To view overall trends, a 30-minute chart covering the most recent about 3 weeks is drawn.
Last time I wrote the following。
Pink is EUR, green is JPY.JPY has moved slightly upward,EUR is horizontal to slightly downward.Therefore EURJPY is expected to move downward.
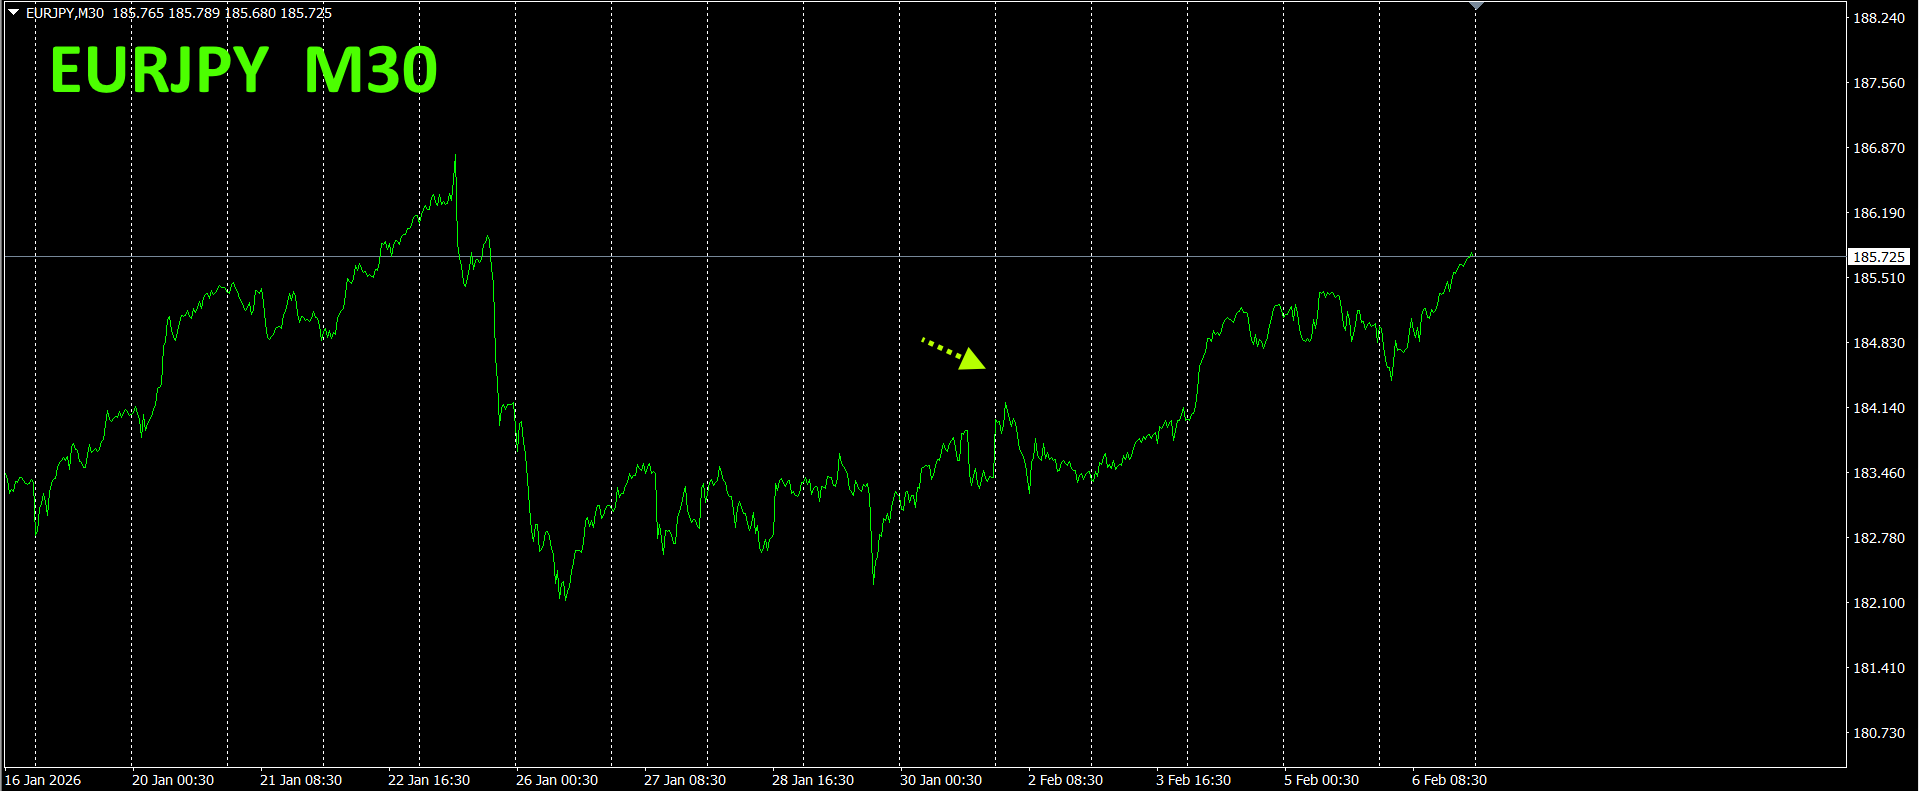
Monday, EURJPY slightly fell, but JPY weakened, so EURJPY rose.
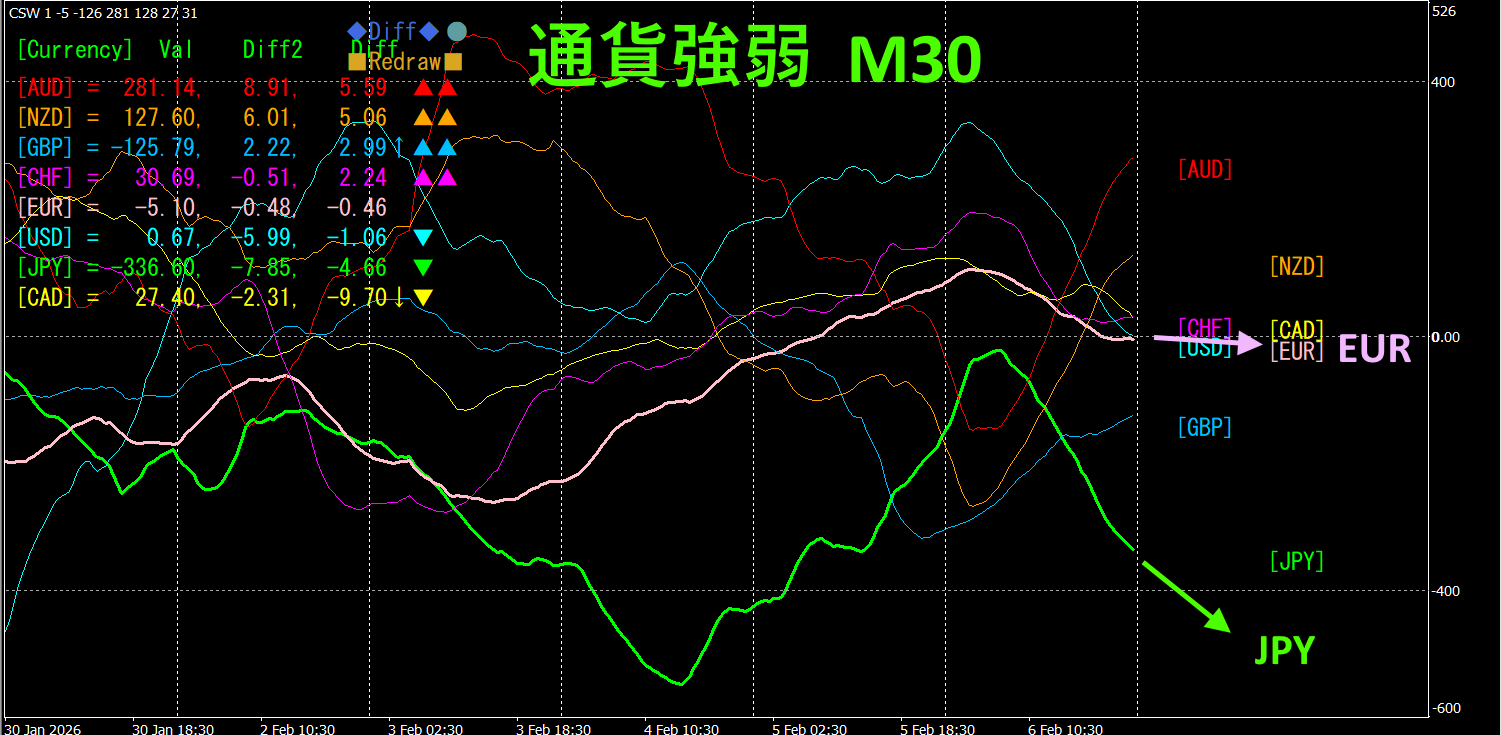
Thirty-minute currency strength chart
Pink is EUR, green is JPY.JPY is going down,EUR is slightly downward from horizontal.Thus EURJPY is expected to rise.
4.
MT4 version:https://www.gogojungle.co.jp/tools/indicators/62199
MT5 version:https://www.gogojungle.co.jp/tools/indicators/62202
A clear color-based indicator showing trend direction—if the color bar is Lime, buy; Red, sell; if no color, no trend. Color display allows you to grasp trend at a glance。Color indication enables quick trend assessment
Red in sell zone and green in buy zone are clearly separated, making trading easier at a glanceIn the above figure, focus only on the white oval-marked area and trade in order: buy, sell, buy.
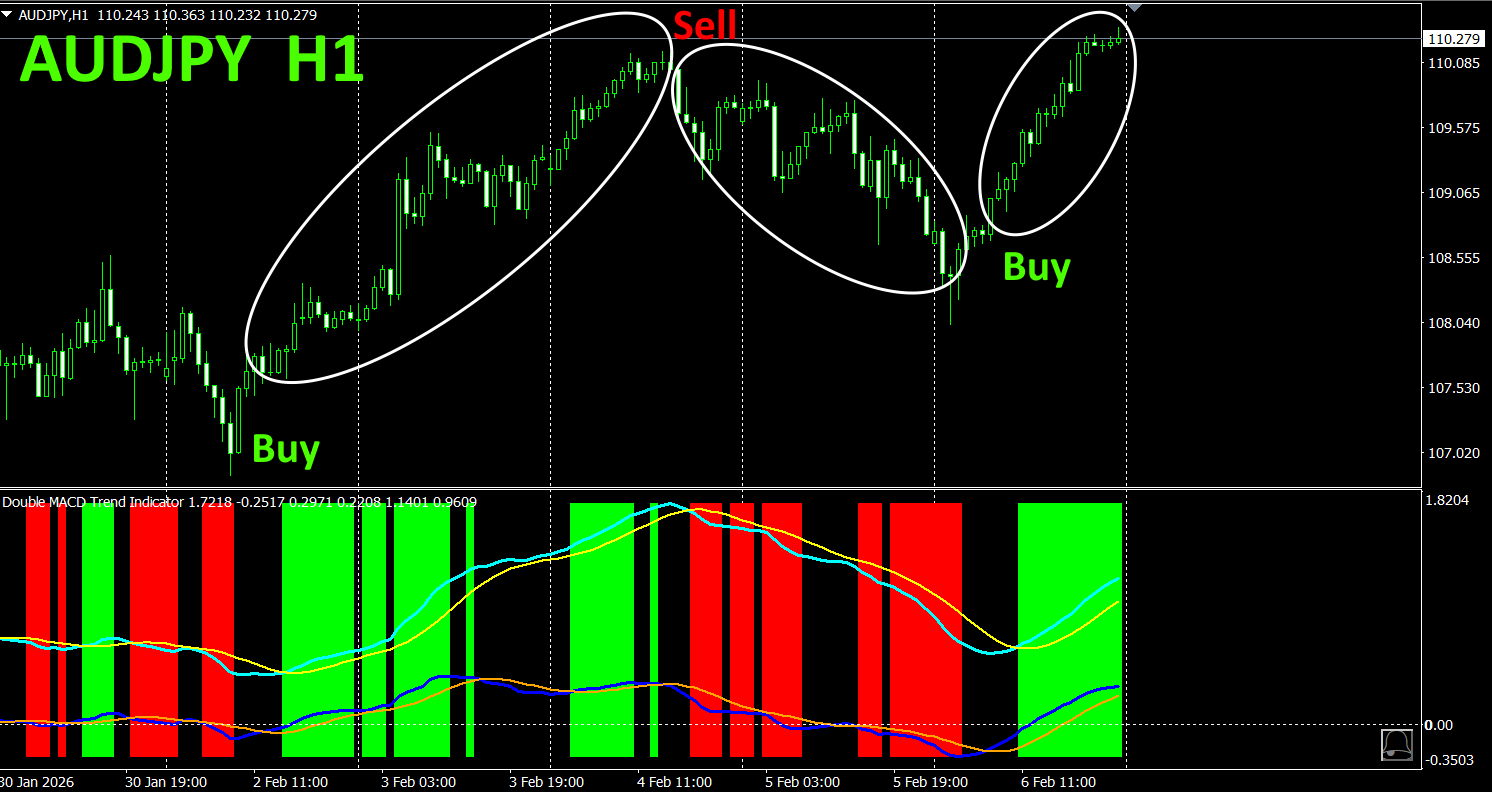
With “Dual_MACD_Trend_Indicator”, buy in green zones, sell in red zones, and do not trade otherwise—simple rule.
Using “Dual_MACD_Trend_Indicator” eliminates uncertainty about trade direction.

“Hyper-CSW” is a high-performance indicator that visualizes the strength of the eight major currencies at a glance.It records the strongest currency and score for the current timeframe's past ten bars, enabling accurate capture of trends and turning points.Additionally, multi-timeframe analysis supports ranking currencies across M15, H1, H4, D1, W1 (top 4 currencies) with scores.High-visibility color lines and separate window display empower you to determine market direction.See the following link for details
。
https://www.gogojungle.co.jp/tools/indicators/65082
「8CFD Visualization Indicator Any version」
https://www.gogojungle.co.jp/tools/indicators/32288
https://www.gogojungle.co.jp/tools/indicators/50115

https://www.gogojungle.co.jp/tools/indicators/42257
「8C Currency Strength Visualization Indicator」 is、please refer to the following page。

MT4 version https://www.gogojungle.co.jp/tools/indicators/39150
MT5 version https://www.gogojungle.co.jp/tools/indicators/39159
【My listed items】


