

The flow collapsed once and was reorganized again|February 6 EURCAD essence
── How to handle the period after the trend ends. 3EYE ATLAS SYSTEM perspective ──
Papa Trader Yu
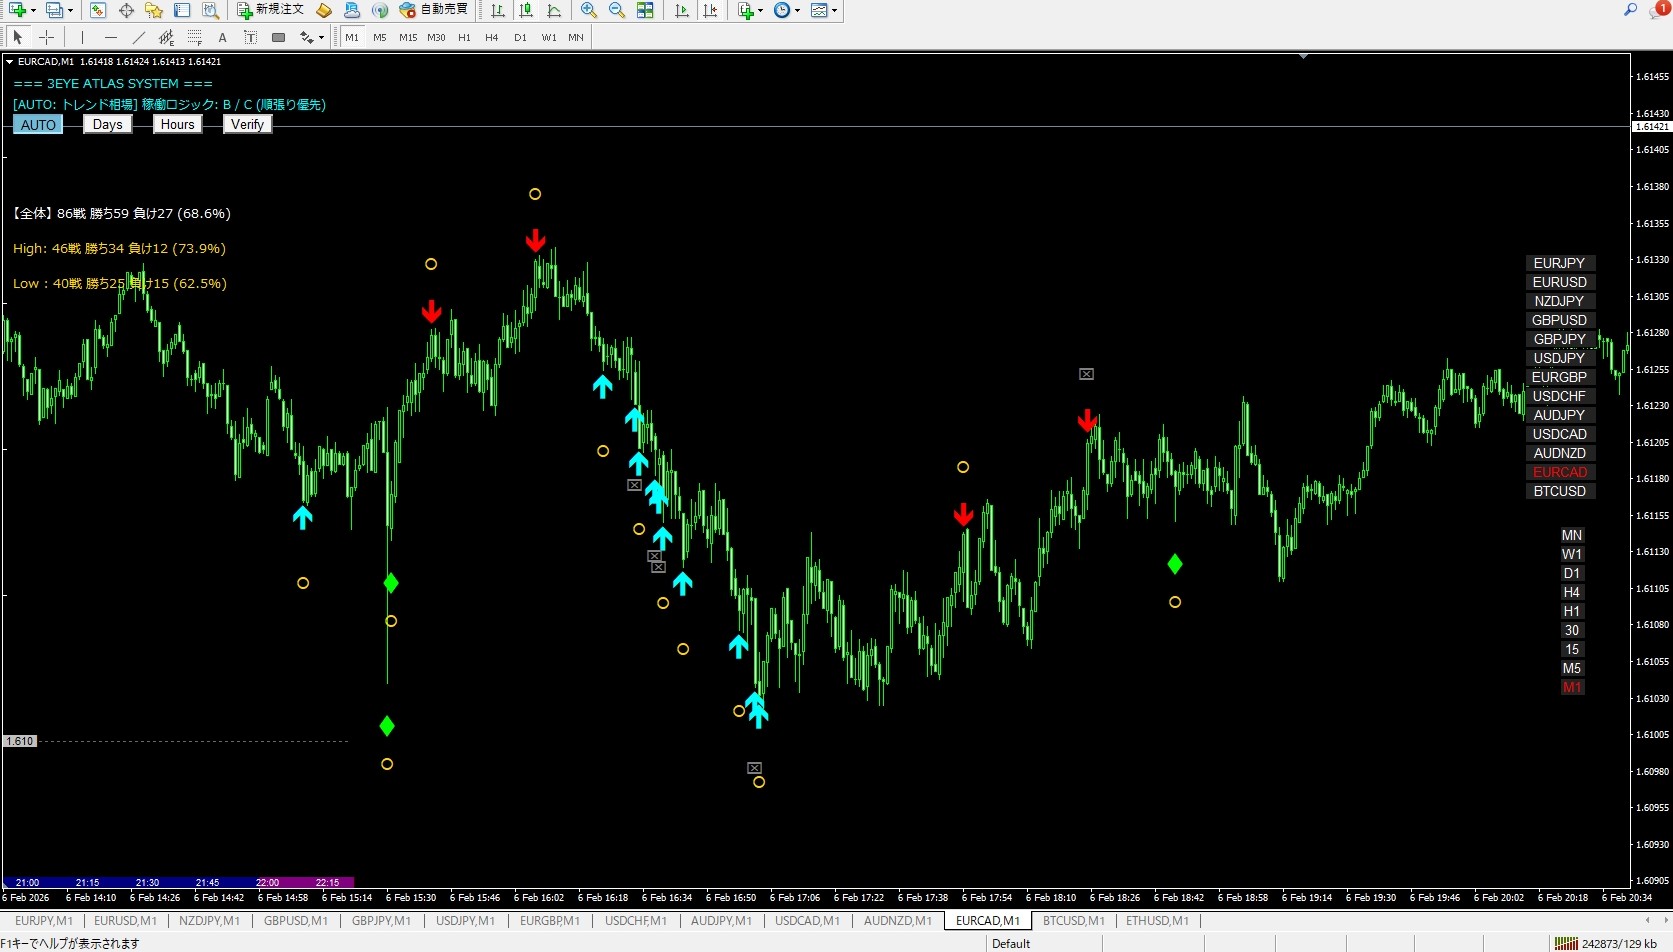
■ A zoomed-out view of EURCAD on February 6
On February 6, EURCADformed a clear downtrend in the early phase, then reconstructed with a range in between, making the day very easy to understand in terms of “structural change.”
On the 1-minute chart, movements look small, butoverall
- the trend emerges
- it breaks
- it settles
in a sequence that istextbook market flowto follow.
■ First half: a time frame where the downtrend functioned straightforwardly
In the early stage, EURCADhad shallow retracements and sustained downward pressure.
As highs were lowered while lows were updated,
- counter-trend entries were easy
- but they did not sustain
thus,an easily trapped market on the short-term chartas well.
The zone where the sense of “a rebound is overdue” becomes the most dangerous
In this phase, what matters isnot feeling but structure.
■ What the signs of 3EYE ATLAS SYSTEM were indicating
During this down phase,3EYE ATLAS SYSTEMsigns were
- at points where retracements were settled
- at points where momentum was reaffirmed
lighting up concentratedly.
This isnot just a decline
“whether it still functions as a trend or not”
as determined by internal logic.
Even on the fast-moving 1-minute chart,
if the conditions are not met, signs do not appear; this design is especially evident in this day’s market.
■ Middle phase: the end of the trend and the “time of hesitation”
After a certain down move, EURCADstopped falling, and then
- jittered up and down
- but did not extend
into a state of
This is the time when many traders
expect the “continuation from earlier”
but in realitythe nature of the market is beginning to change.
The signs of the 3EYE ATLAS SYSTEM become sparse, and even when lit, they are single occurrences,clearly reflecting this change.
■ Late phase: a market reconstructed as a range
In the latter half, EURCAD
- does not set new lows
- highs are also limited
thus,a clearly defined range structureemerges.
During this period,
“the more you cling to a trend view, the more your judgments will be skewed”
market behavior.
- reduces sign frequency
- responds only when the conditions align
whichnaturally reduces forced trades.
■ The positioning when viewed on a 5-minute chart
Even though the EURCAD on the 1-minute chart looks complex, viewed on the 5-minute chart it is
an “adjustment range after the end of the downtrend”
and is very straightforward.
With this perspective, you can understand
- why signs decreased
- why it’s better not to chase deeply
not as a feeling but as a structural understanding.
■ What February 6 EURCAD taught us
The essence shown by that day’s market is
“Trends do not last forever”
a very obvious yet often forgotten truth.
3EYE ATLAS SYSTEMis,
- a tool to distinguish the time when a trend is alive
- from the time when it is ending
and to assist with judgments in order to separate these phases,and, even in a single EURCAD day, clearly performed this role.
■ Summary
On February 6, EURCAD shifted from an “engineered profit” market to a “wait-and-see” marketin its nature.
In such markets, what matters is
- not forcing opportunities
- understanding why signs decreased
as a mindset.
3EYE ATLAS SYSTEMeven on short-term chartsserves as a reference point to avoid misreading the market’s stages, and it proved valuable especially on days like this.
— Papa Trader Yu