

The moment when the market’s nature changed after the plunge | USDCAD 1-minute analysis for February 6
── A day where the 3EYE ATLAS SYSTEM’s “selectivity” clearly shined through the sequence of急落→切り返し→レンジ移行──
Papa Trader Yu
■ In one line, USDCAD of this day
On February 6, USDCAD started with an急落 drop, followed by arebound, and ultimately moved into a market witha vague sense of direction in a ranging market.
On a 1-minute chart, price action was large,the market’s“nature changing midway”is very easy to understand for that day.
■ First half: Instability right after the drop
In the early stage, USDCAD moves sharply downward, starting from an急落局面.
In such moments, on a 1-minute chart, it can feel very flashy, and instinctively you may think:
- “It might go further down.”
- “It might rebound quickly.”
Judgments tend to diverge in this time frame.
Right after the drop, the direction seems clear,
but in reality it is the most prone to fluctuation
In this phase, more than the magnitude of price movement itself,whether you can wait for the next reactionis important.
■ Middle: Rebound occurs, but the trend is not established
After the drop, price stalls briefly and a rebound happens.
However, this rebound
- does not keep climbing to new highs
- tends to have deeper retracements
and thus the trend remains unstable.
During this time, the downtrend is not continuing,
nor has there been a clear upturn,
“a market in the process of searching for direction”
could be said.
■ How 3EYE ATLAS SYSTEM signals appear
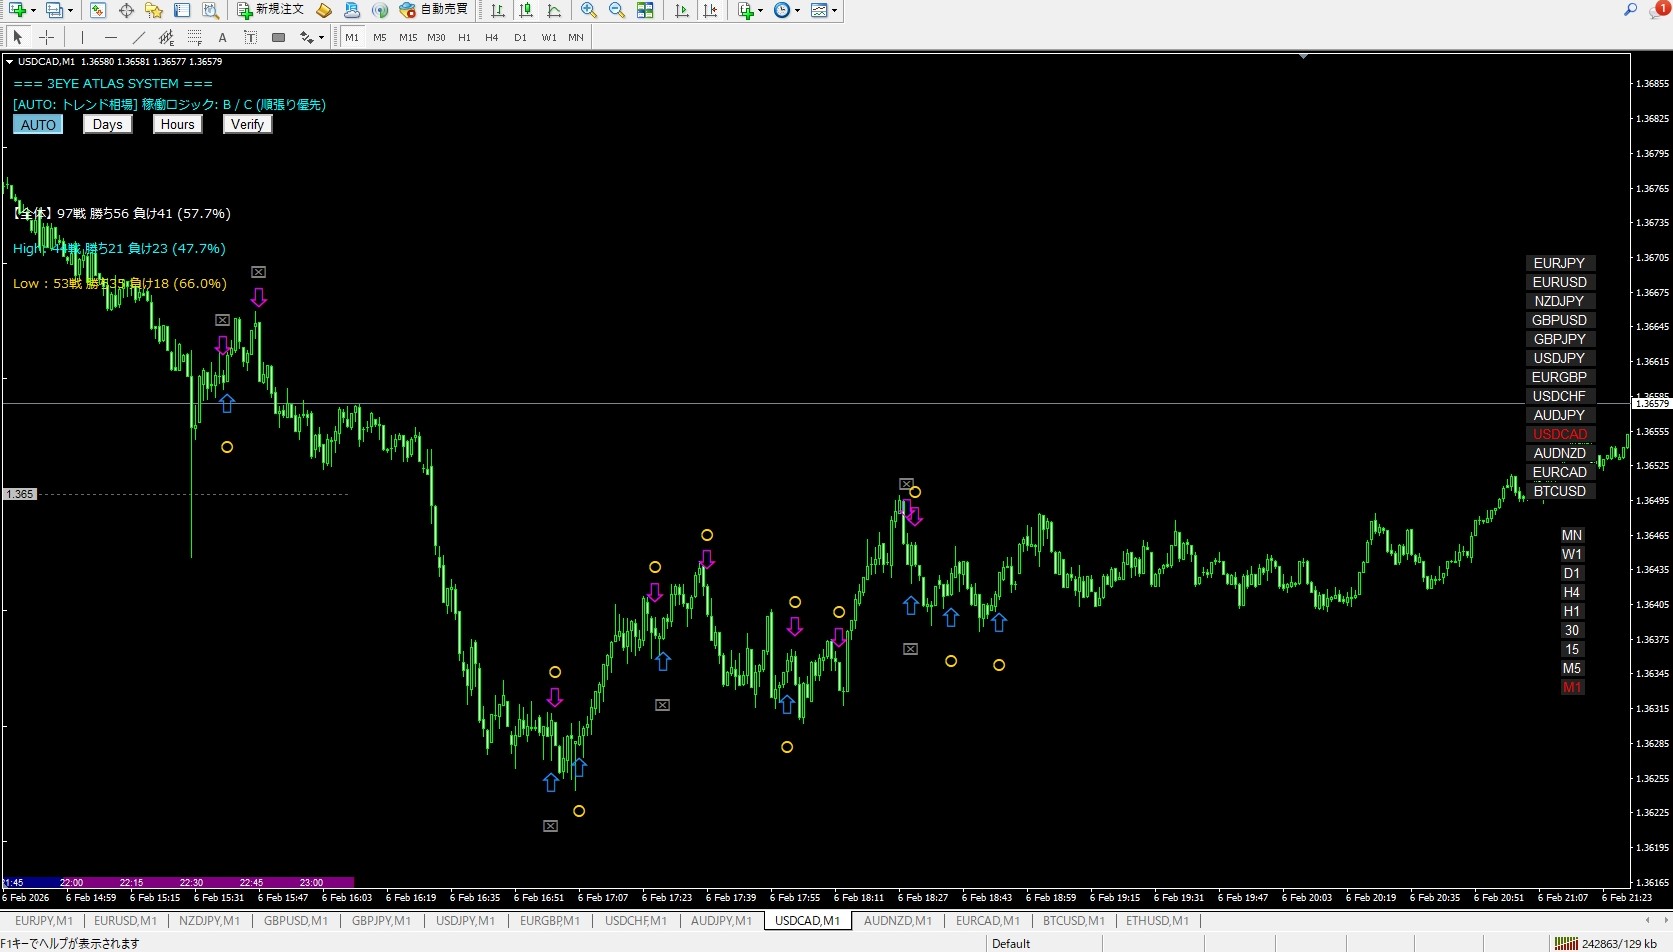
On that day,3EYE ATLAS SYSTEMsignals show that
in step with the market’s state changes,the strength of responses clearly differs.
- Right after the drop:signals are limited
- When the rebound is organized:signal lights up
- In a range with vague direction:reactions are subdued
3EYE ATLAS SYSTEM is designed to emphasize the market’s state rather than the width of price movements
, so on a day like USDCAD where the market’s nature changes in stages
the way signals appear tells you the current position in the market.
■ Later half: Direction fades, entering a range
Toward the latter half, price movement narrows gradually,shifting into a range with fluctuations.
In this zone,
- one-sided trends do not continue
- reactions tend to be short-lived
making it very hard to trade on a 1-minute chart.
Just because prices are moving,
does not necessarily mean you should always act
This time clearly showed that.
■ How it looks when overlaying higher timeframes (5-minute chart)
Even if the 1-minute chart looks erratic, viewed on a 5-minute chart,
it can be seen as “after a sharp move, energy is being rebalanced”
.
With this perspective,
- you can avoid chasing the initial move unrealistically
- you can sense the early transition into a range
benefits.
■ What USDCAD on February 6 taught
What the market showed that day was
“markets can change their character within a single day”
.
Therefore,
- don’t cling to judgments that were valid just moments ago
- don’t cling to the prior momentum
and instead,reassess the current state.
3EYE ATLAS SYSTEMis a tool that visualizes
“whether it’s time to push or time to hold back”
and helps organize that visually.
■ Summary
On February 6, USDCAD showed a market clearly divided into
three phases: drop, rebound, and range
.
On days like this,
- don’t do the same method all day long
- look at the meaning of the signals rather than their quantity
to achieve more stable results.
3EYE ATLAS SYSTEMis,
even on short timeframes, a tool that helps you stay aligned with market changes andkeeps your judgments flat by providing a stabilizing reference, and it ultimately played that role well.
— Papa Trader Yu