

February 6 EURGBP Market Commentary (1-minute chart)
February 6 EURGBP Market Commentary (1-Minute Chart)
── In a market pattern of “rising → slowing → flat,” the 3EYE ATLAS SYSTEM’s “selection” proved effective ──
Papa Trader Yuu
■ A one-word summary of EURGBP for this day
On February 6, EURGBP initially turned up from the downside in the first half, and at one pointit rose distinctly,but paused in the high price range, and subsequentlymoved into a directionless sideways range.
On the 1-minute chart, movement exists, but the characteristic is clearly evident: “this is not a market where you can reliably grab easy profits all the time”.
■ First half: Reversal from a decline (a moment of change in trend)
In the early stage it gradually leaned downward, but thenthe decline stopped,and it began to rise as if reversing.
From a one-minute perspective this can easily look like the “initial impulse of a reversal,” a moment you might want to jump on instinctively.
However, the initial move of a reversal is hard to read in terms of whether it will continue
That day, even in the midst of the reversal, there were pushbacks,and the momentum was not steady, forming an uneven pattern.
What matters here is not so much “up or down,” buthow the market responds during the ascent.
■ Middle: It did rise, but stalled in the high-price area (the ease of taking profits changes)
Near the center of the screenshot, the upward momentum eases,and it stops without fully extending in the high-price range.
While the rise itself is clear, in the high-price zone
- the pace slows
- pullbacks occur more easily
- price action tends to consolidate in the same price bands
and thus,the market’s “ease of taking profits” changes.
“Rising” does not necessarily equate to “easy to target”
This pattern is common this week, but once the movement becomes evident, the high-price area tends to present more difficult judgment calls.
■ Key point indicated by 3EYE ATLAS SYSTEM signals
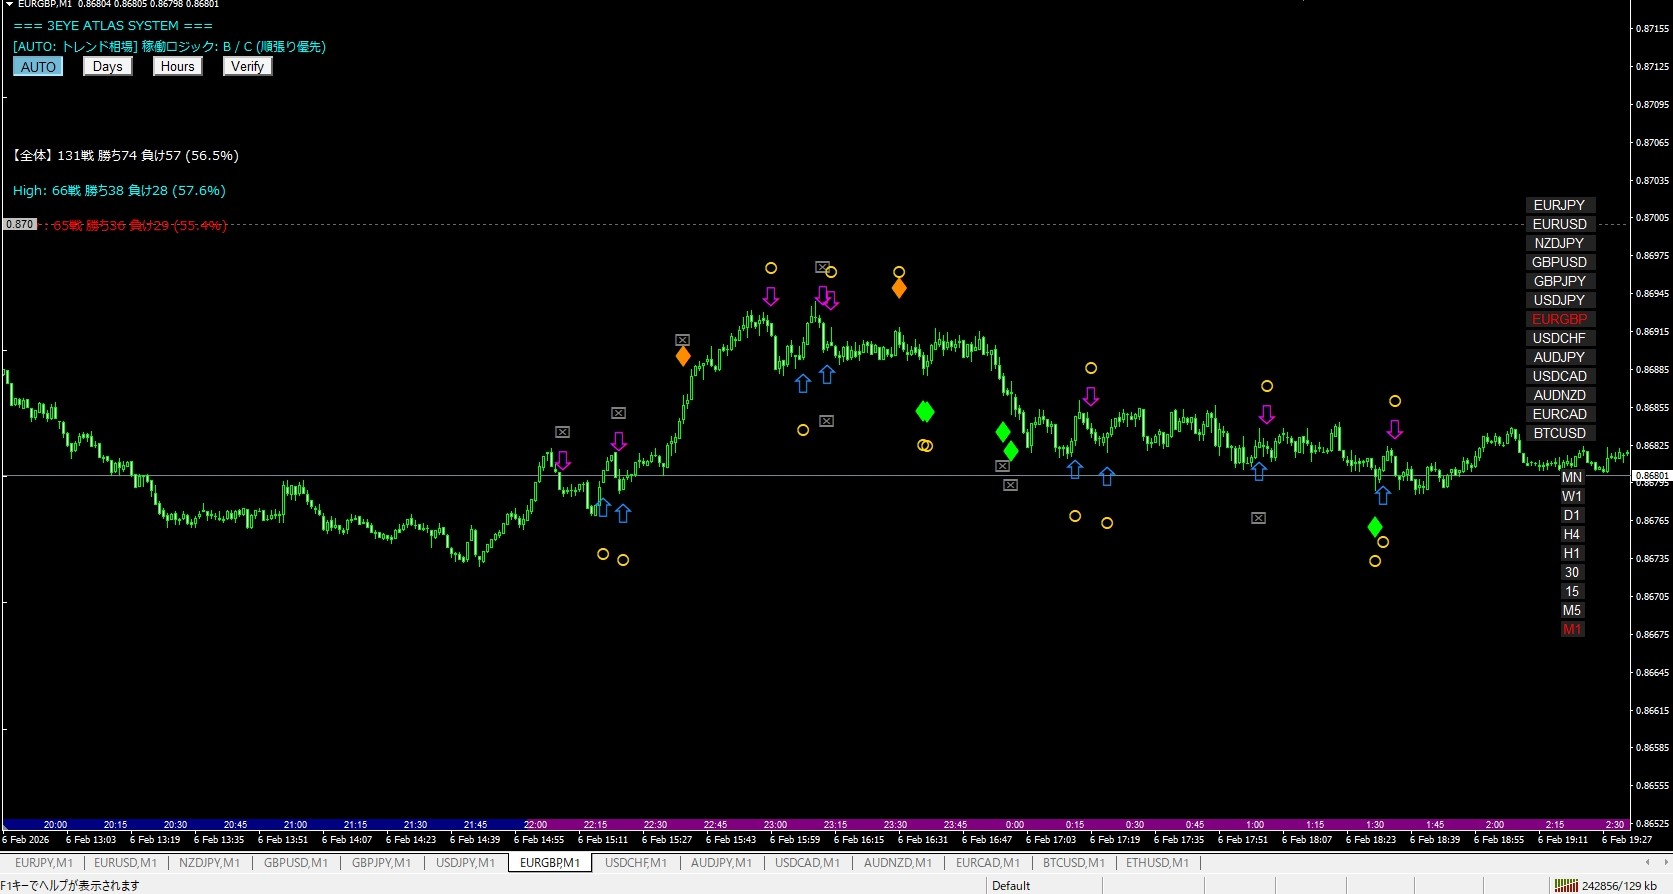
On this day,3EYE ATLAS SYSTEMsignals show that, depending on market state,the places where reactions increase and where they are subduedvary and are characteristic.
- In markets where the trend is clearly organized, signals tend to light up.
- In ranges or sideways phases, reactions tend to be more limited.
- It is easier to judge in situations where the move has already begun and the initial surge has settled, rather than right after the move starts.
3EYE ATLAS SYSTEM is designed to select not by following price movement, but by determining whether “conditions are aligned.”
Therefore, on days like EURGBP where the market moves from
rise → slowdown → sideways, the way signals appear offers a hint of the current market state.
■ Second half: In a flat market, the value of “doing nothing” rises
In the latter half, the market loses its directional sense and price ranges become fixed,with small fluctuations repeating.
In this zone, judging by the 1-minute chart alone tends to lead to more impulses to trade.
However in reality, the flatter the market, the more
- direction is hard to align
- reactions become short-lived
- judgment leans toward subjective feel
Thus,a “don’t trade” decisiondirectly contributes to stability of outcomes.
A time with few signals is not a bad time, but
a time to “select what to act on.”
With this perspective, you can reduce forced judgments.
■ Summary
On February 6, EURGBP showedrising is easy to recognize, but it isn’t always easy to target, a market state.
From the early reversal and the middle rise to the subsequentslowing and turning sideways, the market state changed in stages, making it a day of change.
Watching the reaction after moves rather than the exact moment of movement
is important.
3EYE ATLAS SYSTEMsignals are not only entry cues but also indicate that
reactions in difficult times tend to stay subdued,thereby supporting a “do nothing” decision.
With this viewpoint, you can maintain距離 with the market even on short-term charts.
— Papa Trader Yuu