Expected annual return over 70%! USDJPY scalping "Scalping Capybara"
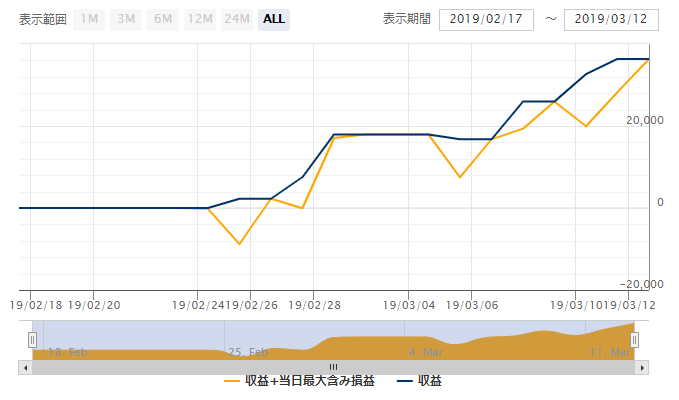
It's almost been a month since operations began.
Analyzing the promising start of 'Scalping Capybara'.
Can it reliably deliver an expected annual return of over 70%?
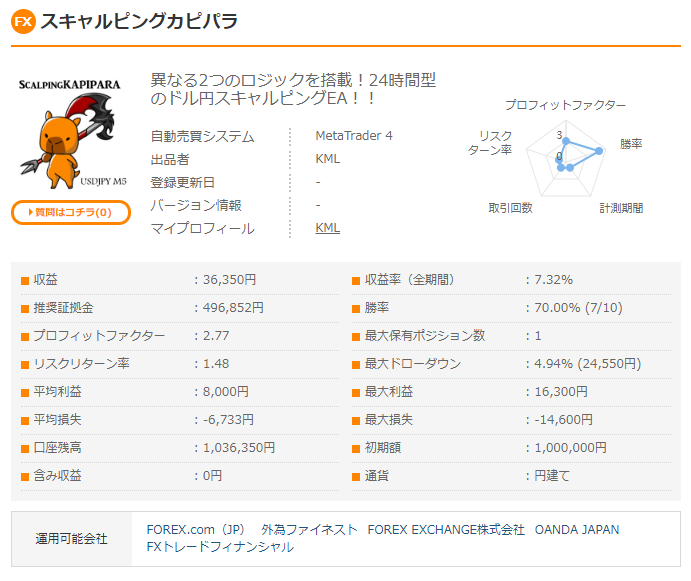
Scalping Capybara Overview
Currency pair:[USD/JPY]
Trading style:[Scalping]
Maximum number of positions:2
Timeframe used:5 minutes
Maximum stop loss:85(60 pips)
Take profit:30(20 pips)
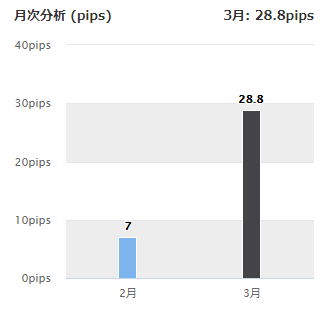
This is a USD/JPY scalping EA with two different logics. The monthly analysis for February–March covers about one month and earned35.8pipsin gains.
The forward-testing period is still short and the number of trades is small, butWin rate70%, PFis favorable.
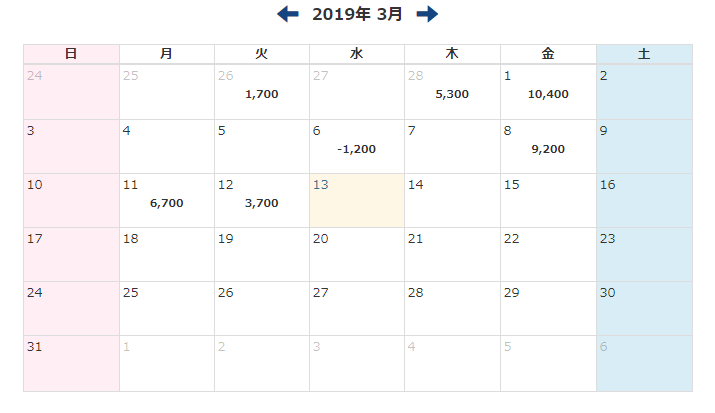
March has come with small losses and larger gains, so future performance looks promising.
【Backtest Analysis】
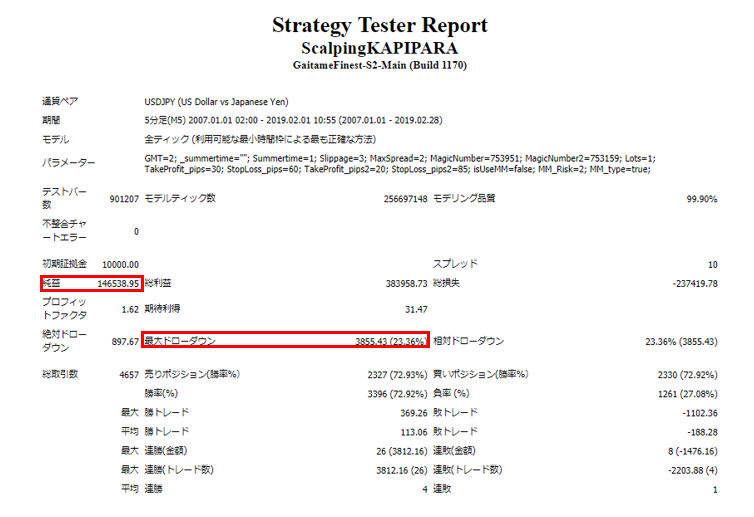
2007.01.01‐2019.2.1
Spread1.0
Fixed lot 1
Net profit +1611.9万円(annual average134.3万円)
Maximum drawdown –42.4万円
Total trades4657 times(annual average388 times)
Win rate72.92%
PF1.62
The total number of trades is very high, averaging about1.5(calculated on 250 trading days per year).
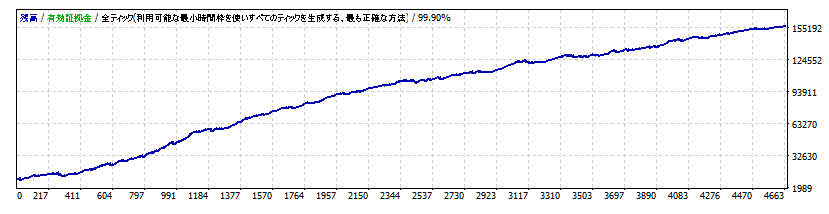
The win rate exceeds70%, showing profits on a gradually rising right-hand curve.
Over a 12-year period, the maximum drawdown is 42.4万円, with a maximum of 2
Recommended margin, as in the backtest, is fixed at 1 lot, considering the maximum drawdown. Therefore, approximately
(45*2)+(42.4*2)=174.8万円)
So approximately 175万円,0.1 lot would be about 17.5万円 as a safety operating guideline.
In this case, the expected annual return is a remarkable76.8%, so it is quite excellent!
Here are the year-by-year backtest results.
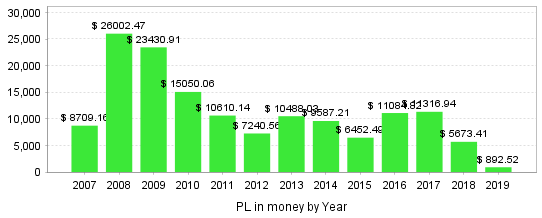
Backtests were conducted over12years, and profits were earned in every year.
The years with the highest annual gains were2008 and2009
Next is earnings by year and month.
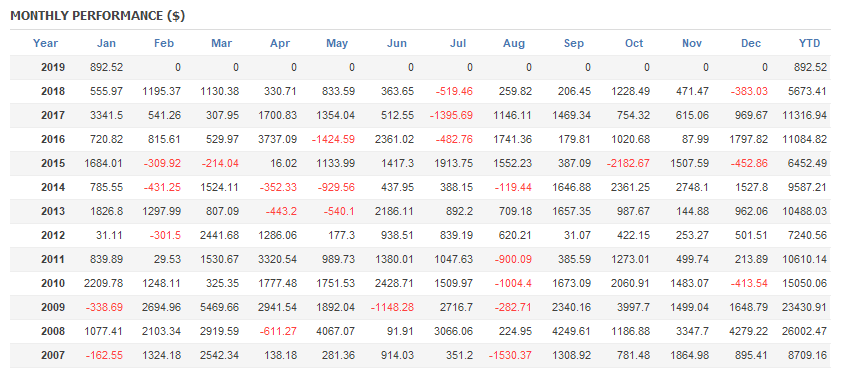
The monthly win rate is80%. It generates at least 600,000 yen in profit per year.
Judging by the results alone, this is a scalpingEA, so it seems to struggle somewhat in the summer months (May to August) when the market is less active.
Annual number of trades.
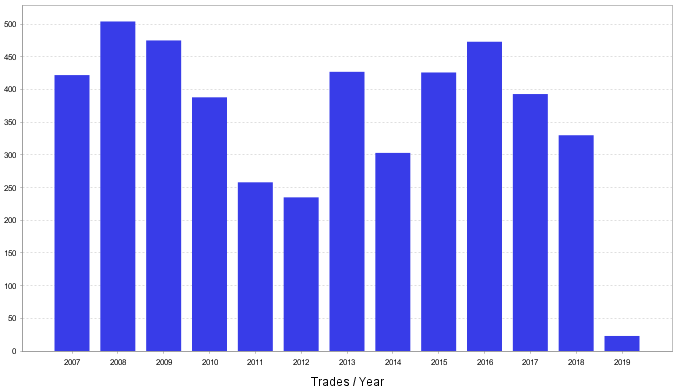
2013and later years continue to show high trading volume. When combined with the earlier annual gains, though recent years have many trades, profits aren’t as high as in 2008 and 2009.
Despite many losing trades, the overall annual profitability and low variance suggest that the balance of stop-loss settings and the EA’s logic contribute to strong results., but even in recent years profits have not fluctuated by year, making it suitable for standalone operation. If included in a portfolio, it could be placed as the main EA.
Having looked at all this, the standout remains the 70%+expected annual return.
Beyond the stability of annual earnings, and beyond metrics like win rate and PF, it looks like an excellent EA that shows its quality in live operation.
If forward performance continues to improve, it seems destined to become an unquestionably popular EA.