

#18 [Emergency Report] My hands are shaking. PF6.46... Is this the "Holy Grail" or a "bug"?
November 25, 2025: Entry
That warning has become reality!
Hello, I’m Manji Koide.
In the previous article, I predicted, “Next time I will test not only on the daily chart but also on the 4-hour and 1-hour charts, as well.”
Well, that turned out to be a lie. Sorry about that.
No, please let me explain.
While I was optimizing the parameters for the daily chart (D1), my time froze in front of the monitor.
I thought my PC had broken.
Or perhaps MT4 had a bug.
There was no time to run tests on other timeframes.
First of all, I must report this“unusual situation”to everyone.
I, who laughs at the “holy grail search” pursued by ordinary people
I always say this, right?
Nine-tenths of losing traders desperately cling to“indicators”
Moving averages crossing over?
RSI indicating overbought?
Bollinger Bands touching 2 sigma?
So what? (lol)
Such indicators that ordinary people pay attention to have nothing to do with the essence of the market.
Also, I ignore the textbook lines like “resistance line” or “break of support line” that everyone rushes to draw.
What I do is just one thing.
“Set a trap at the target and wait for the prey to be caught.”
That’s all.
If you program the definition of that “target” and polish it to the extreme, what do you think happens?
Proof over words.
Look at these backtest results.
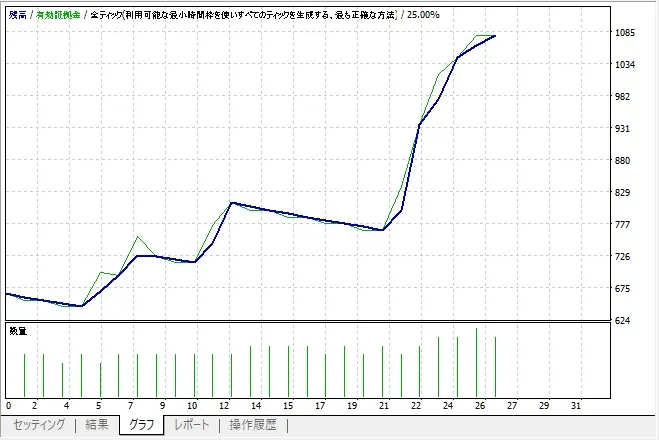
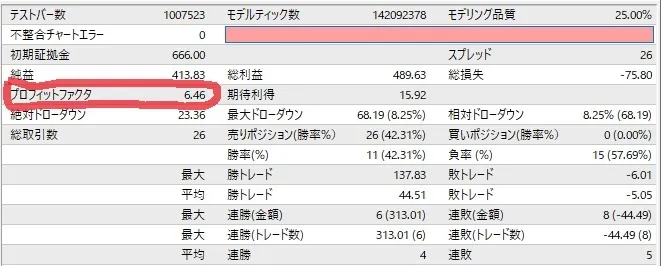
Profit Factor (PF): 6.46
Risk-Reward Ratio: 1 to 6
This is not a misreading. It’s 6.46.
From three years of testing.
If this were curve fitting (over-optimization), it wouldn’t show such a clean upward trend.
This is evidence that the logic fully captures the market’s critical points.
“15 pips” of risk to “wipe out 90 pips”
This time, the optimal ratio derived from optimization exceeded my expectations.
Initial stop-out pips: 15 pips
First take-profit before trailing: 90 pips
Do you understand the meaning of this number?
“From the moment you enter a sell, the market does not move against you; it falls straight into a 90-pip abyss.”That’s what it means.
If the entry accuracy were low, a shallow 15-pip stop-out would be wiped out in an instant.
You’d be hunted down by noise.
However, this EA does not get hunted.
Because, when I declare the “target” and it is broken, that moment is thevery first move of market collapseThat’s why.
While ordinary people cry, “Buy the dip!” or “Support it!”, we remain calm and, like snipers, skim 90 pips of profit with a 15-pip risk.
This is,the essence of the “razor shave method”.
==
Next time:
Honestly, with this level of result on the daily chart (PF 6.46), I think it’s complete as is.
There’s no need to tinker further.
But, you know…
FX traders are inherently greedy.
“Trading on the daily chart yields few entries!”
“I want to trade more actively!”
They’ll protest soon. (lol)
Understood.
To satisfy everyone’s request, in the next installment, as promised,I will also test on the “4-hour” and “1-hour” timeframes.
Can this divine logic withstand short-timeframe noise?
Let’s see EA-kun’s performance.
Well then.
※
The EA I am creating is a automation of the, as introduced in Episode 2,
“method that wins even without scalping prohibition”.
This is currently the only paid article in this series.
150 yen!Cheap!... Boss, cheap! ٩(ˊᗜˋ*)و