

[Last Week Trade Verification] GOLD Day Trading Specialization "GOLD STREAM" 2026.1.26~1.30
▼【Last Week Trade Verification】”GOLD STREAM” 2026.1.26~1.30 MAX Calculation▼
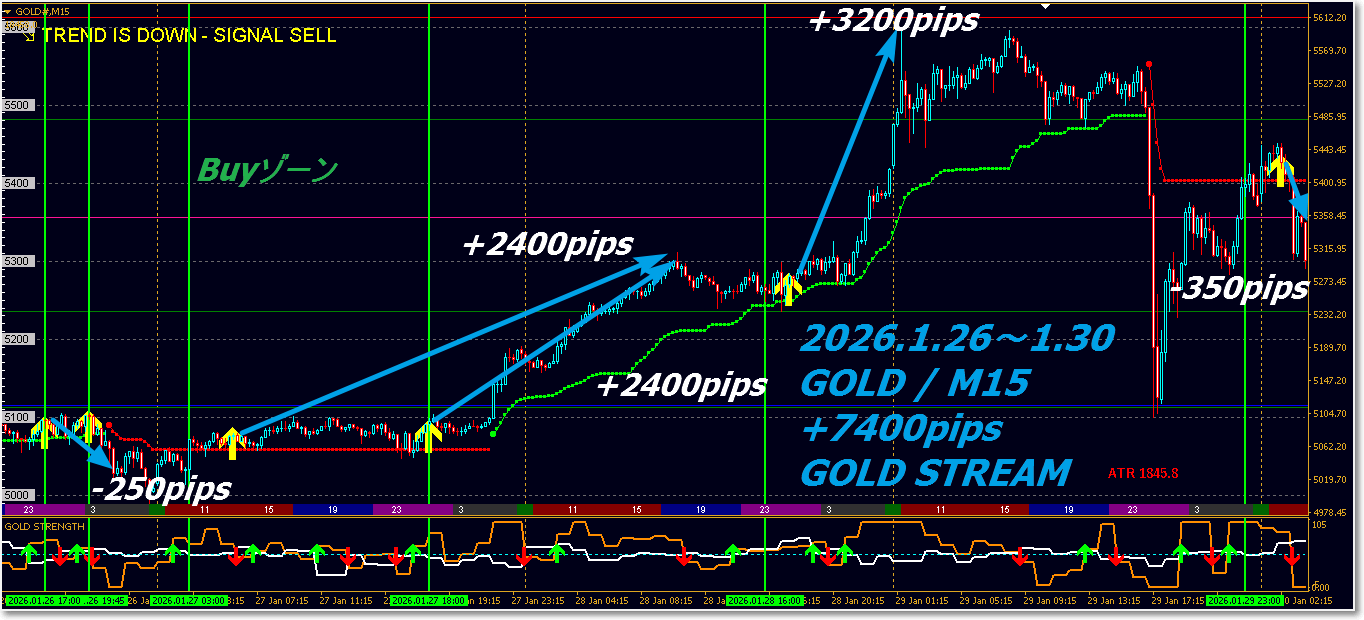
January 26, 2026 (Mon) – January 30, 2026 (Fri)
GOLD (Gold) Market Overview
Price Trend
January 26, gold price surpassedthe record high of $5,000 for the first time in historyand rose to aroundabout $5,090during the latest trading session. This level can be seen as an extension of the strong rise in 2025.
In the first half of the week, buying as a safe asset remained strong, continuing to push toward record levels.
In the second half of the week (Jan 30) there was a sharp decline at one point. In particular, during Friday’s session gold prices fell sharply, at one point down more than10%.
After the drop, prices rebounded, andtraded in a high range for the rest of the week. Looking at the daily chart, it formed a mixed candle with long wicks, indicating that the upward momentum eased for now.
Supply, Demand & Investment Factors
The price rise was driven by increased demand for a safe asset due to geopolitical tensions and policy uncertainty. U.S. policy trends and international political risks attracted gold buying.
The weekend drop was triggered by the appointment of a new Fed chair candidate and a shift away from expectations of rate hikes, leading to a stronger dollar and higher interest rate expectations.This is the likely influence.
Despite the continued allure of safe assets,profit-taking selling and short-covering mixed in the supply-demand landscape.
Investment Trends
In the first half of the week, buying via gold ETFs and futures was strong, with noticeable inflows of investment money. This increased volatility andaccelerated the formation of new positions in some cases.
The sharp drop in the second half was due to a sentiment shift from risk-off to risk-on, prompting orderly selling of positions.This shift in capital flow was a contributing factor.
Some traders mixed down-side probing with rebound-buying,leading to increased short-term trading within the range.
Overall Assessment
This week’s gold market featured both record highs and sharp declines, making it highly volatile.This characterized the week with extreme movements.
Although prices remained in a high range,increased volatility obscured a clear short-term directional bias.
Fundamentally, the drivers were “safe-asset demand + policy and exchange-rate risks,”but shifts in policy expectations amplified price swings.
Market psychology leaned bullish, butprofit-taking and risk-on sentiment sometimes capped the upside, making short-term trading cautious.
Trade Verification Evaluation
GOLD STREAM trades were designed to narrow entries significantly, based on a high-volatility environment with a 5-day ADR of about 2,290 pips, using a framework centered on strength, weakness, and correlation analysis.
Displayed +7,400 pips represents the theoretical MAX when fully hedged; the essence of the evaluation lies not in the width but inwhich situations the signals performed.
First, entry accuracy.
In unstable initial market conditions, we maintain no-entry, and signals light up only at points where the direction of strength/weakness and correlation align clearly.
As a result, among multiple trend waves within the 5-day ADR range,only the high-probability main wave with strong continuity is extracted, avoiding unnecessary counter-movements and small fluctuations.
Next, trade structure.
Multiplicative ranges like +2400pips and +3200pips are not random; they are the result of treating “continuous direction of strength or weakness” as a wave.
Compared to the 5-day ADR of 2290 pips, the perceived higher width comes from multiple correlated phases occurring consecutively, which is not a design flaw.
Next, risk management.
In this trade,the stop-loss is fixed based on the 4-hour chart, so the loss width does not drift with market conditions or emotions.
This keeps risk constant even in unexpected volatility, clarifying trade expectancy calculations.
On the other hand, take-profit is flexible via ATR-based methods and trailing exits,keeping losses limited while allowing profit to accumulate in favorable moves.
Overall assessment:
This trade is not about “big wins” but about consistently following a rule:
-
Not being swayed by volatility
-
Avoiding any action until the trend initial movement and the strength/correlation align
This rule is consistently upheld.
MAX width is a reference; in real operation, even with ATR-based position sizing and trailing, there is a clearly reproducible edge.This edge is sufficiently reliable.
In sum, this trade is not a “big winner” example, but a solid case where numbers accumulated as a result of entering only where warranted under high-volatility conditions, with high professional quality.
■ SILVER Market Overview
Silver prices moved similarly to gold, staying at high levels, but during Friday’s sharp drop, downside pressure was even stronger than for gold,and price volatility expanded. While safe-asset demand and speculative buying continued to support silver, policy risks and rate hike expectations weighed on it, leading toincreased intra-range fluctuations in the short term.
▼【Last Week’s Verification】”GOLD STREAM” 2026.1.26~1.30 MAX Calculation▼

GOLD / M15 Day Trading Focus
What is GOLD STREAM?
Main Features of GOLD STREAM
1. Designed for GOLD (XAUUSD) Only
GOLD STREAM is optimized for GOLD’s volatility characteristics and correlation structure
Short-Term Day Trading Only System.
Emphasizes rapid responsiveness and consistency that are hard to achieve with generic tools.
2. Two-Stage Notification: Ready → Signal
-
Ready (Preparation) Notification
Notifies when conditions are starting to align -
Signal (Confirmation) Notification
Notifies when entry decision criteria are satisfied
This prevents missed signals and hasty mistakes, allowing calm execution after preparation.
3. Integrated Sub-Window Display of “Strength, Correlation”
Essential for GOLD trading
-
Relative Strength
-
Correlation Direction
-
Signal Strength
Displayed in a sub-window without repainting, enabling instant verification.
No need to open other charts or apps.
4. Pivot Line Auto-Display
Pivot lines help clarify price targets.
-
Day trading: Based on Daily Pivot
-
Targeting price range: Based on Weekly Pivot
Based on GOLD’s typical price moves, you can visually grasp realistic take-profit levels.
5. ATR-Based Automatic Exit Logic (Take-Profit/Trail EA)
Free included trailing EA automatically sets optimal TP based on ATR (Average True Range).
-
Basic risk-reward target 1 : 2 or better
-
In markets with little upside, trailing keeps unrealized gains
Significantly reduces decision fatigue from discretionary exits.
6. Also Supports Entries from Smartphone
Entry: possible from smartphone
-
Exit: Trailing EA automatically handles TP / SL / trailing
After entry, let take-profit and stop-loss decisions be handled, enabling a calm, routine trading style.
7. Design to Support Skill Acquisition in Trading
GOLD STREAM aims not only for short-term results but also for
-
Identifying advantageous market conditions
-
Maintaining appropriate risk-reward discipline
-
Avoiding unnecessary entries
to establish essential trading skills for ongoing success. This is the design goal.