

The massive crash of gold and silver was inevitable — the monthly RSI was indicating an “anomaly.”
Gold and silver.
On a monthly chart, RSI was above 90, which honestly is a level I have never seen in my trading life before.
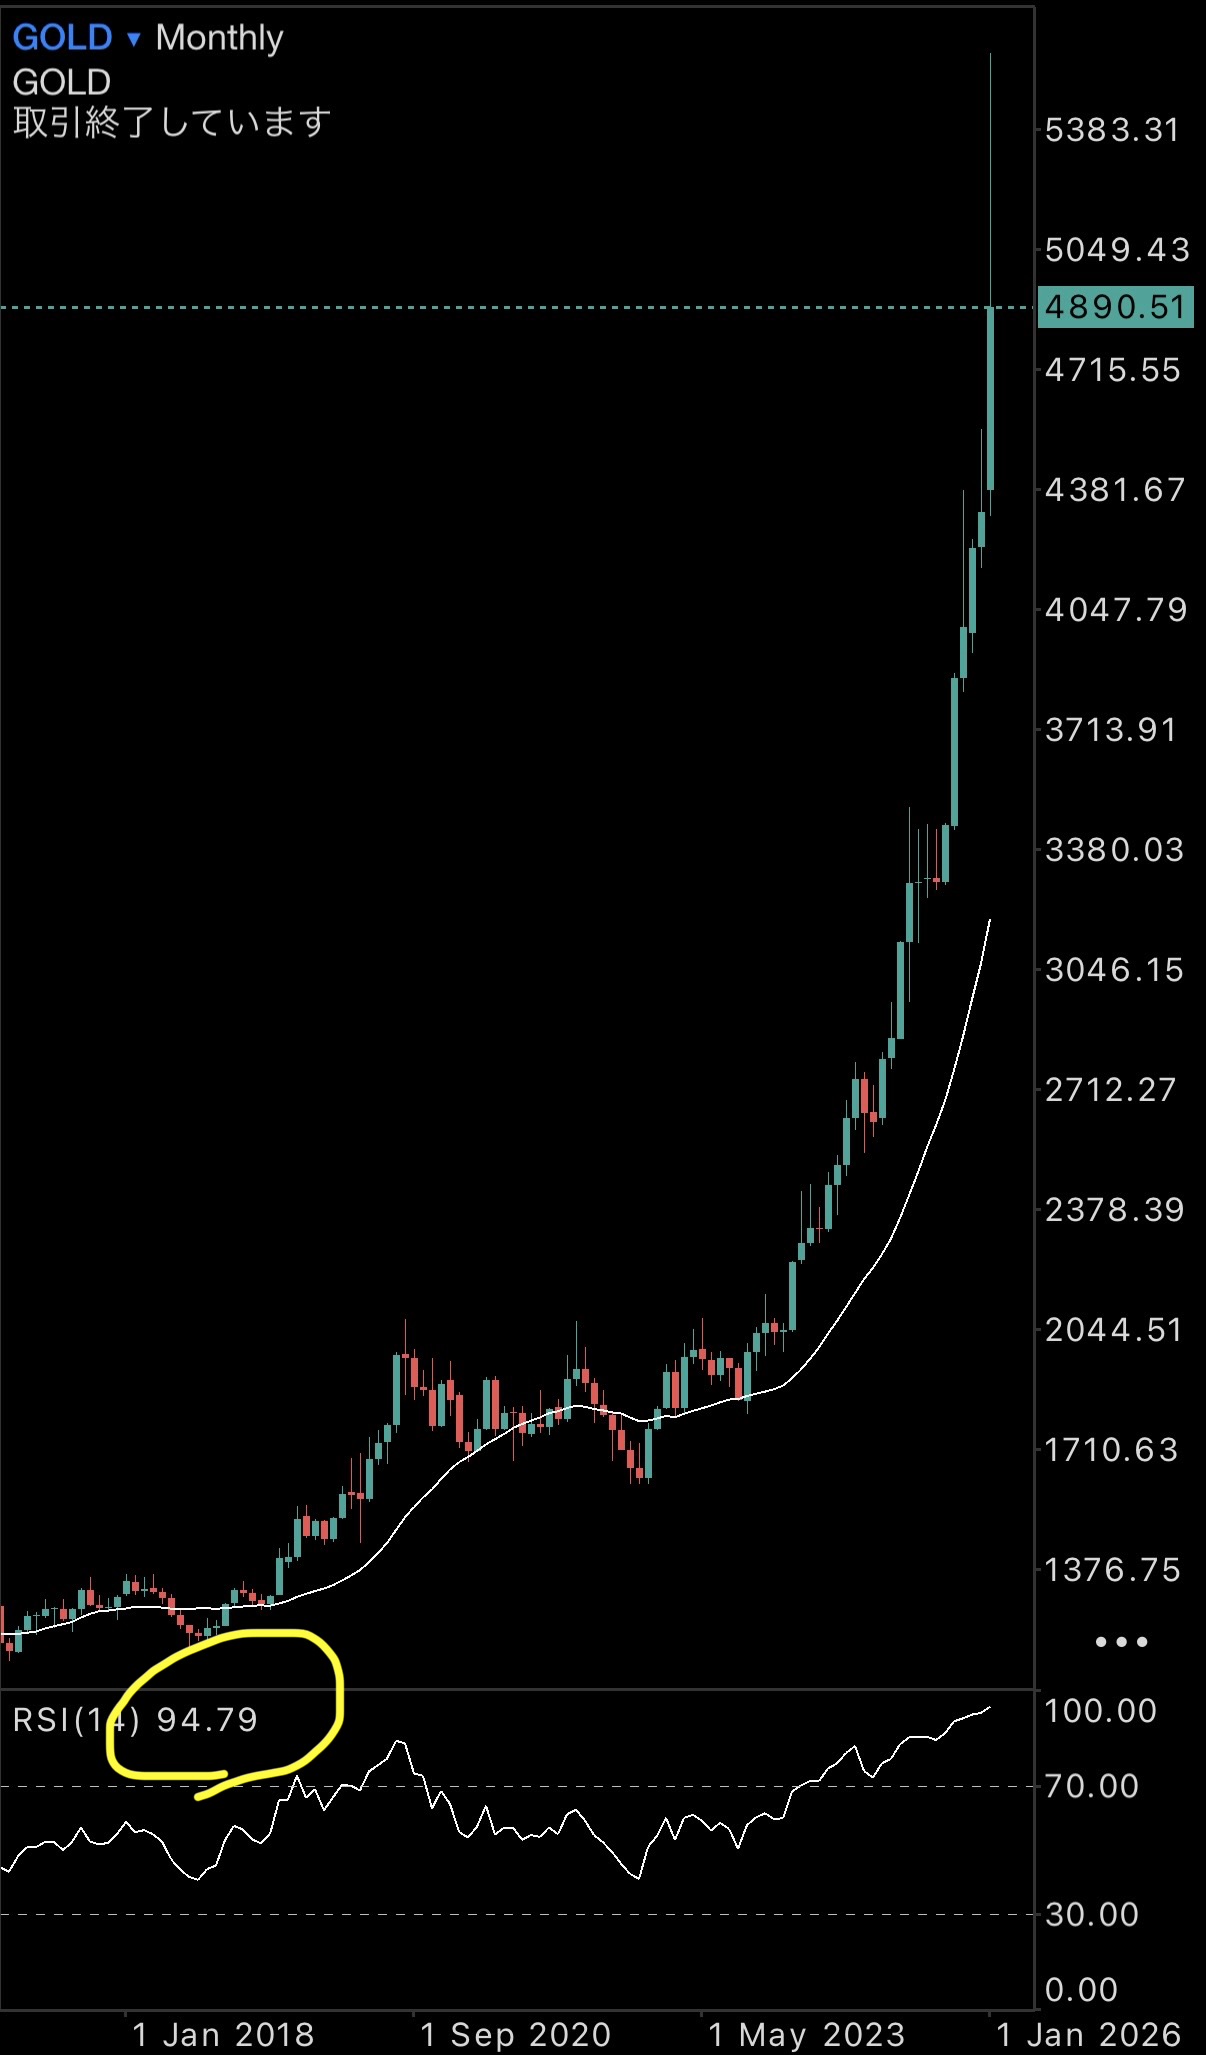
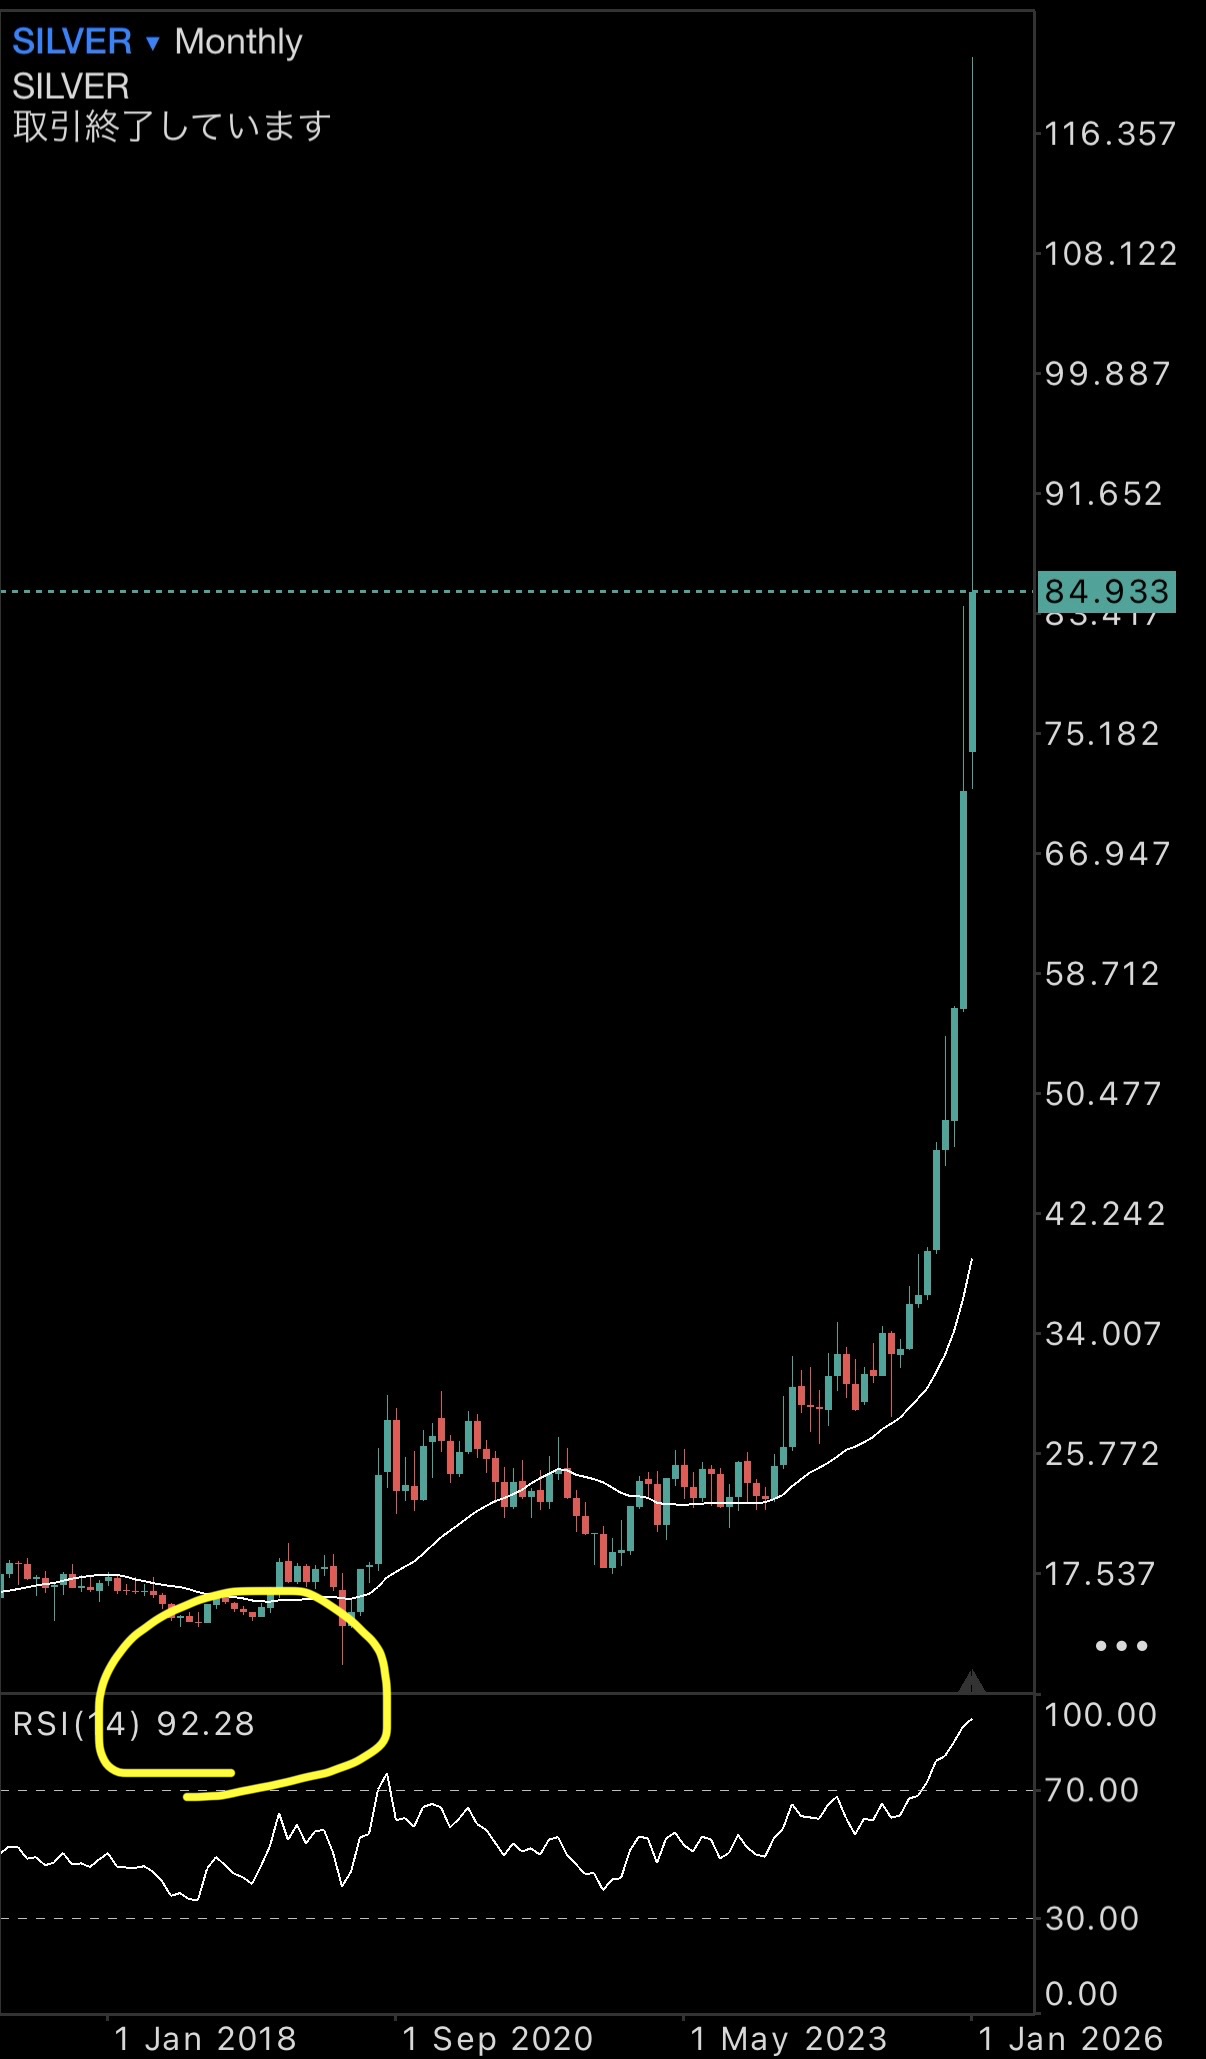
RSI is the representative oscillator that measures “overbought/oversold,” but
to exceed 90 on a monthly chart is not a short-term overheating.
It means a condition where funds have been biased in one direction for months to years.
Of course,
- Fundamentals are strong
- Inflation concerns
- Demand for safe assets
These plausible reasons can always be post-hoc explained.
But the one fact the chart shown was:
There were hardly any new buyers left entering the market
in that situation.
As expected, what followed was not a “slight pullback,” but a massive correction.
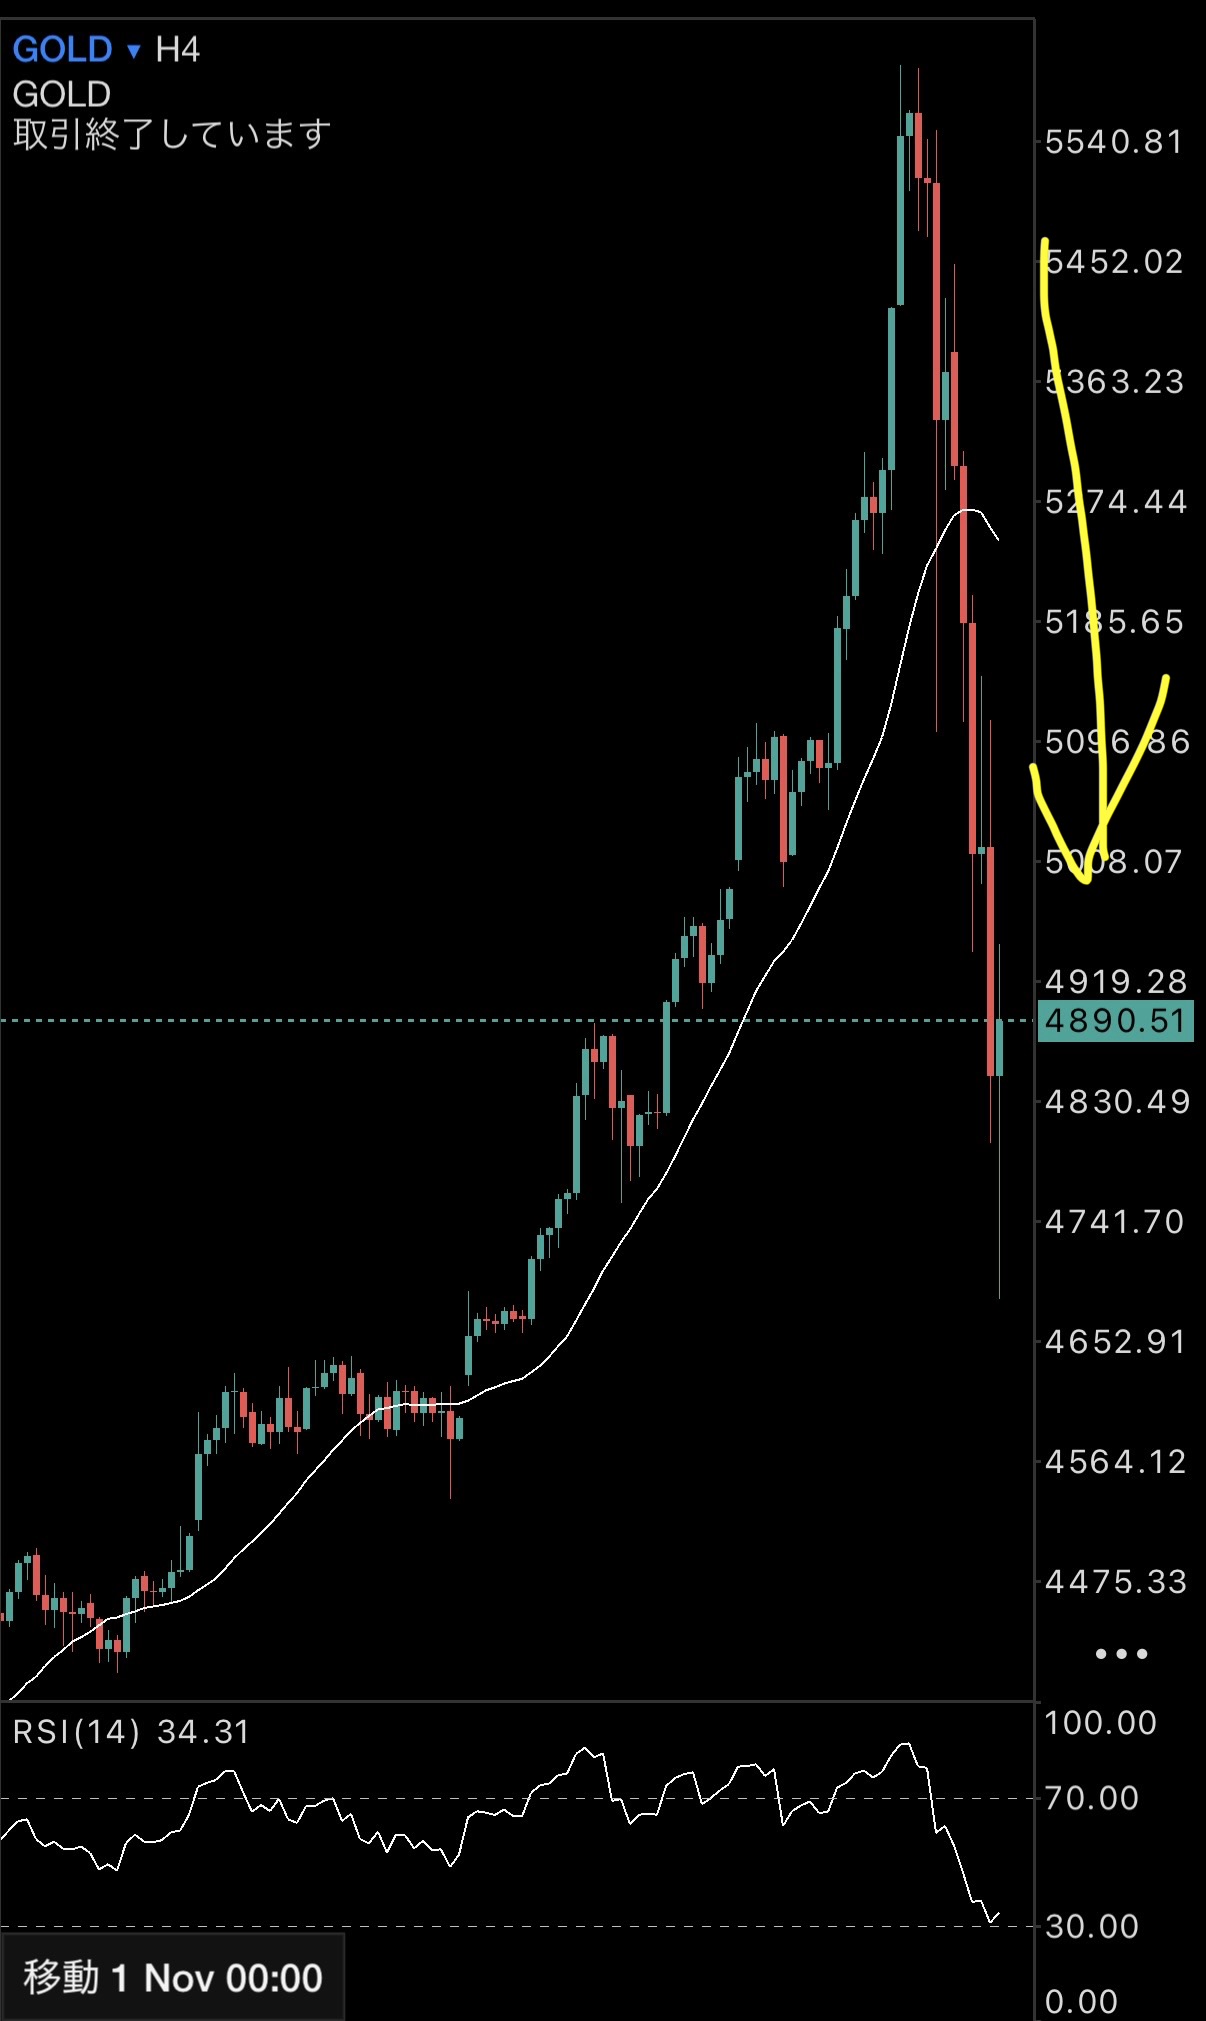
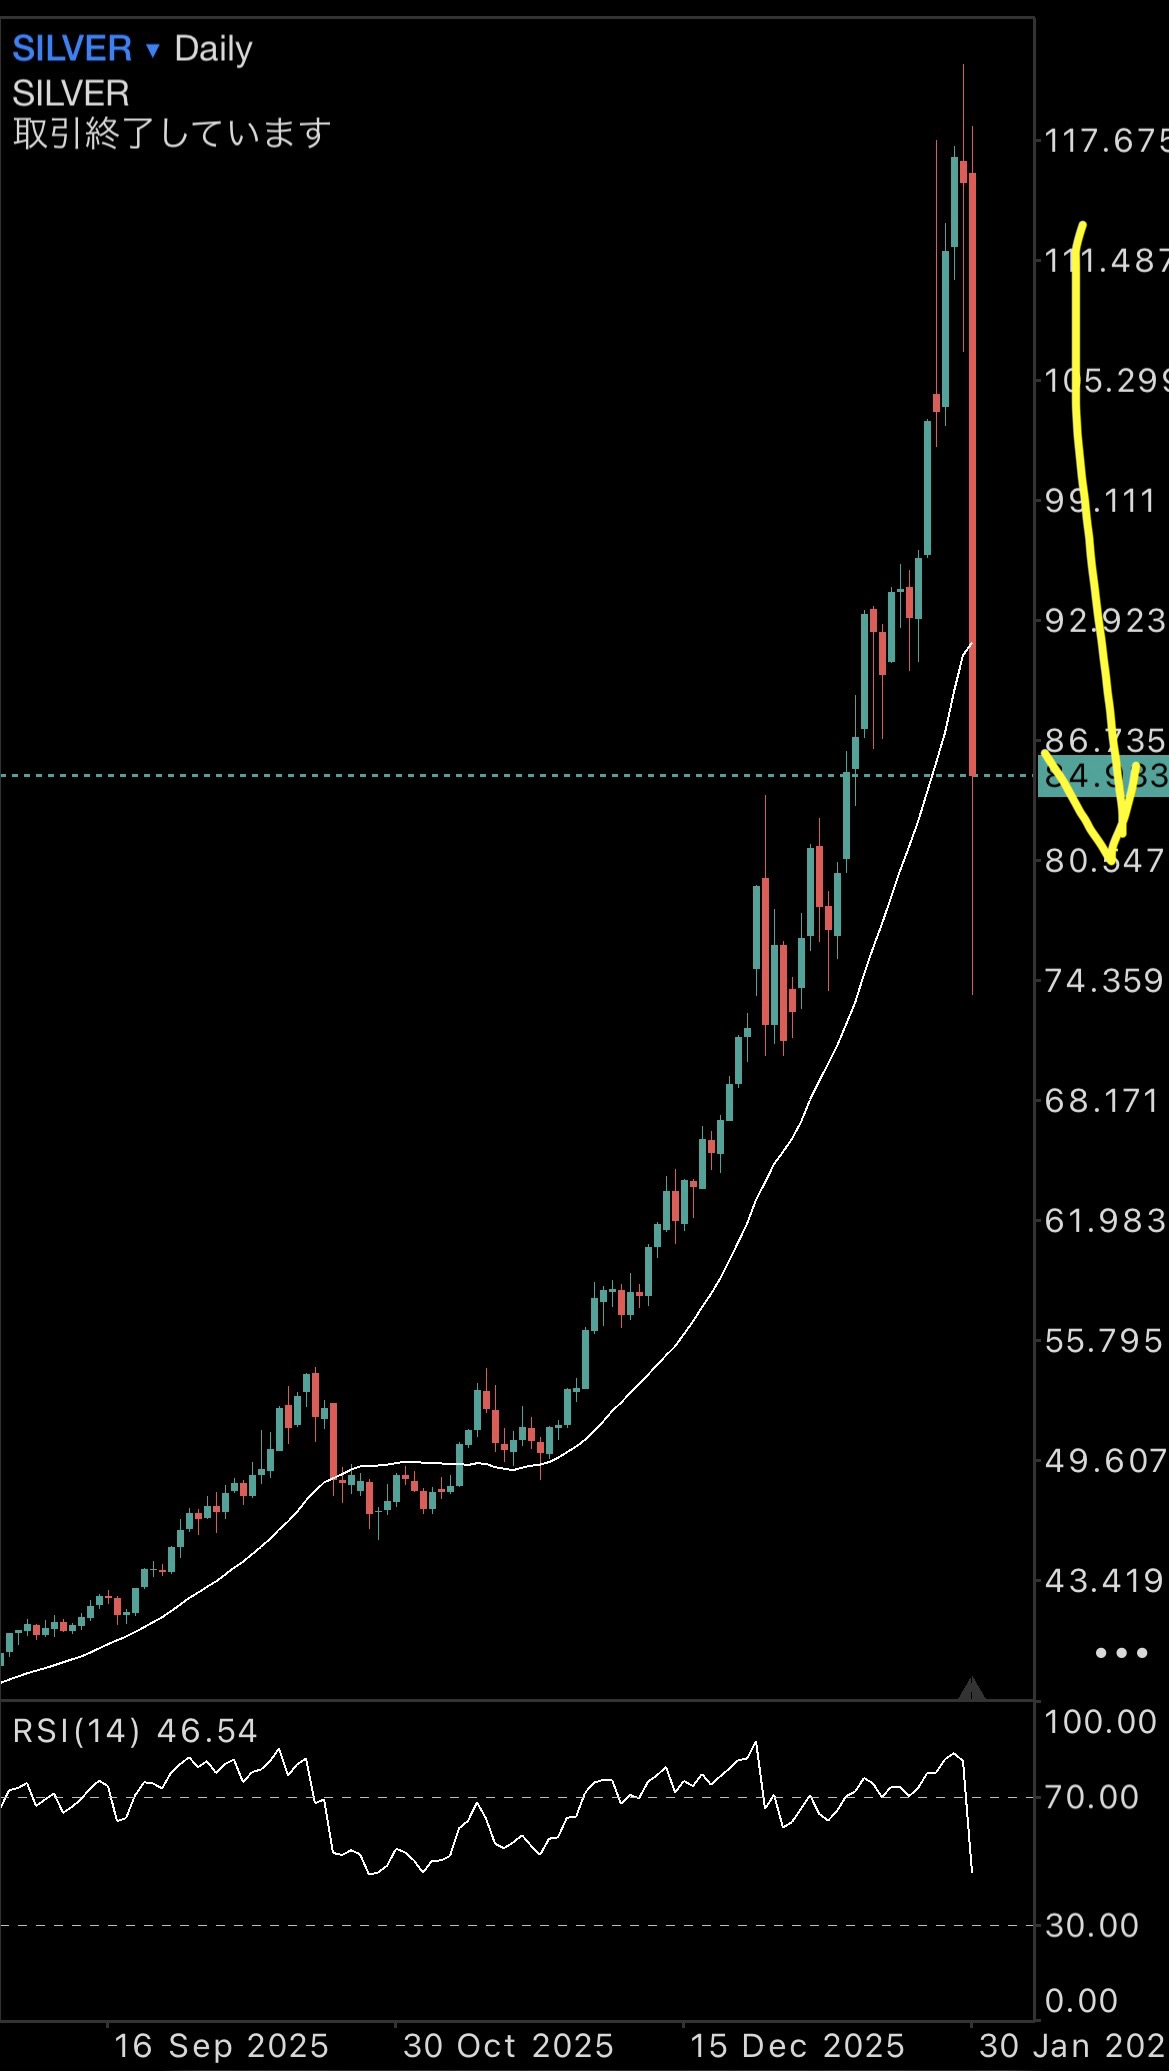
What is important here is
✔ Not that it fell
but
✔ that the decline was“something that had been known beforehand.”
Technical analysis is not a magic wand that predicts the future.
However
it is an honest indicator that tells you how abnormal the current state is.
For people who thought prices would keep rising,
it was quite a good lesson, wasn’t it?
What is truly dangerous in the market is
- falling
instead of
- believing that it won’t fall
Whether you can understand this difference will determine whether you survive the next market cycle.