

New product "My Diary" Would you like to enjoy FX together with me?
To the mysterious world of Parabolic: “My Diary” Will you join me in a fun FX journey? It’s very simple—repaint not!
https://www.gogojungle.co.jp/tools/indicators/74719
<About the System>
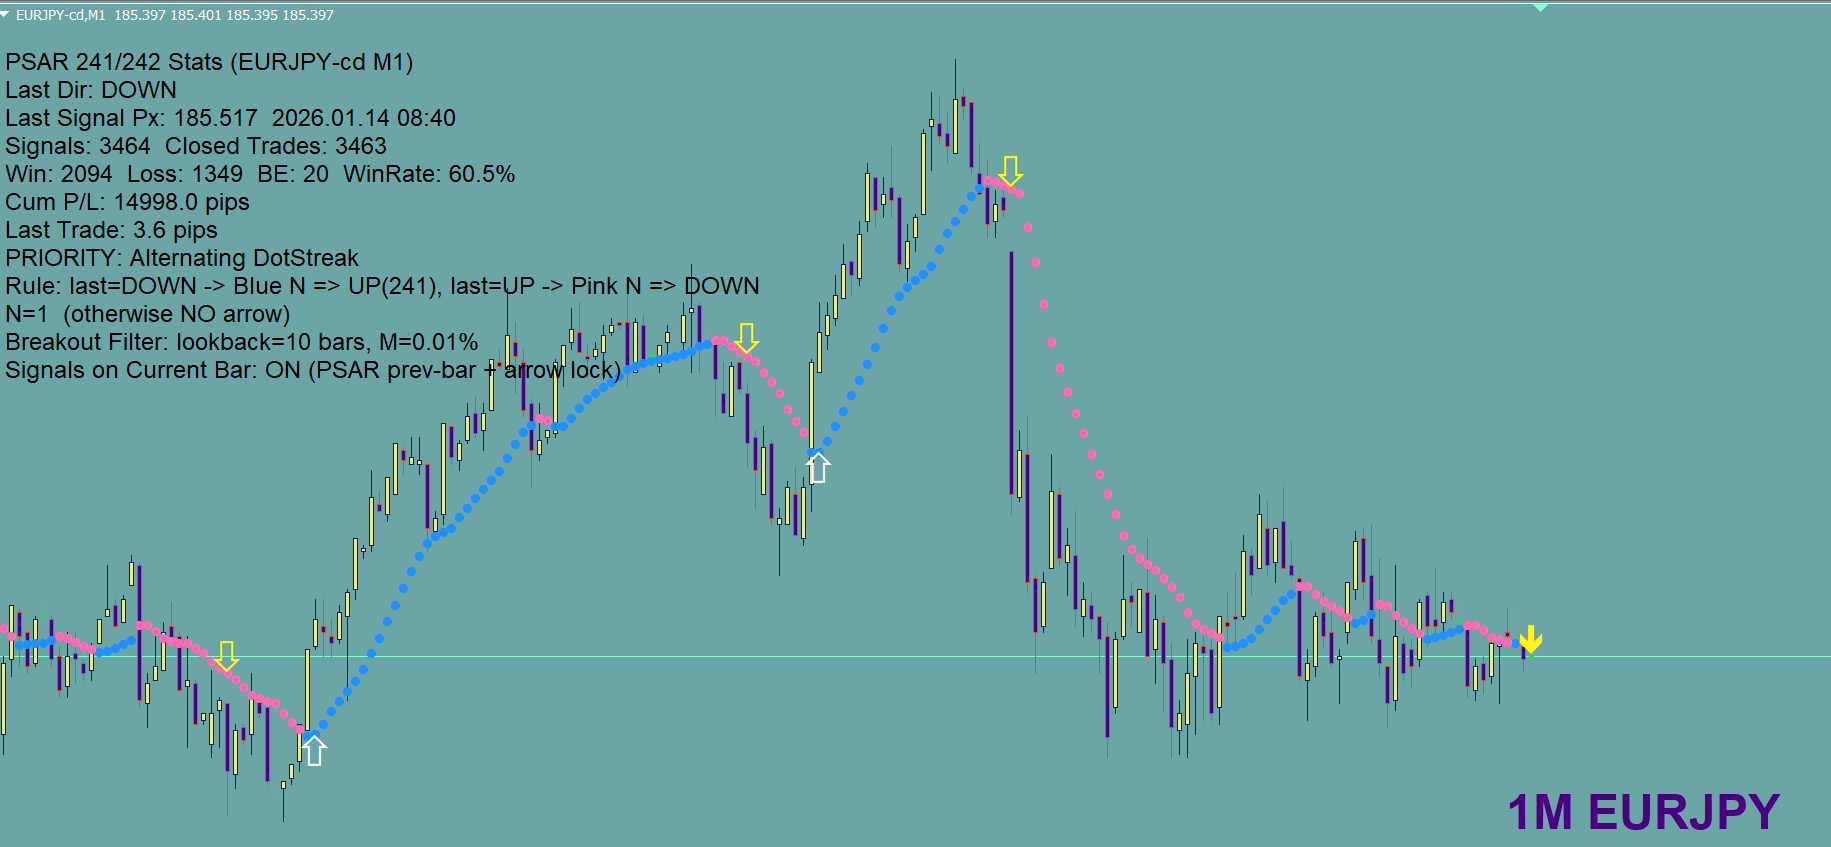
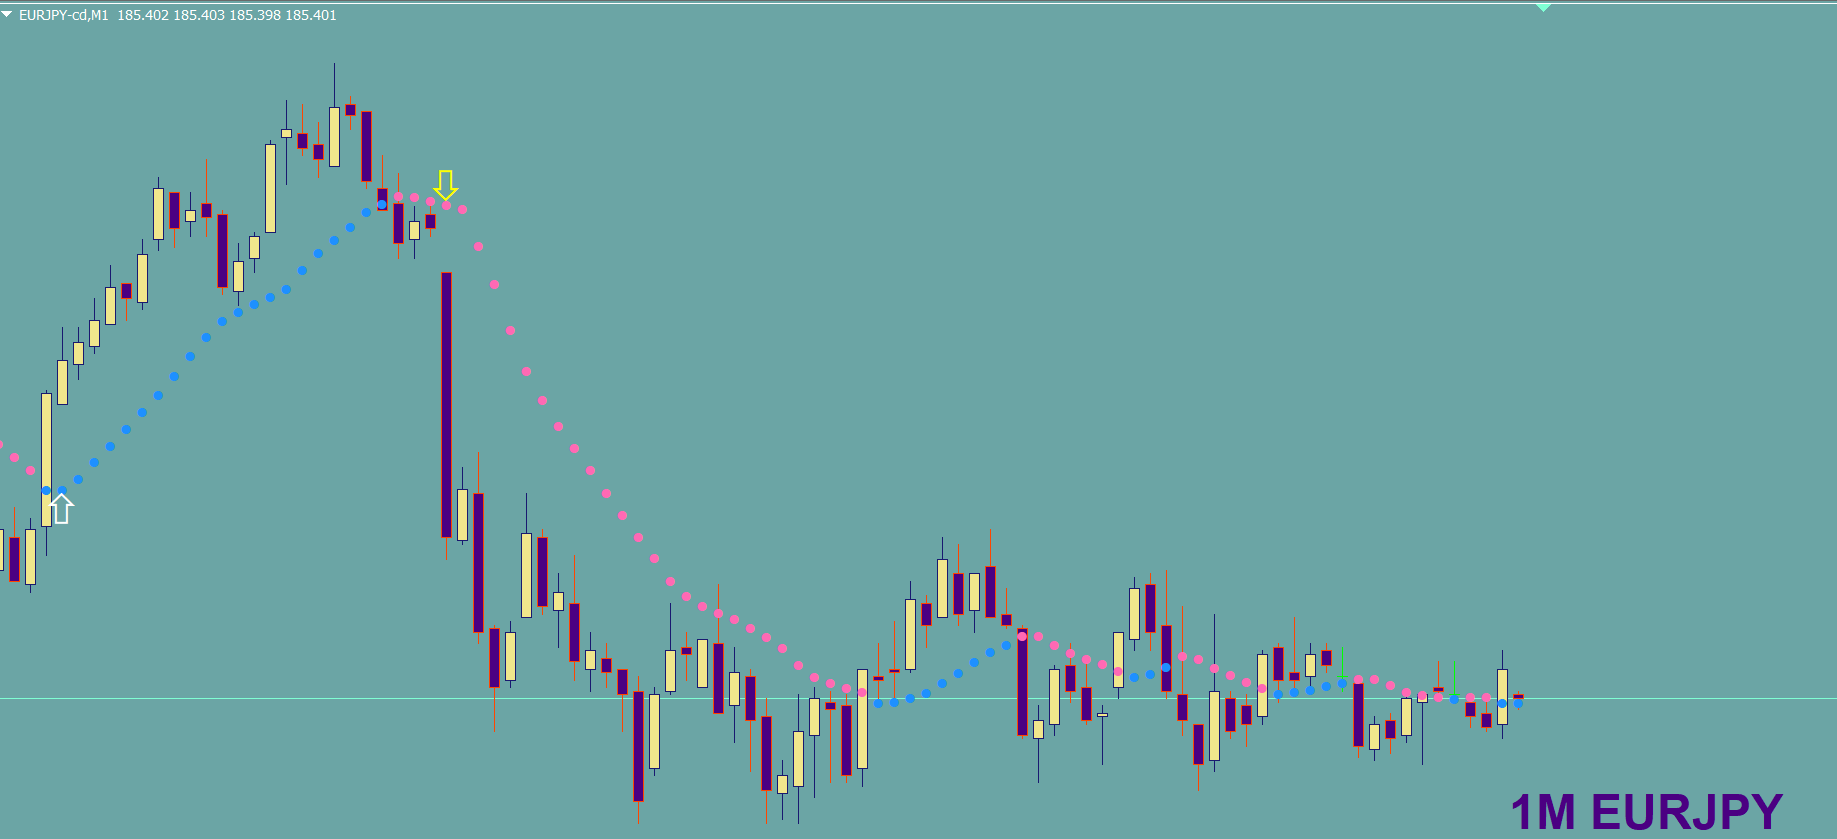
Once an arrow appears, it does not disappear or move. It stays the same even after a restart. It detects trend changes and generates buy/sell arrows early. It is stable on any time frame. The arrow signs are displayed on the currently moving bar, and alerts and notifications are also issued.
When a trend reverses, a large arrow appears, but near the current bar you will see a small arrow indicating the latest situation. However, if the chart moves in the opposite direction from the last trend arrow, the arrows will no longer be displayed, making it easier to make exit decisions.
On the top left of the screen, many information panels such as win/loss are displayed, so please refer to them. Note: the display of this panel can be hidden in the parameter screen.For details, please check the images. Profit and loss are calculated on a trade-price basis after deducting the spread.
Also, win rate and other figures are based on historical information, so they do not necessarily match exactly, but use them as reference information for which time frame tends to be more profitable.