

Utilization of "Visualization Indicators" (No. 236)
“Visualization Indicator” utilization(its236)
1. “28 Currency Pair List Indicator” to further evolve into an indicator
“8CP Visualization Indicator” for USDCHF rendering
“8CP Visualization Indicator” includes Oceania version, London version, NewYork version, AnyCP version. This time, we used the NewYork version.
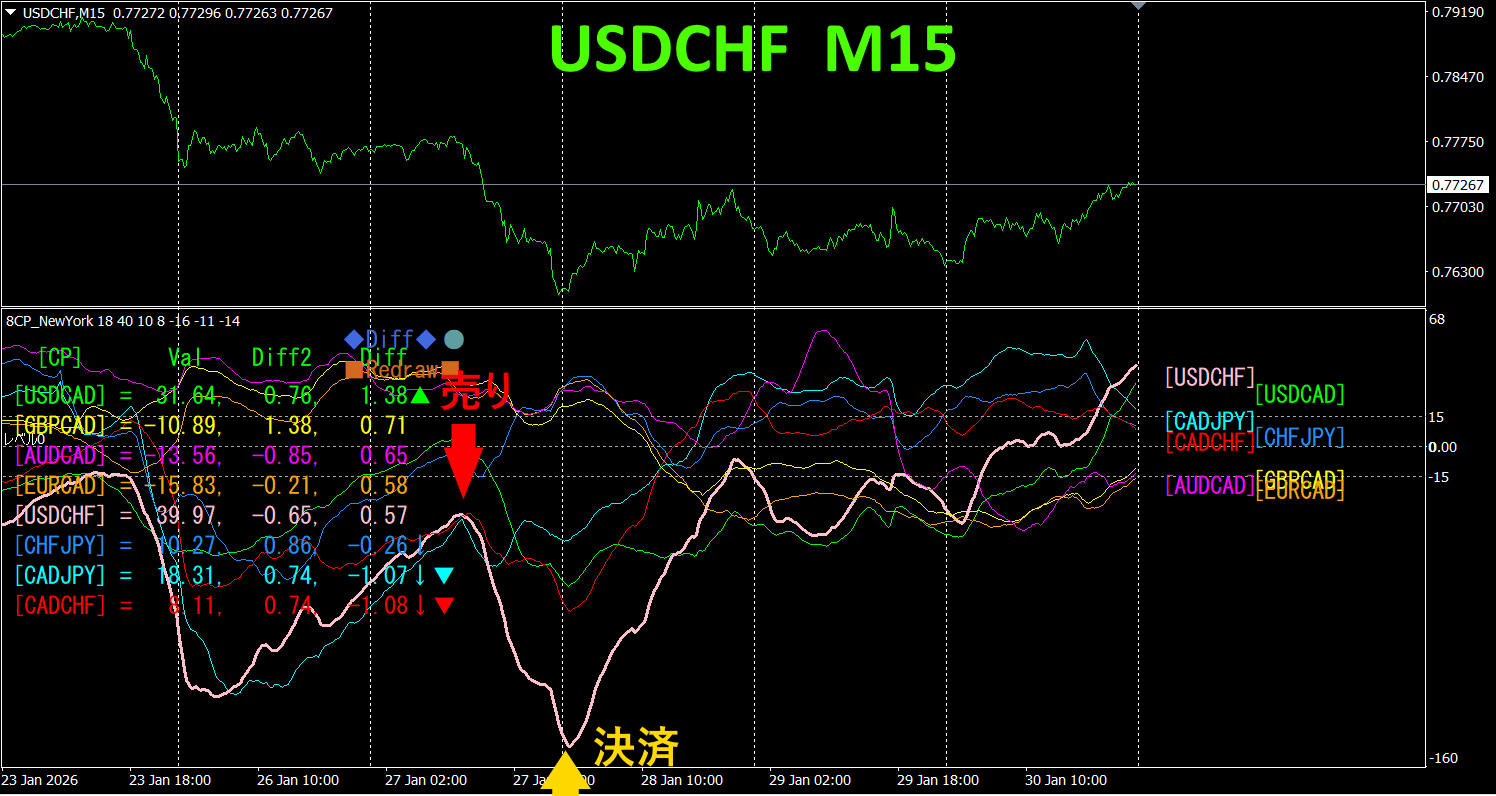
The upper half is a 15-minute USDCHF chart. The lower half is from the “8CP Visualization Indicator”, where pink colored graphs correspond to USDCHF
On Tuesday, it moved into negative territory from other groups, so we sell. We close at the bottom, and the profit was about 150 pips.
Currency Strength/Weakness Graph
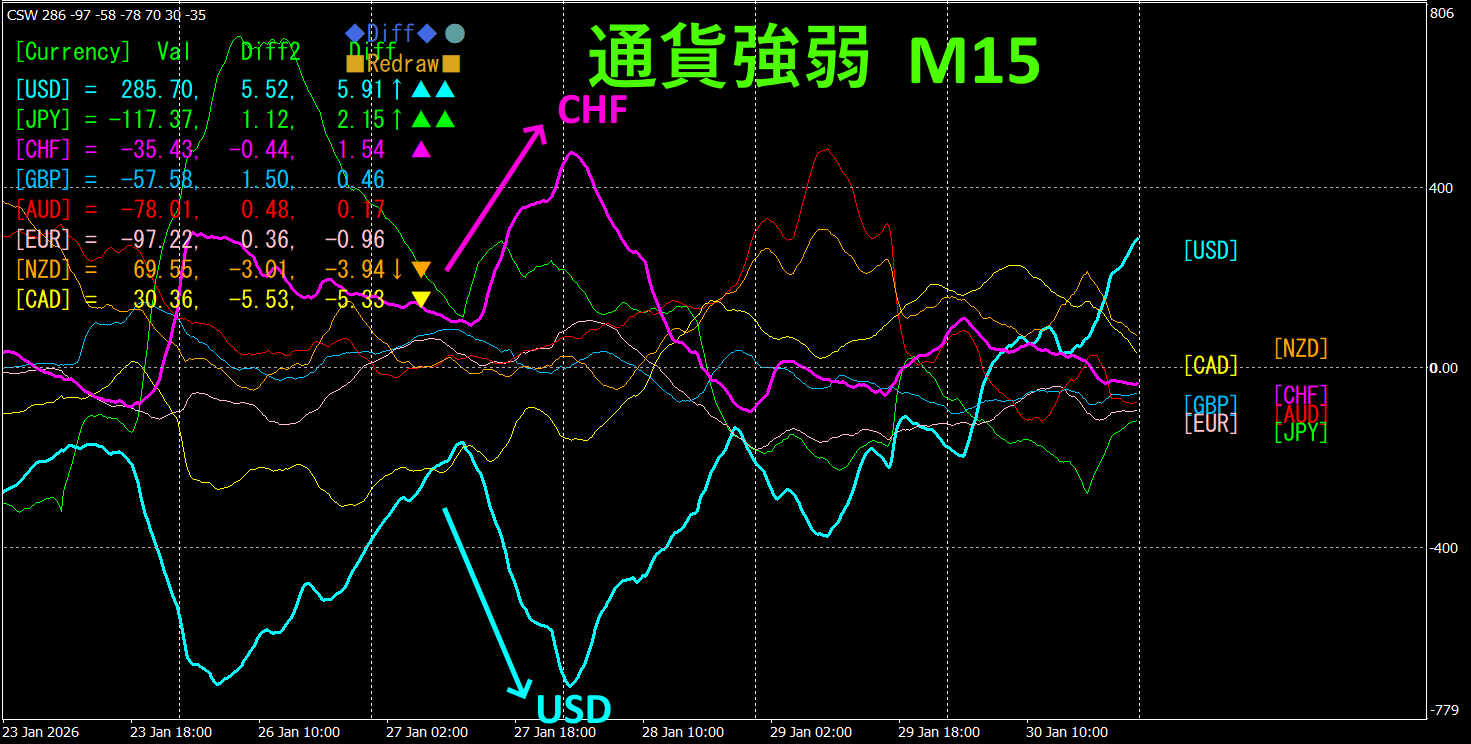
Looking at the 15-minute currency strength graph, CHF is strong, USD is weak, and on the currency strength graph CHF and USD show a clear inverse relationship.
The CHF–USD relationship is CHF>USD, and by focusing only on the parts where CHF and USD diverge and widen, you can trade USDCHF by selling. Since the chart shows a neat inverse relationship, keep the position while the vectors diverge.
In FX, pick the currency pair that is currently performing best against the inverse correlation and trade it, results will follow.
“Aim for currency strength inverse correlation!” is a core rule in FX.
Using “TrendLine-EX” allows entering and exiting automatically when diagonally breaking trend lines. Since you can leave it as is, trading becomes easy. “TrendLine-EX” can automatically short on a trend-line break and automatically close on an up break, functioning as a semi-automatic EA.
2. Try Best Select Indicator
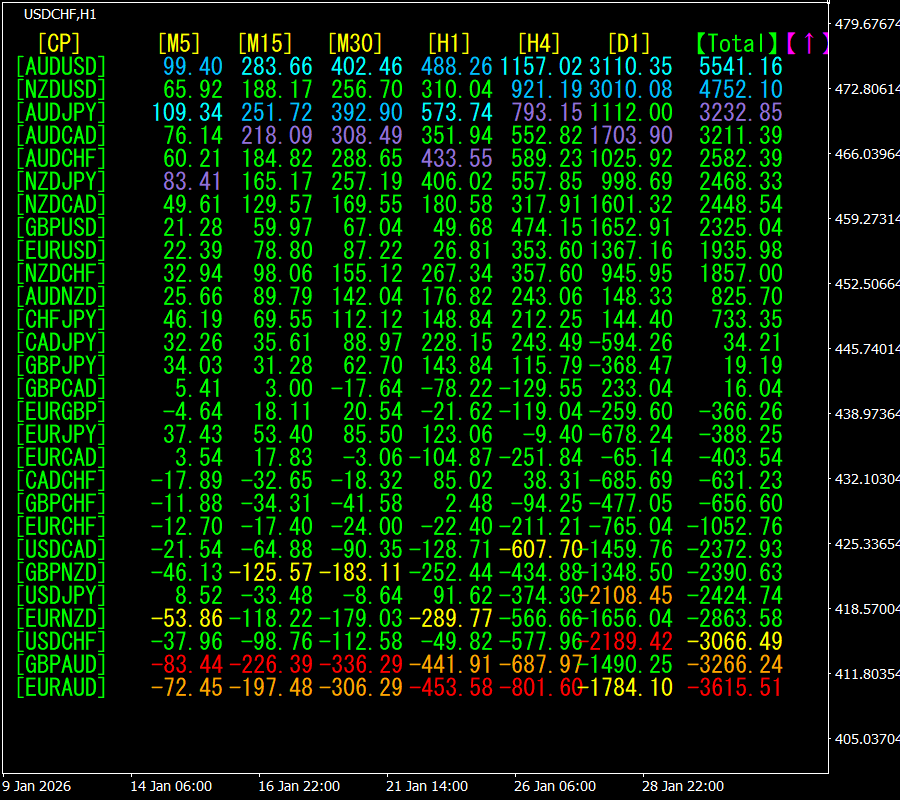
The below figure is from 2026 January 29 13:28(JST) screenshot.
[Total] shows numbers in descending order. The top one, AUDUSD, is blue on all timeframes. The Total value is 5541.16, a large positive figure. This suggests an uptrend in AUDUSD.
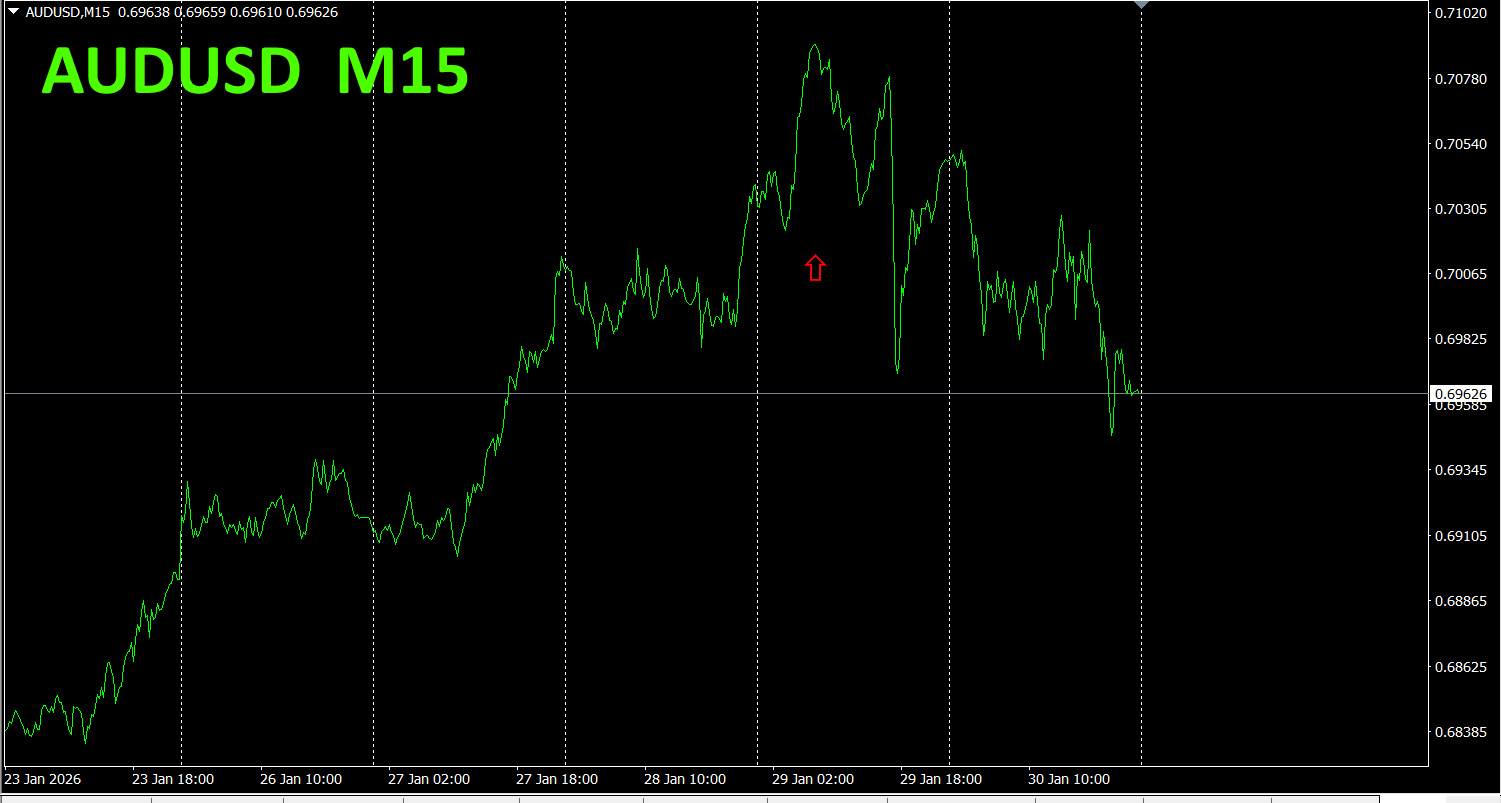
Now, let’s look at the AUDUSD chart.
Red arrows show the point captured by the screenshot. It captures the rising section.
“28 Currency Pairs Best Select Indicator” can easily identify among 28 currency pairs which one has the strongest trend. Also, it indicates, by numbers and colors, whether you should trade now. It is an excellent indicator that lets you judge all currency pairs at a glance.
“28 Currency Pair Best Select Indicator” https://www.gogojungle.co.jp/tools/indicators/35128

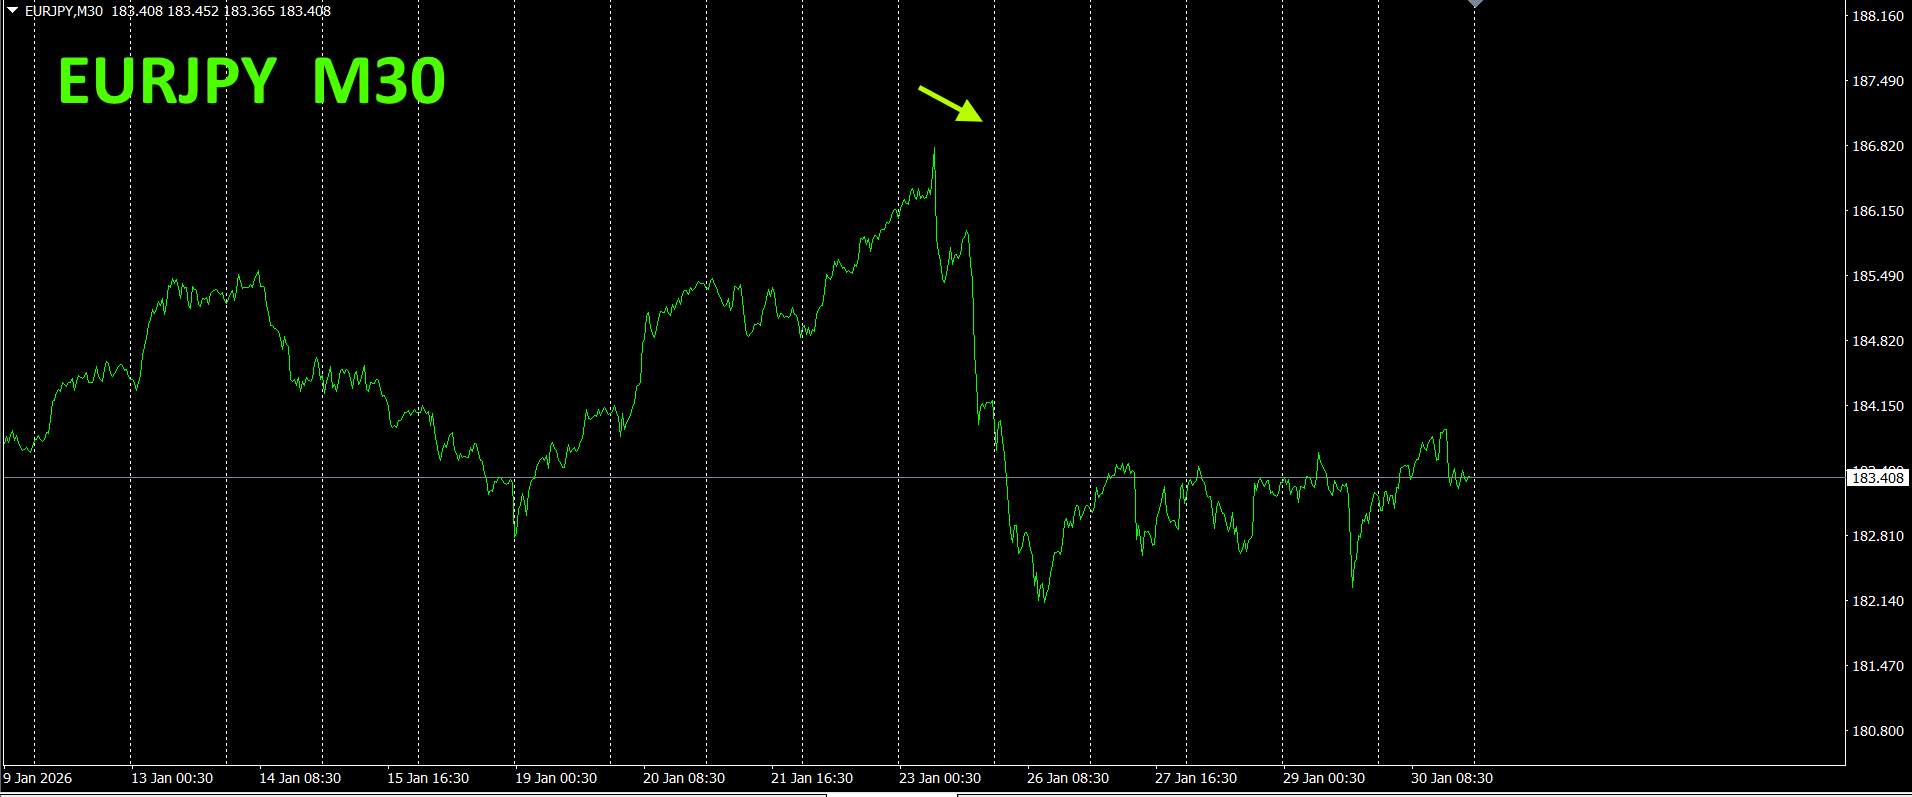
3. Since May 2021, how has EURJPY moved since May 2021?
We have been tracking EURJPY since May 2021.
To view the overall trend, we描く roughly three weeks on a 30-minute chart.
Last time, we wrote as follows.
Pink is EUR, green is JPY. JPY has risen sharply, while EUR is almost horizontal. Therefore, EURJPY is expected to decline.
As predicted, it declined, and upper prices were capped.
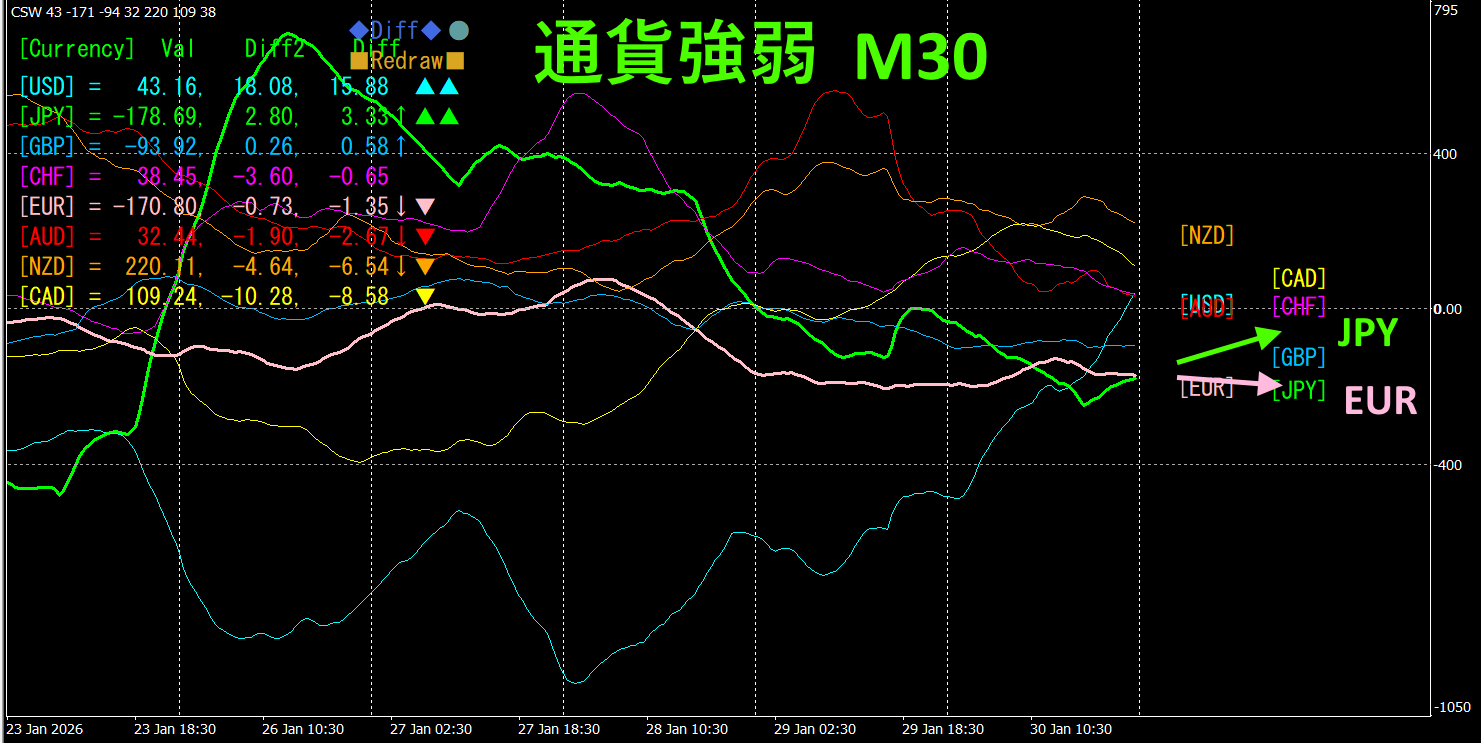
30-minute currency strength chart.
Pink is EUR, green is JPY. JPY has turned slightly upward, while EUR is horizontal to slightly downward. Therefore, EURJPY is expected to move downward.
4. Using the new indicator Dual_MACD_Trend_Indicator
New indicator “Dual_MACD_Trend_Indicator” is available at below.
MT4 version:https://www.gogojungle.co.jp/tools/indicators/62199
MT5 version:https://www.gogojungle.co.jp/tools/indicators/62202
This indicator clearly shows the trend direction with colors. If the color bar is Lime, it’s a buy; if Red, it’s a sell. If no color, there is no trend. The color display makes trend status easily understandable at a glance.
This indicator was applied to USDCHF on the 1-hour chart
The red sell zone and green buy zone are clearly separated, making trading easy at a glance. In the top diagram, focus only on the white ellipse-marked area, and trade selling.
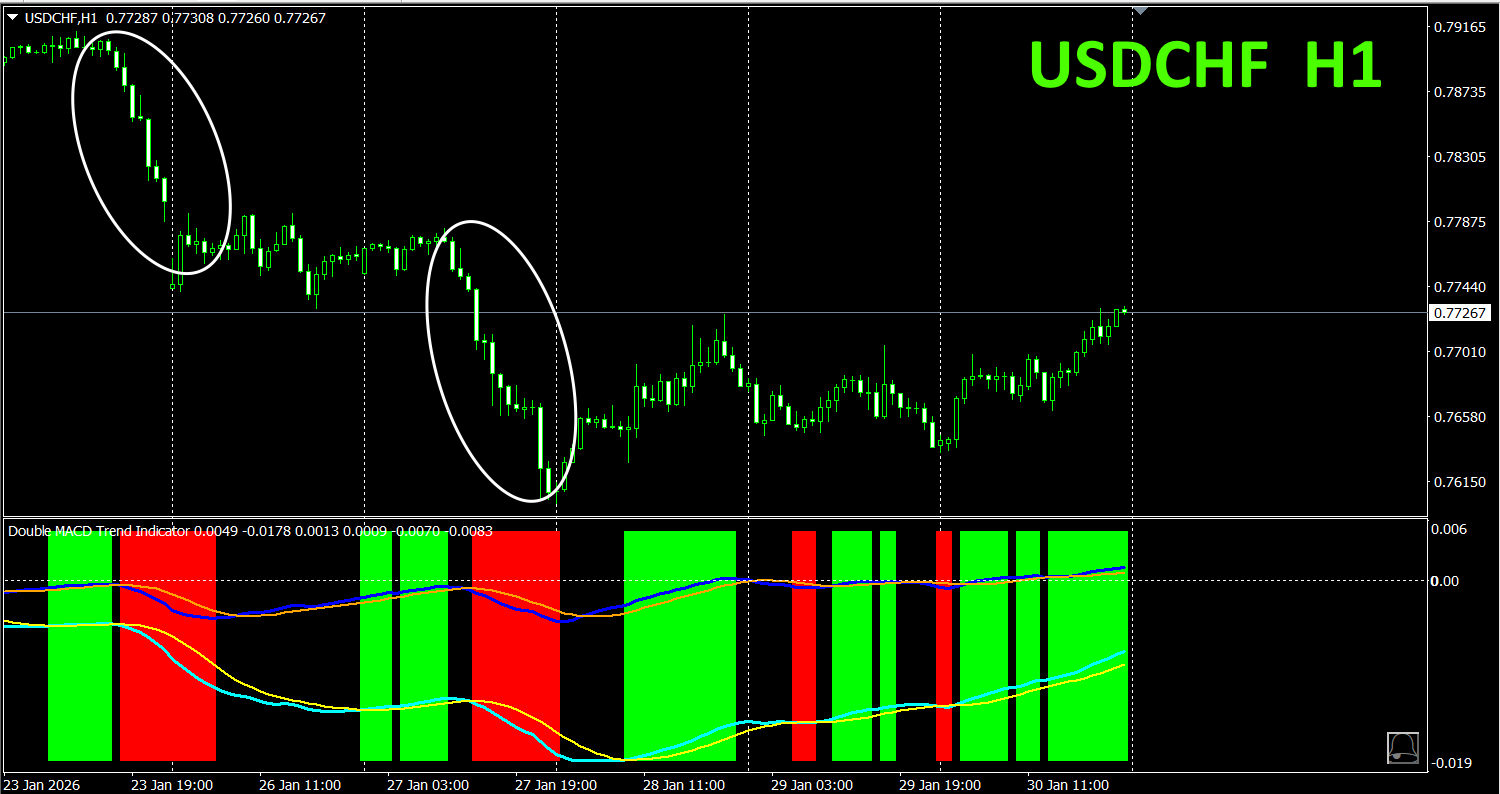
With Dual_MACD_Trend_Indicator, buy in green zones and sell in red zones; otherwise do not trade.
Using Dual_MACD_Trend_Indicator eliminates any hesitation about trade direction.
5. Hyper-CSW has been released
“Hyper-CSW” is a high-performance indicator that visually shows the strength of the eight major currencies at a glance. It records the strongest currency and score for the current timeframe from the last 10 bars, enabling accurate assessment of trend durability and turning points. Additionally, it supports multi-timeframe analysis showing currency strength rankings (top 4 currencies) across timeframes such as M15, H1, H4, D1, W1 with scores. Its highly legible color lines and separate window display give you the power to discern the market trend. See the following link for details.

https://www.gogojungle.co.jp/tools/indicators/65082
※Recommended indicators
“8CFD Visualization Indicator Any version”
https://www.gogojungle.co.jp/tools/indicators/32288
“Toretore Indicator””
“TrendLine-EX”
https://www.gogojungle.co.jp/tools/indicators/42257
“8 Currencies Strength Visualization Indicator” is described on the following pages。

MT4 version https://www.gogojungle.co.jp/tools/indicators/39150
MT5 version https://www.gogojungle.co.jp/tools/indicators/39159
【My Products for sale


