NHadou Trade History - Domestic Individual Stocks - 3612
I will post the trade history by NHadou.
【Subject】
Domestic stocks3612World
【Premise】
The investment target is Japanese individual stocks on a weekly chart.
The tolerance for loss is 100,000 yen. In this case, trades were made with only 200 shares due to insufficient funds.
【Result】
-29,932yen stop loss
【Trading history】
1. Entry (2026/01/09)
① From Fig1, the Nikkei futures monthly chart is in an uptrend.

② From Fig2, the Nikkei futures weekly chart is in an uptrend.

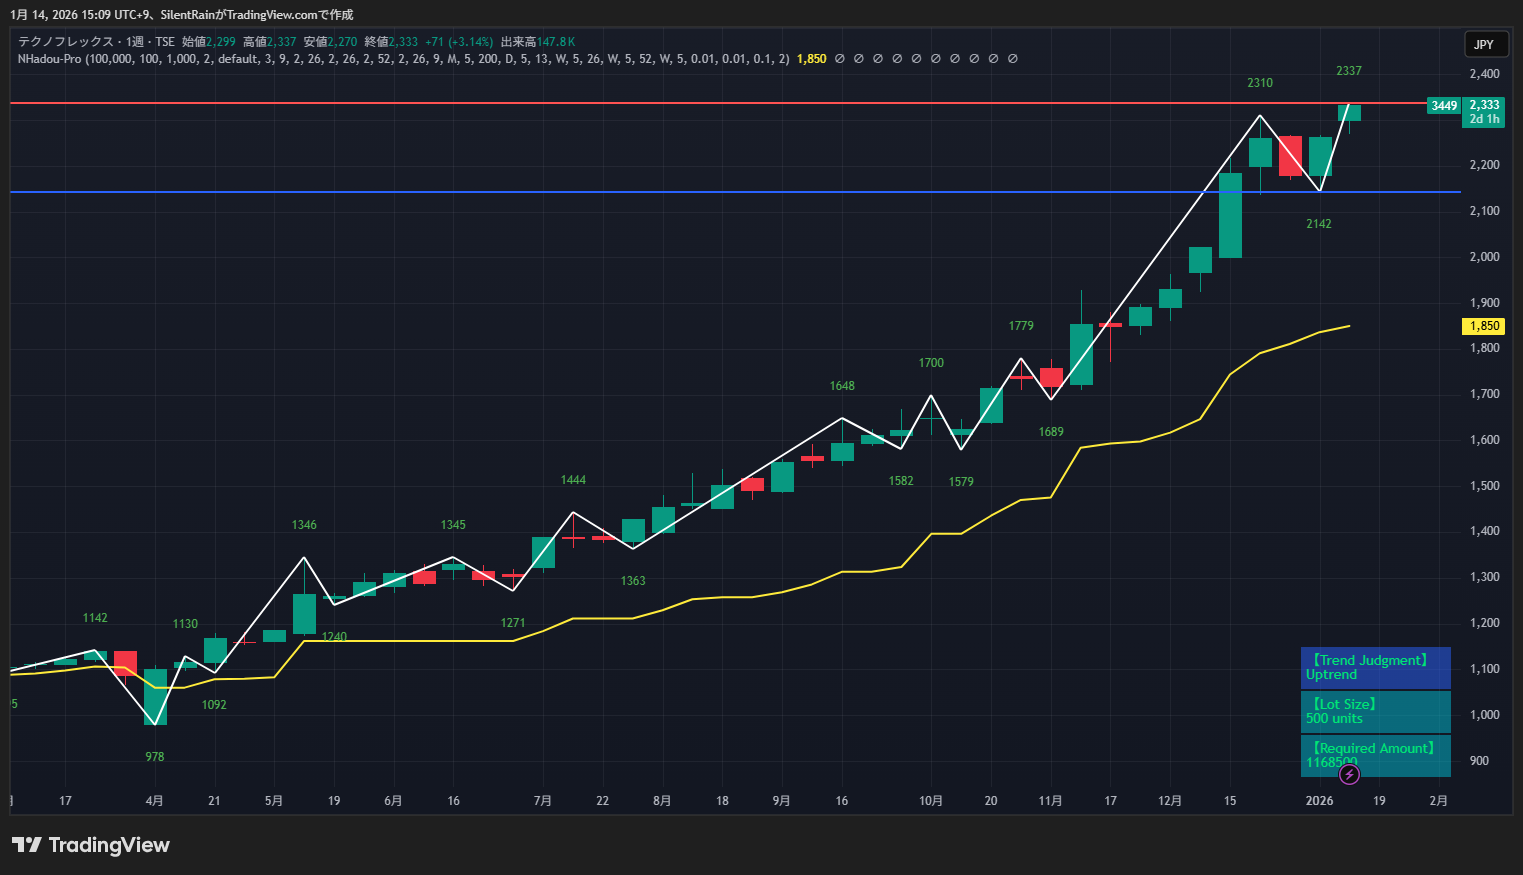
③ From Fig3, the individual stock 3449 monthly chart is in an uptrend

④ From Fig4, the individual stock 3449 weekly chart is in an uptrend
①、② show that Nikkei futures have uptrends on both monthly and weekly charts, and
the target stocks also show uptrends from ③ and ④
Therefore, I entered at NHadou’s 3060 price quote, at 3070 yen, with a lot size of 100.
2. Stop loss (2026/01/29)
Stop-out was triggered at the loss-cut setting value of 3015.

3. Reflection
The Nikkei Average was volatile due to the general election dissolution, and it seemed to be dragging us down.
Anomalously, elections are typically a buy signal, but we are in a corrective phase. Also, recently the Nikkei has been more volatile.

Because funds were insufficient, I could not allocate a lot to the loss tolerance, so the damage was limited, which is somewhat fortunate.
Basically, NHadou sets a predetermined loss tolerance and a predetermined stop-out position.
Therefore, I think the logic itself was not problematic.
If I had to say something
Also, since the dissolution election has a buy anomaly, when the Nikkei Average sharply falls contrary to that, we should consciously consider manual stop-loss.
When you adopt NHadou, this simple system allows you to determine, from the tolerance for loss and the number of shares,
① An entry point and a stop-loss point based on a refined Dow Theory
② The number of entry lots
③ The required investment amount
All of these can be understood on a single screen.
Furthermore, even if the chart is on a different time frame such as monthly, weekly, daily, or other intervals,
the chart rendering is always judged per candlestick, so there is no need to change the settings.