Another missile issue erupts again? Cutting through the worried Nikkei market with a P&F chart!
After the North Korea–United States summit held on February 27 and 28, 2019, reports say North Korea is proceeding with rebuilding a missile launch site it had promised to dismantle, and uneasy conditions continue. Because Nikkei is located in a position that tends to attract North Korean missiles, there is concern that a renewed “missile shock” could hit the market again. This time, we will examine the volatile March market from both fundamental and technical analysis using P&F charts. [cc id=24719] [cc id=24719] After the North Korea–United States summit held on February 27 and 28, 2019, reports say North Korea is proceeding with rebuilding a missile launch site it had promised to dismantle, and uneasy conditions continue. Because Nikkei is located in a position that tends to attract North Korean missiles, there is concern that a renewed “missile shock” could hit the market again. This time, we will examine the volatile March market from both fundamental and technical analysis using P&F charts. [cc id=24719]
1. Current Status of the Nikkei Average in the 2nd Week of March (SQ Week)
In the 2nd week of March, the Nikkei average closed down 430.45 yen at 21,025 yen from the previous day. There were moments when it briefly dipped below 21,000 yen, but the impression is that buys aimed at a technical rebound after breaking 21,000 yen did not come in before close. Since the closing price broke below the March SQ value of 21,348.40 yen, the SQ anomaly of “sell if you close below the SQ value” also contributed to lack of buying pressure in the Nikkei. Overall, the market appears to be in a situation where there is little motivation to buy.2. Nikkei Average from a P&F Chart Perspective
Here, we will conduct a Nikkei average analysis using P&F charts.① Technical Analysis Using Trend Lines
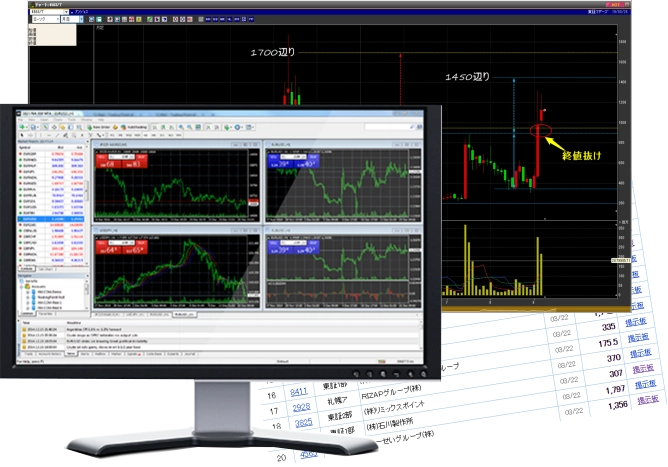
 Reference: Nikkei Average P&F Chart
To be continuedHere