
NHadou Trade History - Domestic Individual Stock 3449
I will post the trading history by NHadou.
【Target】
Domestic stock 3449 Technoflex
【Premise】
The investment target is weekly charts of Japanese individual stocks.
The allowable loss amount is 100,000 yen. This security is traded with only 100 shares due to insufficient funds.
【Result】
Stopped out at a loss of -17,765 yen
【Trading History】
1. Entry (2026/01/04)
① From Fig1, the monthly chart of Nikkei futures shows an uptrend.

② From Fig2, the weekly chart of Nikkei futures shows an uptrend.

③ From Fig3, the monthly chart of individual stock 3449 shows an uptrend.

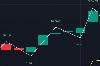
④ From Fig4, the weekly chart of individual stock 3449 shows an uptrend.
①, ② indicate that the Nikkei futures are in uptrends on both monthly and weekly charts, and
the target stocks also show uptrends from ③, ④.
Therefore, enter at NHadou’s bid price of 2310 yen, that is, 2311 yen, with 100 shares.
2. Stop loss (2026/01/28)
Hit the stop-out at the loss-cut setting of 2141.

3. Reflections
The Nikkei Average has been volatile due to the dissolution election, pulling in the opposite direction.
An anomaly suggests buying around elections, but it is entering a correction phase. Also, recently the Nikkei average seems more volatile.

Being undercapitalized, I could not place a full position up to the loss tolerance, so the damage was relatively small, which is fortunate.
Basically, NHadou sets a loss tolerance in advance and also determines the stop-out level.
Therefore, logistically, I believe there were no particular issues.
Additionally, since the dissolution election has a buying anomaly, when the Nikkei average suddenly falls contrary to that, I should consciously consider manual stop-outs.
When NHadou is introduced, this becomes simple and from the loss tolerance you set and the number of units,
① Entry point and stop-loss point based on a modified Dow Theory
② Entry lot size
③ Required investment amount
All of the above can be understood on a single screen.
Also, even on different timeframes such as monthly, weekly, daily, or other timeframes, the chart rendering always evaluates per candlestick, so there is no need to change the settings.