

GOLD Strength & Correlation Real-time Trade "GOLD STREAM" 2026.1.27
Today,
The more you are diligently doing technical analysis
the more you tend to fall into traps.
It might make you a little startled.
Why you get confused as you stack Elliott, Dow, and indicators
further and further
If your chart right now is
・Drawing Elliott waves from Fibonacci
・Confirming highs and lows with Dow Theory
・Overlaying RSI, MACD, and moving averages
・Thinking, “which one is right in the end?”
If you’re in that state,
that’snot a lack of effort.
Rather,
you may be doing too much.
The reason you’re not winning is
not because you’re lacking analysis
This is a common misconception among beginners.
“If I could analyze more, I’d win.”
“If I had more knowledge, I could judge better.”
But, in real-time GOLD,
the more you analyze, the slower your judgments become.
Because—
that analysis is
not directly teaching you who is strong now
right now.
.
What winning traders look at first
what they check at the start
Actually consistently successful traders
first confirm is
・the shape (pattern)
・the precise values of indicators
are not.
Strength, and correlationare.
In other words,
・Is GOLD truly the main driver now
・Is USD strong or weak
・Is this move a “trend” or a temporary blip
If you don’t see these,
no matter how perfect an Elliott wave looks
no matter how correct a Dow theory is
they will betray you easily.
Technical analysis has an order of use
Please don’t misunderstand.
Elliott, Dow, and indicators
do not mean nothing at all.
However,
using them all at once
as the first basis for judgment
is quite dangerous in GOLD.
What you should look at first is
・strength and weakness
・correlation
・the current market leadership
With that,
technical tools like PIVOT should be used
as confirmation.
If the order is reversed,
you’ll be stuck forever in a “never winning no matter how much you study” swamp.
To visualize that “order”
I created this
Recently released
GOLD STREAMis
・indicates entries
・executes trades automatically
・adds more indicators
It is not a tool for trading execution.
It is a tool to organize and show the strength and correlation of GOLD before you judge
.
So,
・before drawing technicals
・before overthinking
you’ll know which is advantageous now.
【I’ll explain with chart images】
Actual GOLD chart.
(2026-01-27)
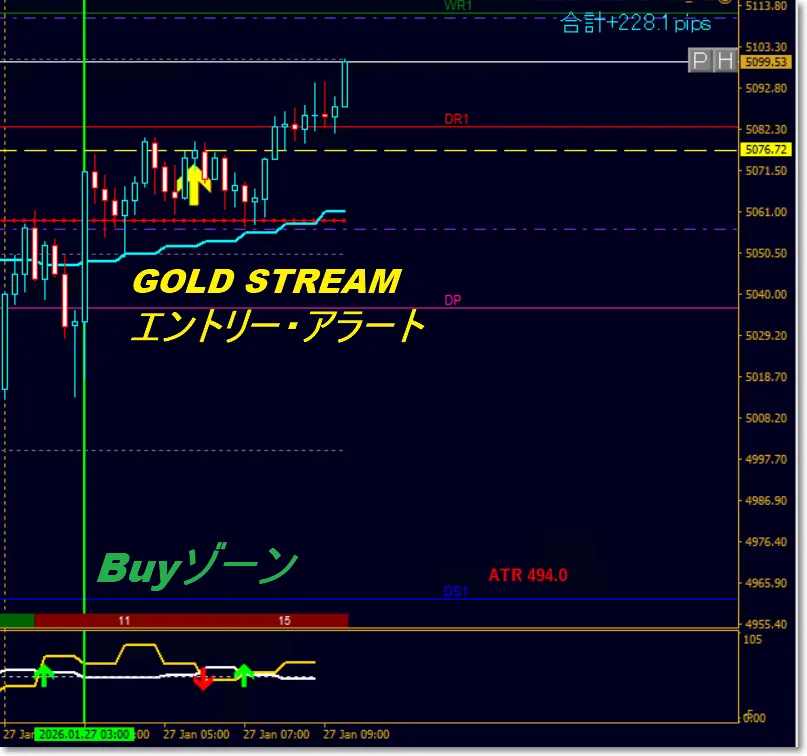
Because the results of strength & correlation analysis are displayed,
you can verify before entry whether this move has a basis and is genuine.
by checking beforehand.
Even just the mindset to start
On the product page,
・Why GOLD gets confused when using only technicals
・Why strength and correlation come first
・The decision order of winning traders
is all disclosed.
If you think, “I wish I could have told my past self this…”
then you’ve already moved to the next level.
Thank you for reading until the end.
Also, I’ll share more about shifting your trading perspective.