Discretionary trading support system trade
0
Discretionary Trading and System Trading
Usually, the EA used in FX refers tofully automatic tradingoriented system trading. It mechanically executes trades based on predefined logic.However, such EAs can extract and recognize technical indicators and numerical data from charts,but it is difficult to recognize chart shapes like a human.
On the other hand, a discretionary traderrecognizes chart patternsand, from past experience,recognizes high-probability situations, yet may miss entry triggers due to a lack of focus, or may take profits too early or cut losses too late,making it hard to execute trading rules mechanically.
What kind of EA is Market Principle EA 1.05
The difference between a Market Principle EA and a typical EA is that from entry to exit,a typical EA performs trading automatically, butin the Market Principle EA, a discretionary trader selects the entry method and exit logic, and based on thatthe EA executes trades mechanically.
If a discretionary trader
recognizes chart patternsandElliott Wave,it can immediately draw exit points and Fibonacci retracements on the chart with simple UI operations! The tool helps discretionary tradersrealize their trading strategies with various setups.
A new, unprecedented type of EA.
Descriptions of various UI in Market Principle EA

①~② Manual entry buttons and lot size
① = When you press the "BUY" button, you go long. When you press the "SELL" button, you go short.
② = The lot size is determined by the number in "LOT". 1.0 lot = 100,000 currency units
Common/Parameter settings

③ Exit logic button

For a long entry, the starting point is a bullish candle; for a short entry, the starting point is a bearish candle.
When selecting the "ELLIOT WAVE" logic
1. TP and SL
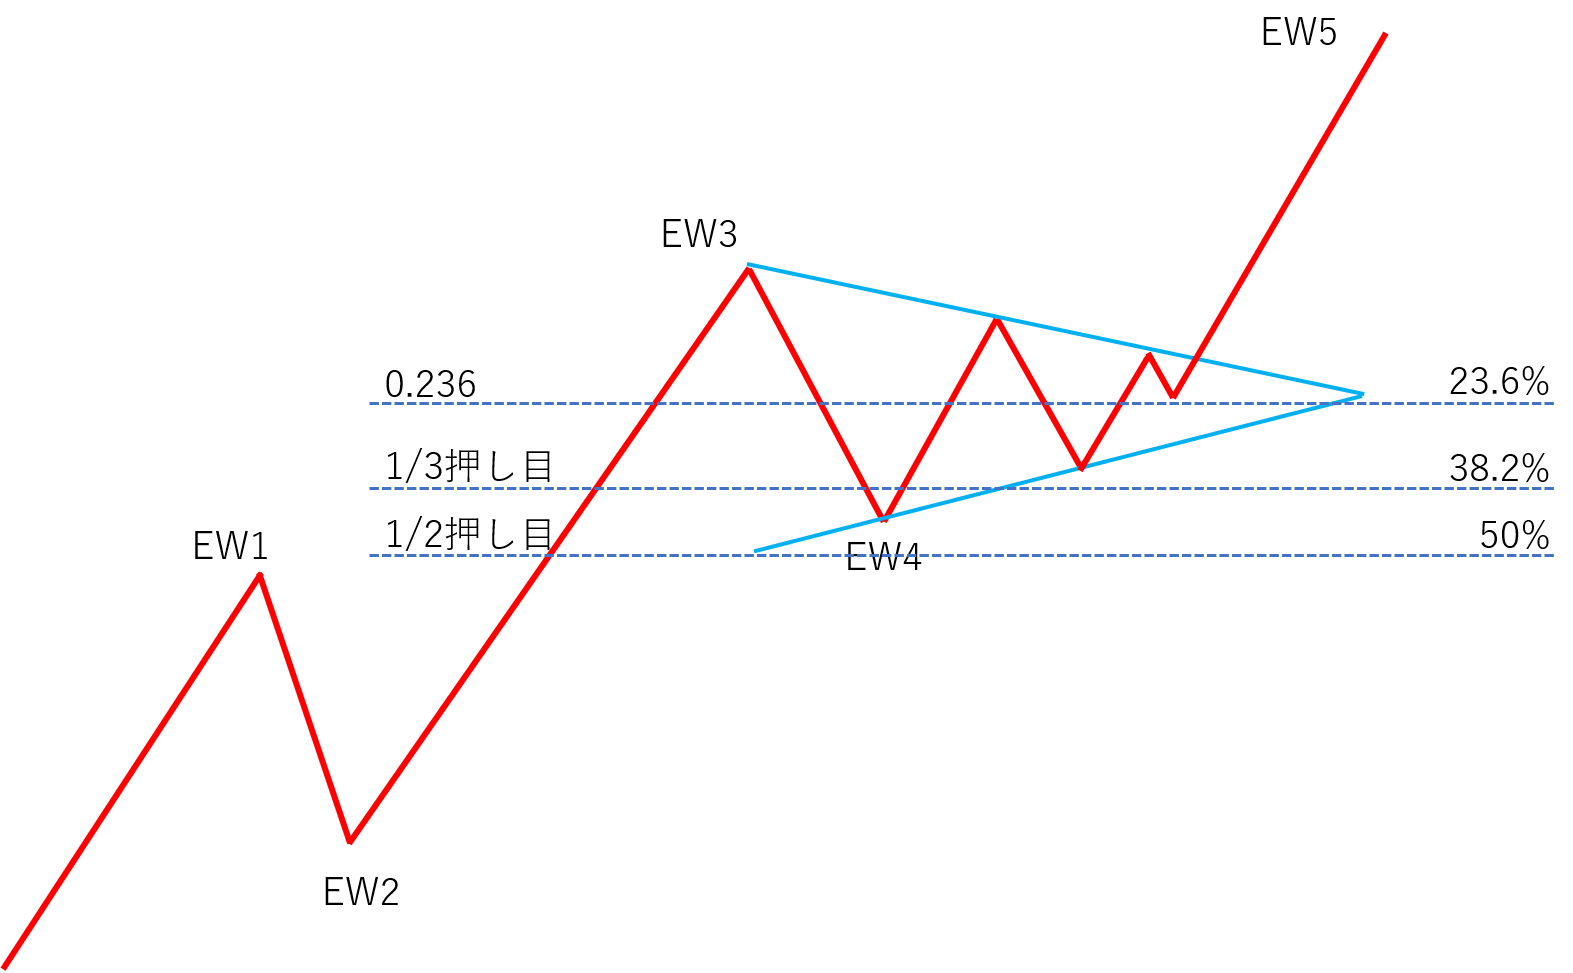
(1) Scenario targeting the third wave target rate
T/P … Elliott Wave third-wave target rate (calculated by a proprietary logic)
S/L … starting point of Elliott Wave wave 1

(2) Scenario targeting the fifth-wave target rate*
*When the third wave is confirmed and the fifth-wave target rate is displayed on the chart
T/P … Elliott Wave fifth-wave target rate (calculated by a proprietary logic)
S/L … Elliott Wave wave 2

2. Moving S/L
(1) Move to break-even by width from cost to target rate × 0.5*
*Default is false, so no move to break-even.
(2) Move to half-profit at width from cost to target rate × 0.7 (70% trigger thereafter)
(3) After reaching the 70% trigger, move S/L to the midpoint between cost and 70% trigger
3. Others
If RSI holds a long position and reaches 80, or holds a short position and reaches 20, perform all-close (RSI all-close activation true).
Overall

When selecting the "ELLIOT WAVE" logic and setting parameters

When selecting the "CHART PATTERN" logic
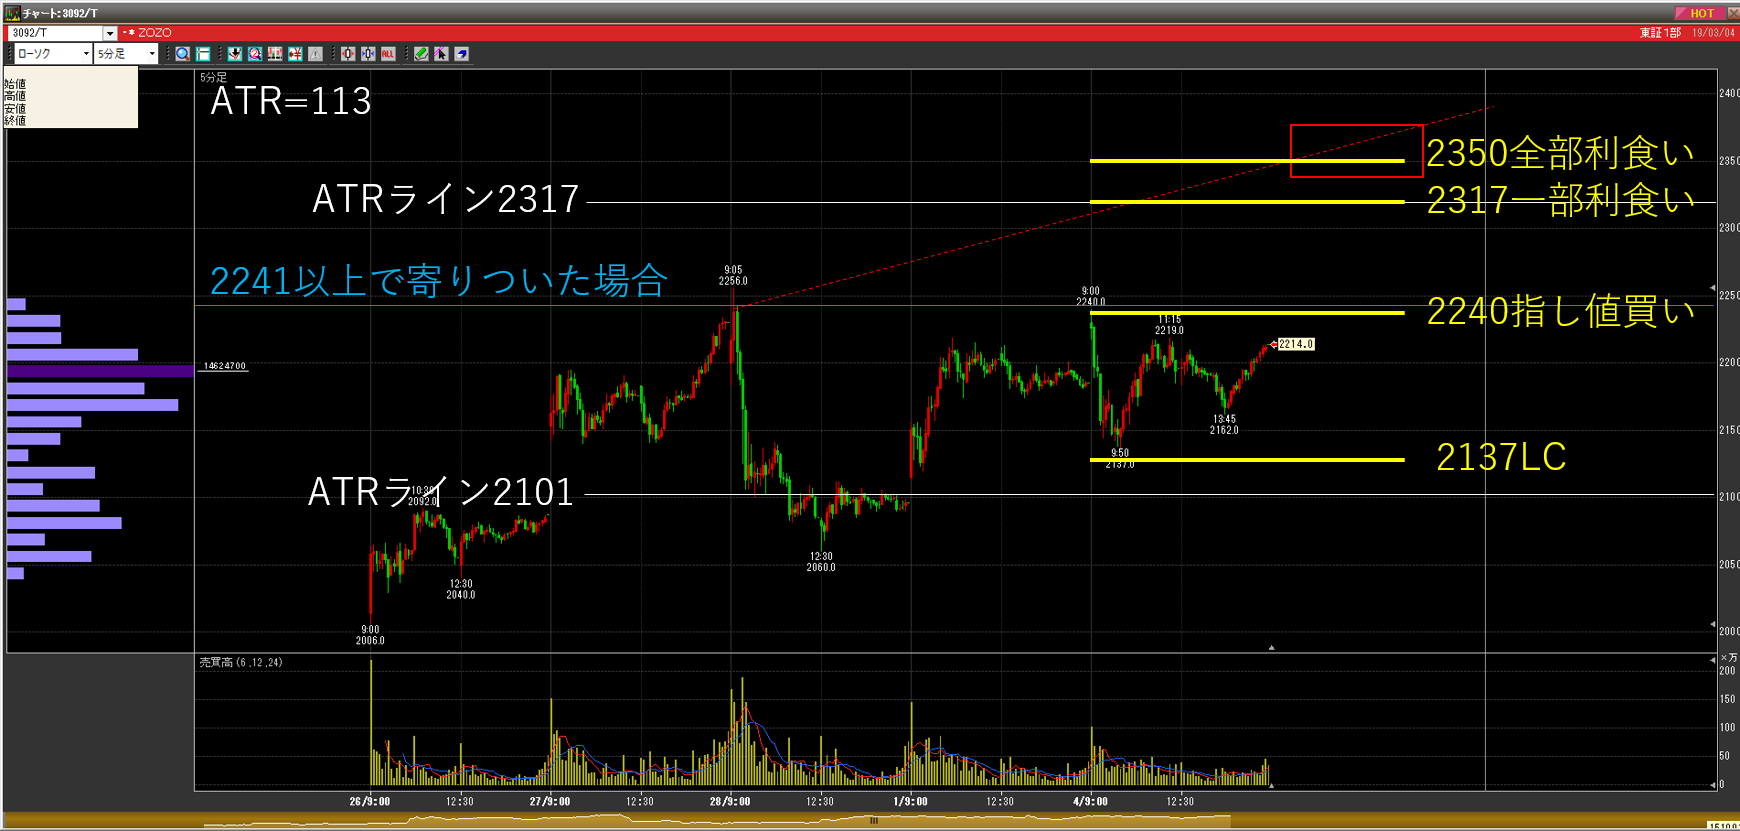
1. TP and SL
T/P … the chart pattern target rate, the maximum reached point
S/L … the next starting price after breaking the red "□" on the chart pattern, for long the bottom, for short the top
2. Moving S/L
(1) Break-even at width from cost to target rate × 0.5
(2) Half-profit at width from cost to target rate × 0.5
3. Others
If RSI holds a long position and reaches 80, or holds a short position and reaches 20, perform all-close (RSI all-close activation true).

When selecting the "CHART PATTERN" logic and setting parameters

④ How to trigger entries

The trigger lines are drawn in the UI, and when any of these lines reach the trigger, entry occurs and everything is cleared (disabled). This is to prevent unintended averaging down.
⑤ Exiting (manual)
You can determine exit points using these horizontal lines or trendlines.
As a premise, if there is a horizontal line or trendline in the profit direction at the current rate, only line-touch exits. If there is both profit-direction and minus-direction lines, you can choose between line-touch and close-at-bar (close by price).

⑥ Clear all lines and indicators

indicator

Trading record
Displays combinations of indicators, win rates for long and short by currency pair, and average PIPS gained.

About Elliott Wave Theory
Details of Elliott Wave Theory are also introduced on this site,here, so we will omit them here.
Here, we explain how to utilize this Elliott Wave Theory within Market Principle EA.
First, please watch the video below: “How to capture the first wave of Elliott Wave on the right side of the chart.”
How to capture the first wave of Elliott Wave on the right side of the chart (video)
https://youtu.be/EdAqWJDSXg4How to generate Elliott Wave with Market Principle EA (video)
Please watch this video after finishing the video “How to capture the first wave of Elliott Wave on the right side of the chart.”
https://youtu.be/UArThj1EuWE
About Chart Patterns
This Market Principle EA can output chart pattern targets for patterns such as pennants, flags, ranges, and triangles instantly and easily. The method is very simple: just enclose the real body of the candlestick cluster in which price is consolidating with a [□].
https://youtu.be/8eth1uc-KLU
To receive Market Principle EA for free
Click the button below and complete the prescribed procedure.

× ![]()