

Usage of “visualization indicators” (Part 235)
“Visualization Indicator” utilization(its235)
1. evolved the 28 Currency Pair List Indicator into an indicator
“8CP Visualization Indicator” to draw USDCHF
“8CP Visualization Indicator” includes Oceania version、 London version、 NewYork version、 AnyCP version.” This time, we used the NewYork version.
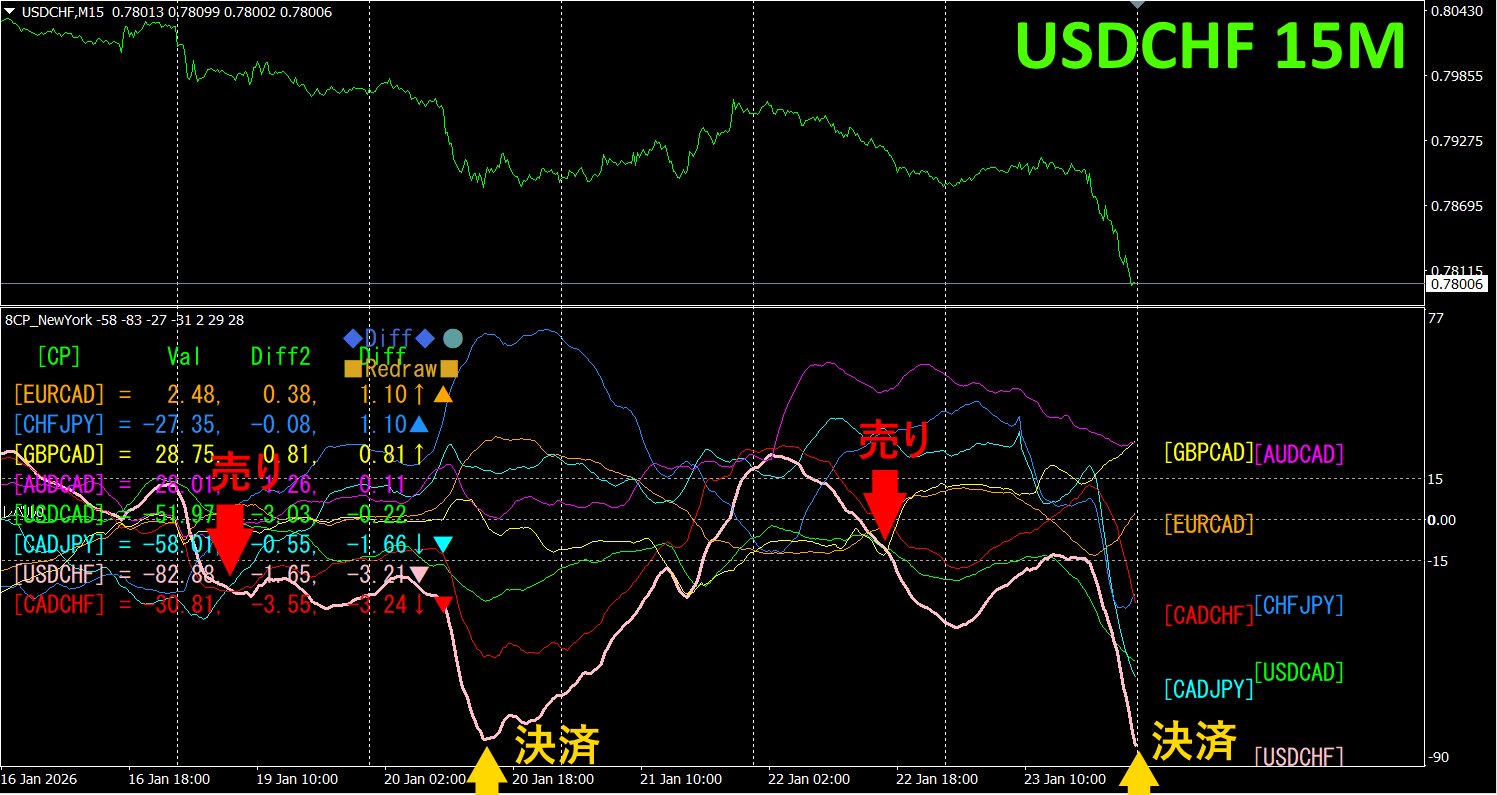
The upper half is a 15-minute chart of USDCHF. The lower half is from the “8CP Visualization Indicator”, pink colored graph corresponds to USDCHF.
2, since it broke below the other graph groups, we will short selling. We close at the bottom of the chart.Profit from the first run is about 90 pips、 second run about 120 pips.
Currency Strength Graph
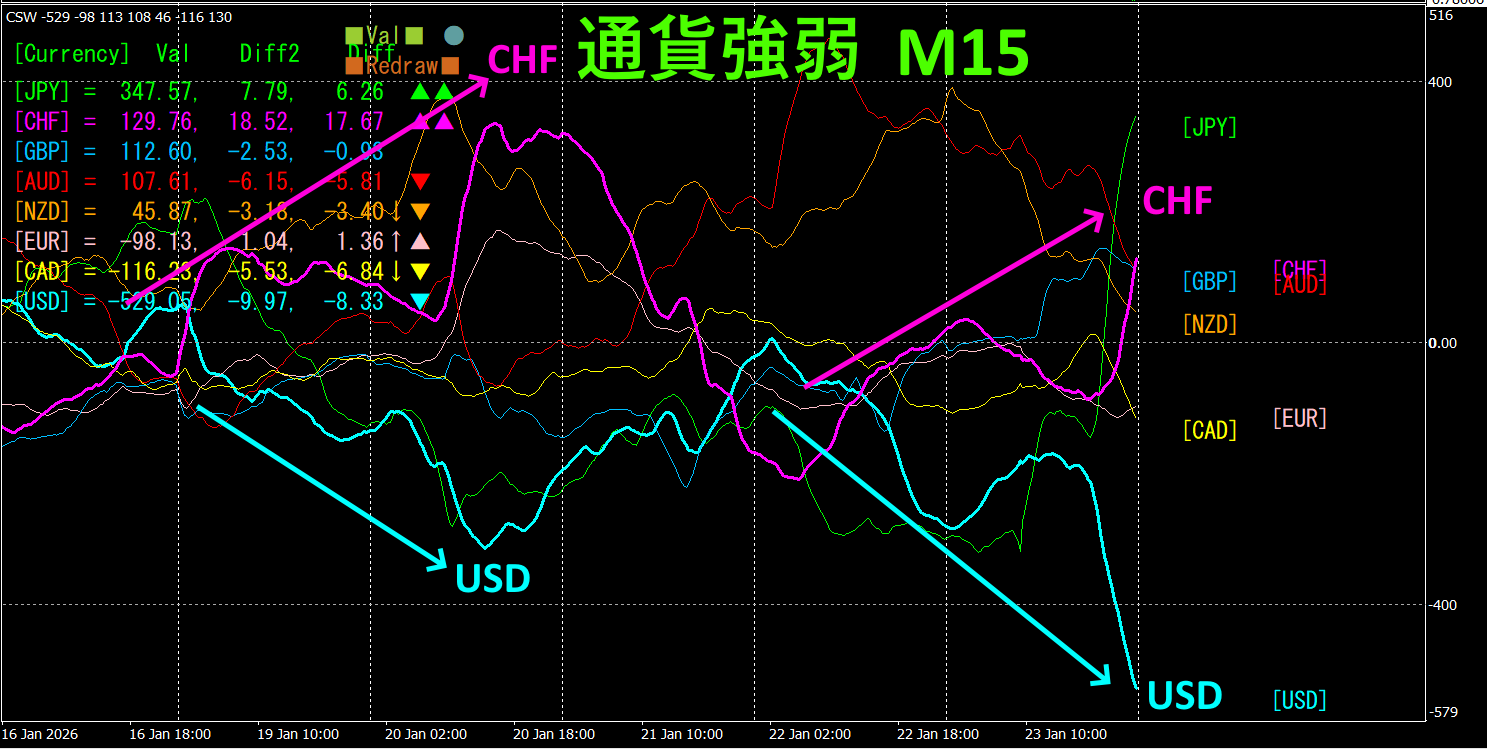
Looking at the 15-minute currency strength graph, CHF is strong、 USD is weak, and on the currency strength graph, CHF show a remarkable inverse correlation.
The relation CHF > USD indicates to focus on the portion where CHF and USD are spreading, and trade USDCHF by selling. because the inverse correlation chart is clear, while the vectors are expanding, simply hold the position.
In FX, you should select the currency pair that is currently expanding the most and in an inverse correlation to trade, and the results will follow.
“Target currency strength inverse correlation!” is the rule of FX.
Using “TrendLine-EX” allows entries and settlements to be automated via diagonal trendline breaks. Since you can leave it as is, easy and effortless trading becomes possible. “TrendLine-EX” can perform auto-sell on breakdown of the trendline and auto-settlement on breakout, making it a semi-automatic EA.
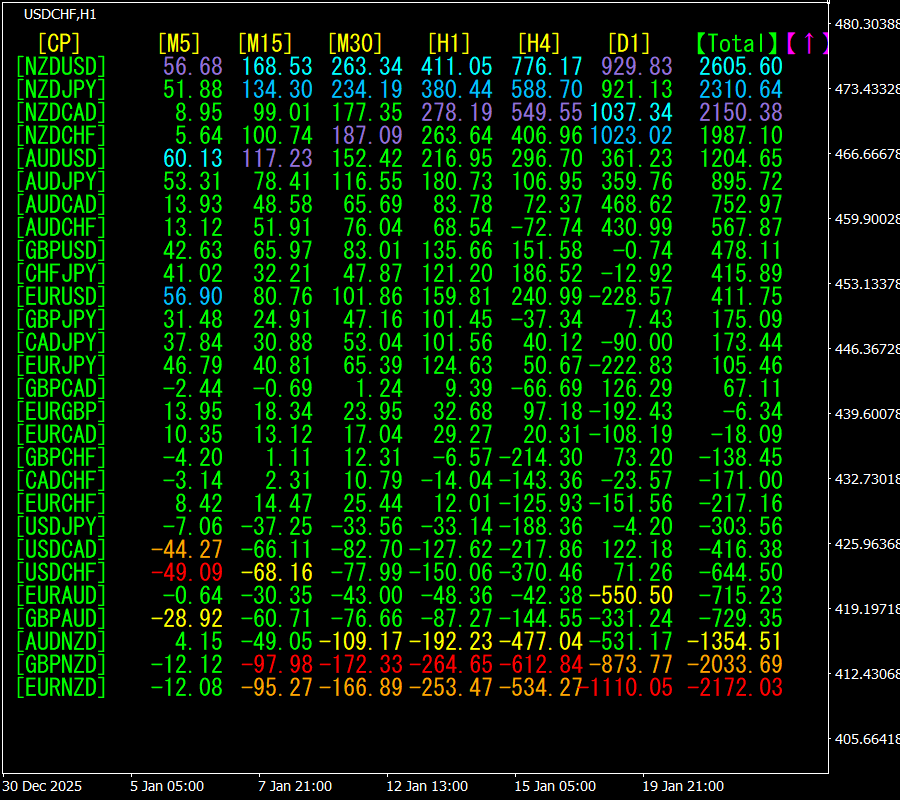
2. Try Best Select Indicator
The bottom image is a screenshot taken on 2026 January 20 12:49 (JST) .
[Total] is sorted in descending order by value. At the top, NZDUSD shows blue color on all timeframes. Total value is 2605.60, a large positive number. This suggests an uptrend for NZDUSD.
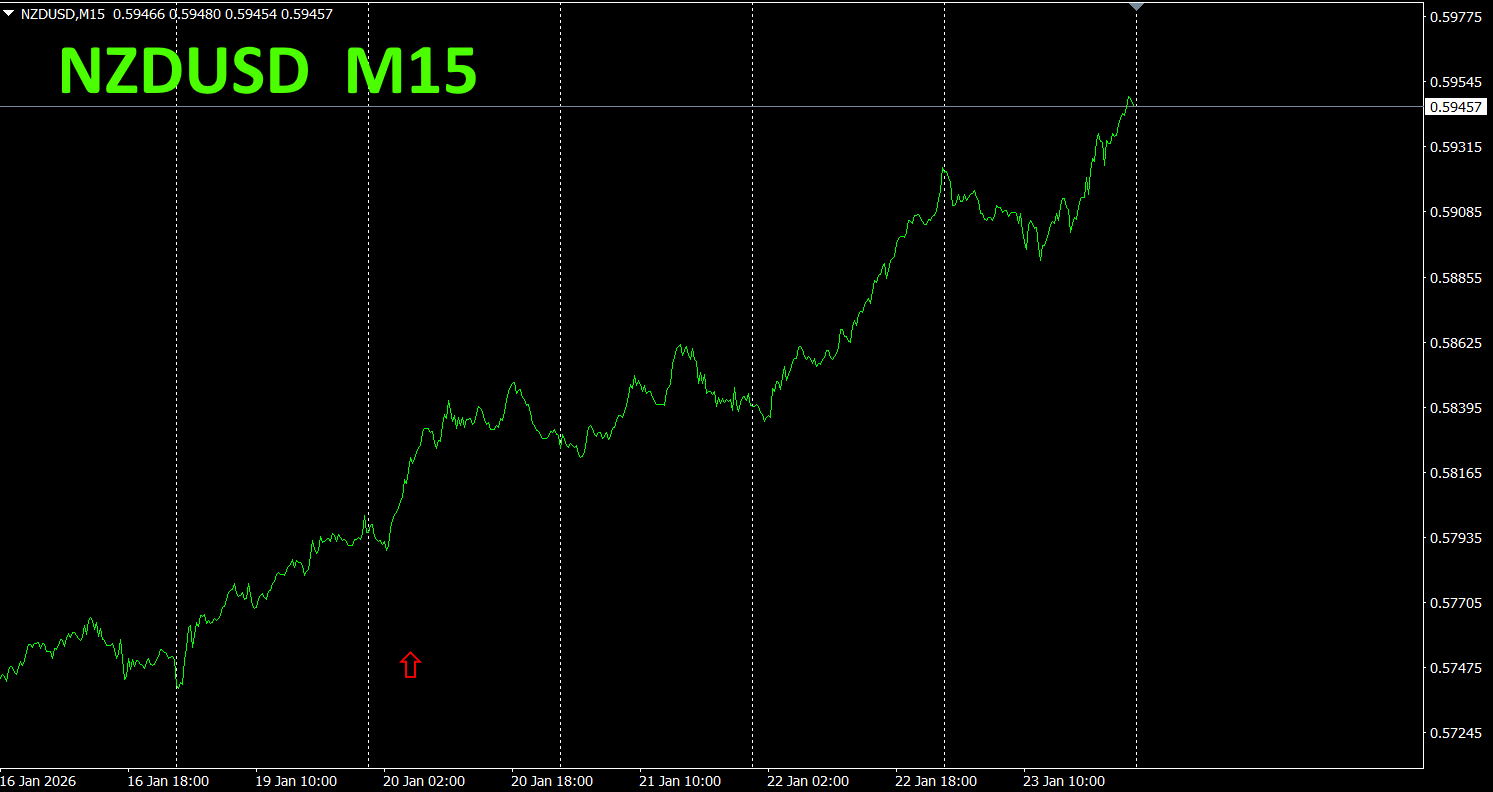
Now, let's look at NZDUSD chart.
The red arrow marks the captured screenshot, catching the rising part.
“28 Currency Pairs Best Select Indicator” enables quick discovery of which currency among 28 pairs is showing the strongest trend. Also, it tells you now, whether to trade or not with numbers and colors. It’s an excellent indicator to judge all currency pairs at a glance.
“28 Currency Pairs Best Select Indicator” ”

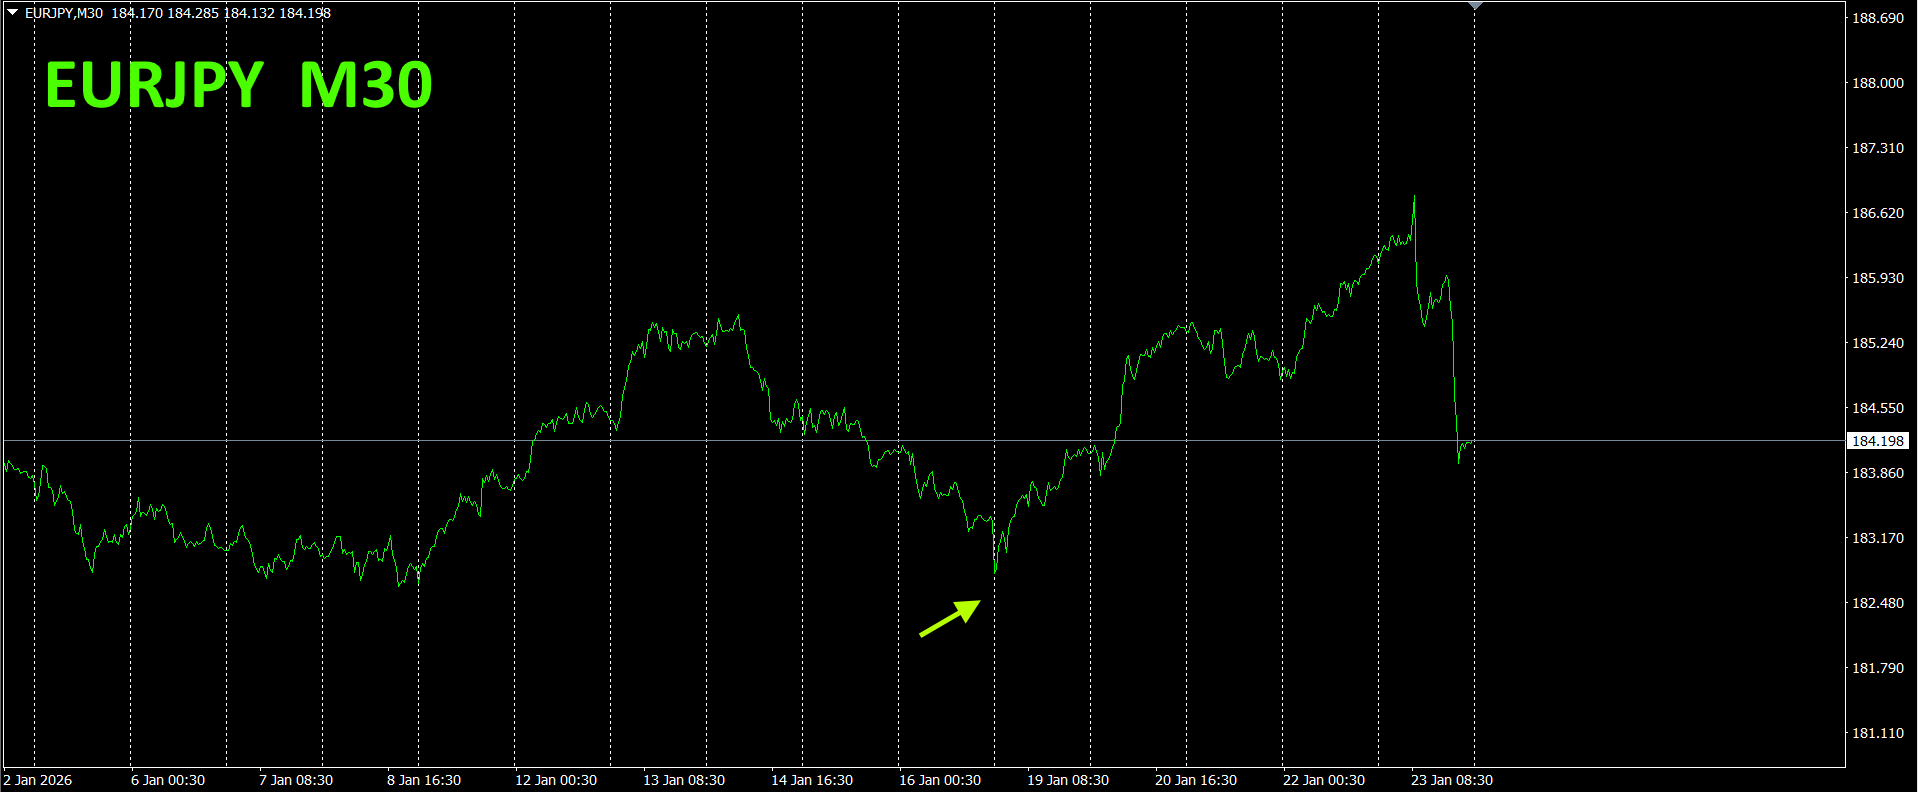
3. From May 2021, what happened with EURJPY
We have been tracking EURJPY since May 2021.
To view the overall trend, a 30-minute chart covering approximately the last three weeks is drawn.
Previously, I wrote as follows:
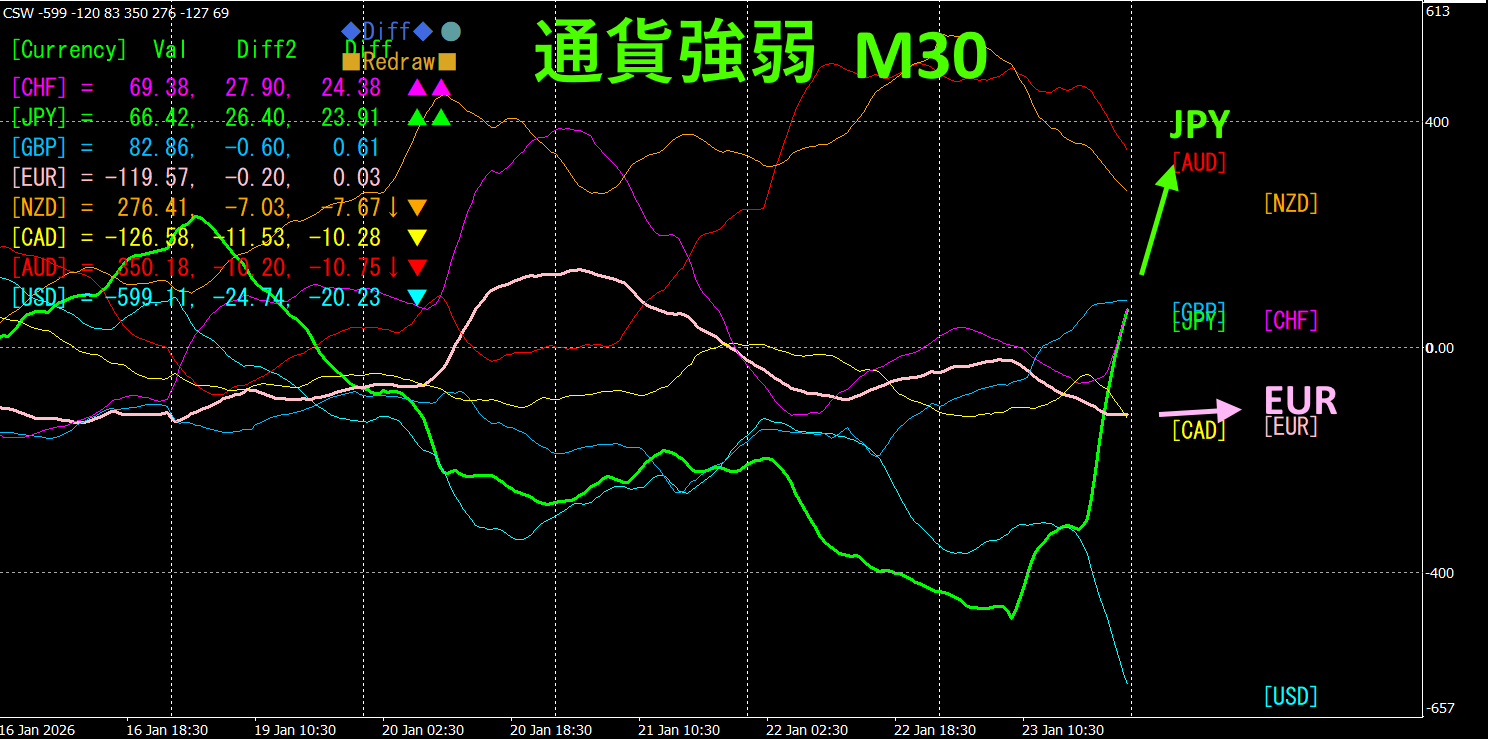
Pink is EUR, green is JPY. JPY has moved upward significantly, while EUR is almost horizontal. Therefore, EURJPY is expected to trend upward.
It is rising with a nice triangle pattern. It progressed as predicted.
The 30-minute currency strength chart shows Pink is EUR, green is JPY.
JPY rose sharply, while EUR remained nearly horizontal.
version:https://www.gogojungle.co.jp/tools/indicators/62199
MT5 version:https://www.gogojungle.co.jp/tools/indicators/62202
It is an indicator that clearly shows the direction of the trend with colors. If the color bar is Lime, it means buy; if Red, sell. If there is no color, there is no trend. The color display allows you to grasp the trend state at a glance..
I have introduced this indicator to NZDUSD on a 1-hour chart.
The red area indicates sell zones and the green area indicates buy zones, clearly separated, making trading easier at a glance.In the top image, focus only on the white oval encircled area and simply trade with buys.
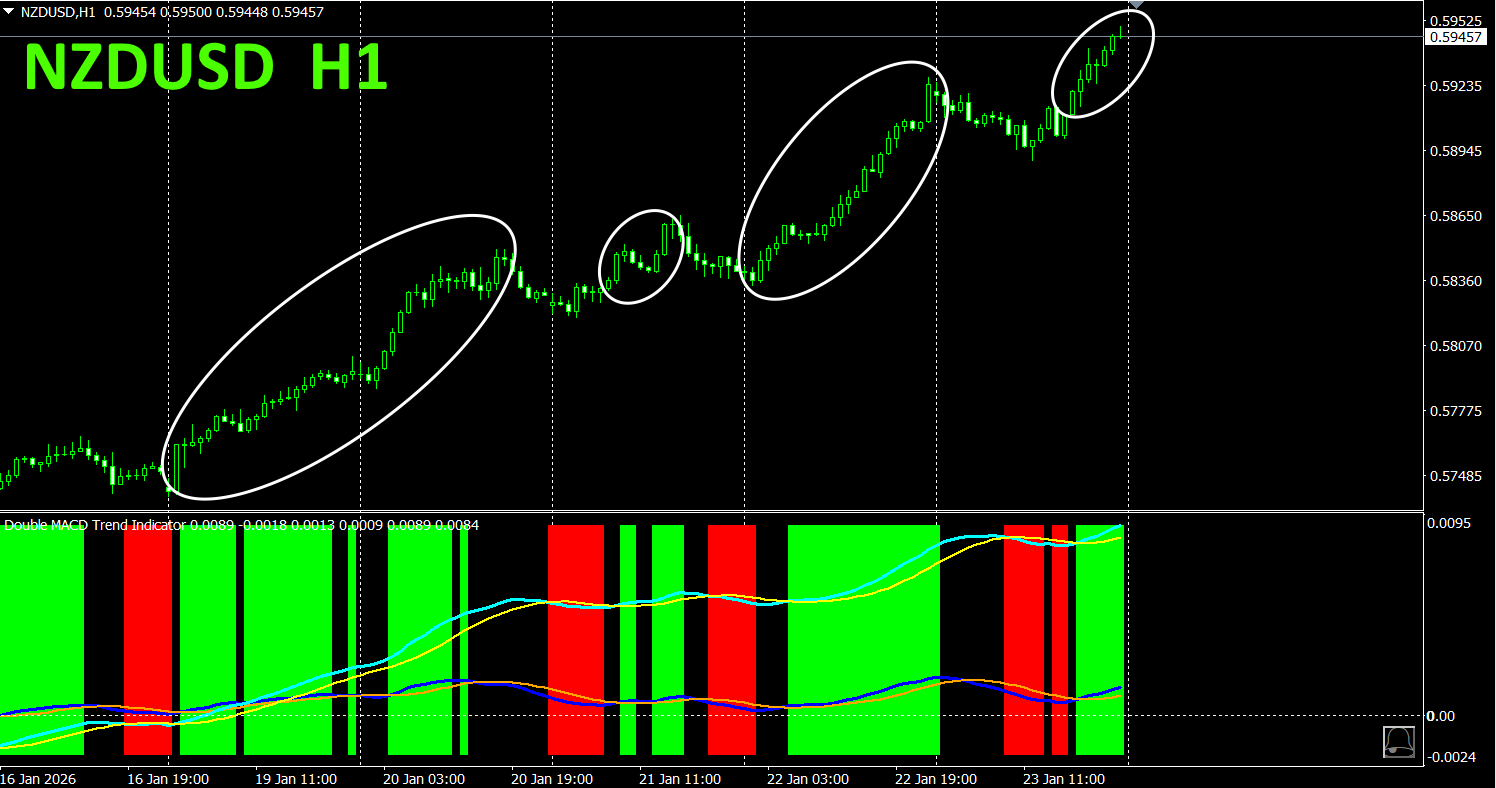
With “Dual_MACD_Trend_Indicator”, buy in green zones and sell in red zones, and do not trade in other areas.
Using “Dual_MACD_Trend_Indicator” eliminates any hesitation about trading direction.
5. Hyper-CSW has been released.
“Hyper-CSW” is a high-performance indicator that visualizes the strength of the eight major currencies at a glance. It records the strongest currency and score for the current timeframe over the past 10 bars, capturing trend persistence and turning points accurately. Additionally, multi-timeframe analysis supports the top four currencies with scores in timeframes such as M15, H1, H4, D1, W1. With highly visible color lines and a separate window display, it empowers you to discern market direction.
For details, please see the following link.

https://www.gogojungle.co.jp/tools/indicators/65082
※Recommended indicators
“8CFD Visualization Indicator Any Edition””
https://www.gogojungle.co.jp/tools/indicators/32288
“Toretore Indicator”
https://www.gogojungle.co.jp/tools/indicators/50115
“TrendLine-EX”
https://www.gogojungle.co.jp/tools/indicators/42257

“8 Currencies Strength Visualization Indicator” is explained on the following pages。

MT4 version https://www.gogojungle.co.jp/tools/indicators/39150
MT5 version https://www.gogojungle.co.jp/tools/indicators/39159
【My listed products】


