

【Dollar-Yen Forex Intervention?!】 Rebound selling succeeds, profits exploding!! 【Tengan Awakening Rook Practical Diary #2】
This series is a diary that uses the Tenkogan (Divine Eye) Awakening Rank indicator in daily markets, pursuing reproducibility. It deconstructs from confirming higher-timeframe trends to entries, profit-taking, and stop-loss. Let’s aim to improve practical ability through ongoing follow-up!
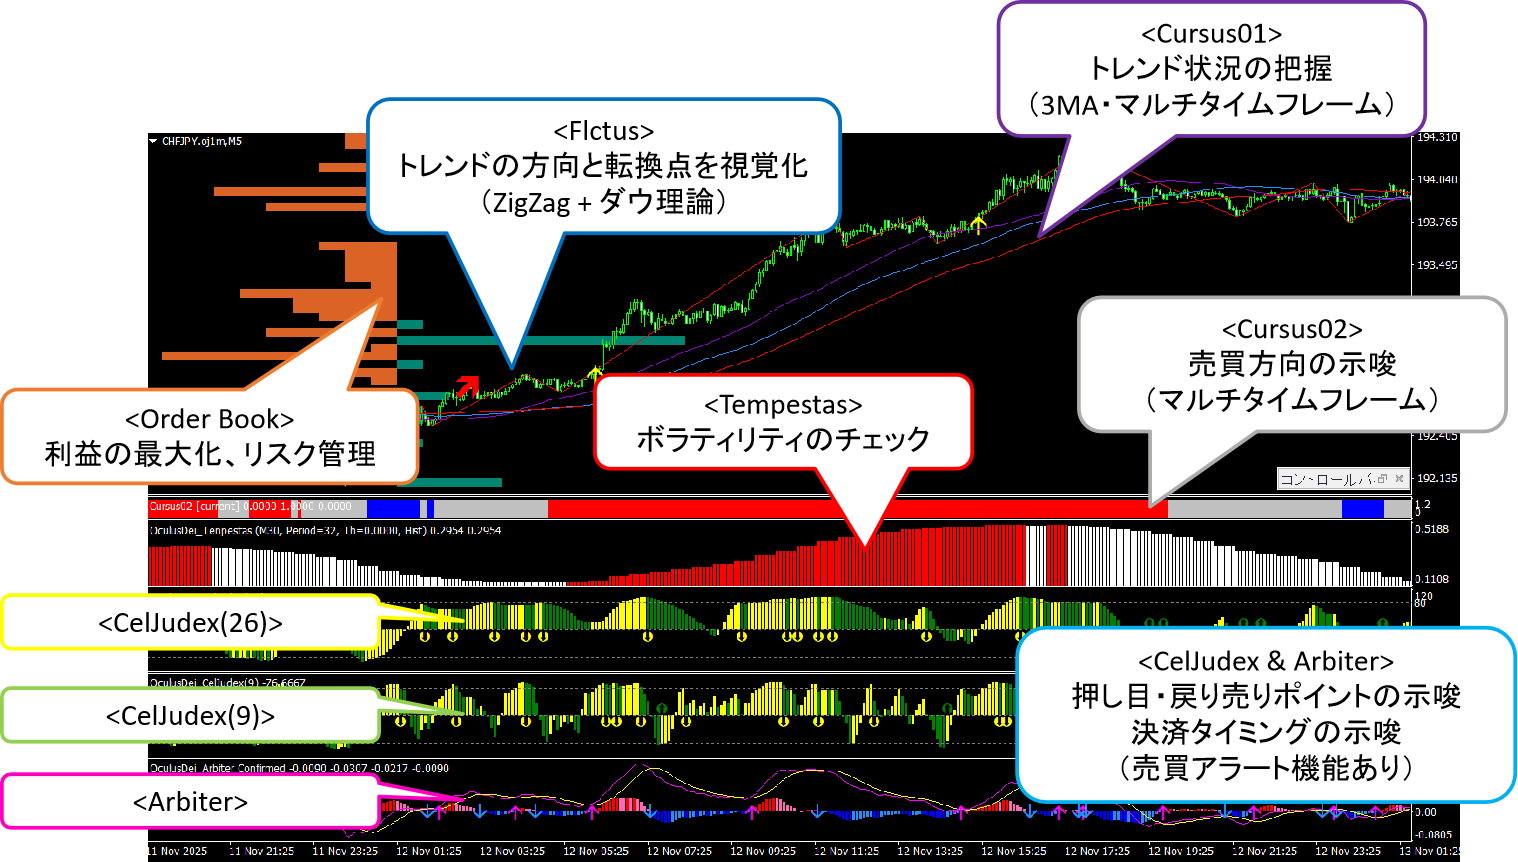
CelJudex(26):Excellent at capturing deeper pullbacks. On the other hand, there are moments when the reaction is slightly slow.
CelJudex(9):In strong volatility trending markets, pullbacks are easier to capture. There are relatively frequent opportunities to catch bottoms, but there can also be noise. Be mindful of reducing noise by combining with market context.
Arbiter:Low noise and accurate indication of reversal points. However, the reaction is slow. Also, by looking at the histogram, you can easily observe the temporal expansion and contraction of the two lines. It is also easy to use as a guide for taking profits, not just for entries.
Stop lossEssentially uses the most recent highs/lows, support/resistance lines, and moving averages.
1/23 Dollar-Yen point整理
Afternoon ~ around 16:00
Dollar/Yen begins a sharp drop from the 158 handle, with rapid yen strength.
With rate checks and intervention observations as background, a yen-buying bias persists.
NY close (evening to night)
Prices fall to the mid-155s by close. Intervention observations may have provided support.
Now, we’ll check the charts right away.
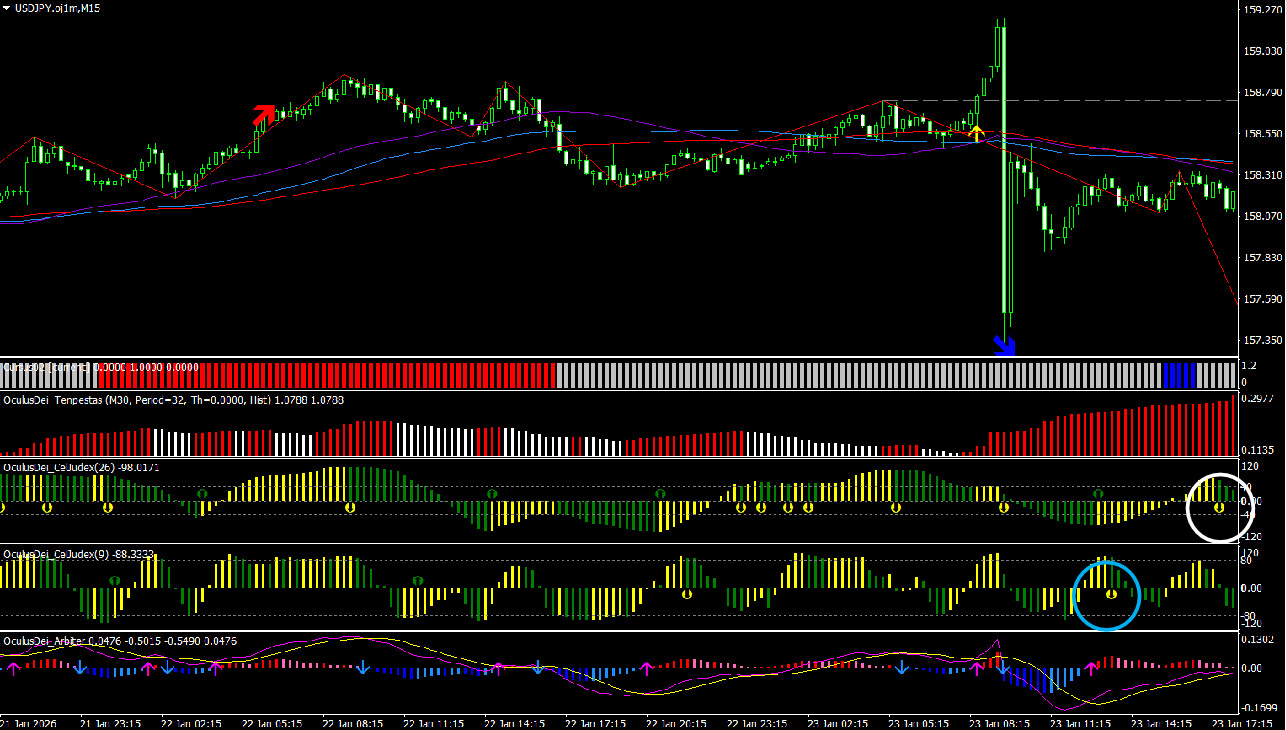
2026/1/23 Dollar/Yen, chart applying the Tenkogan indicator to a 15-minute timeframe.
We will check the status of various indicators.
Flcutus:A blue arrow appears, suggesting the start of a downward trend according to Dow Theory as the yen strengthens rapidly.
Cursus01:MA has not fully reacted due to the abrupt change.
Cursus02:A blue histogram indicating a lack of directional clarity is forming, suggesting selling.
Tempestas:Volatility increases with the abrupt change.
CelJudex(26):Sell signal occurs (white circle); not in line with Cursus02 (due to rapid movement), signal near MA.
CelJudex(9):Sell signal occurs (light blue circle); not aligned with Cursus02; slightly divergent from MA, signaling near MA.
Arbiter:No signal, but histogram is trending downward, and line cross is near.
Overview:On the 15-minute chart, Cursus02 lacks directional alignment, but CelJudex(26) shows a sell signal near the MA, so entries could limit stop-loss to small levels and still aim for significant profits given the backdrop. For taking profits, wait and see for a while, or use Arbiter on 1- to 4-hour charts to monitor histogram changes and buy signals; skipping due to order book unreliability during rapid moves.
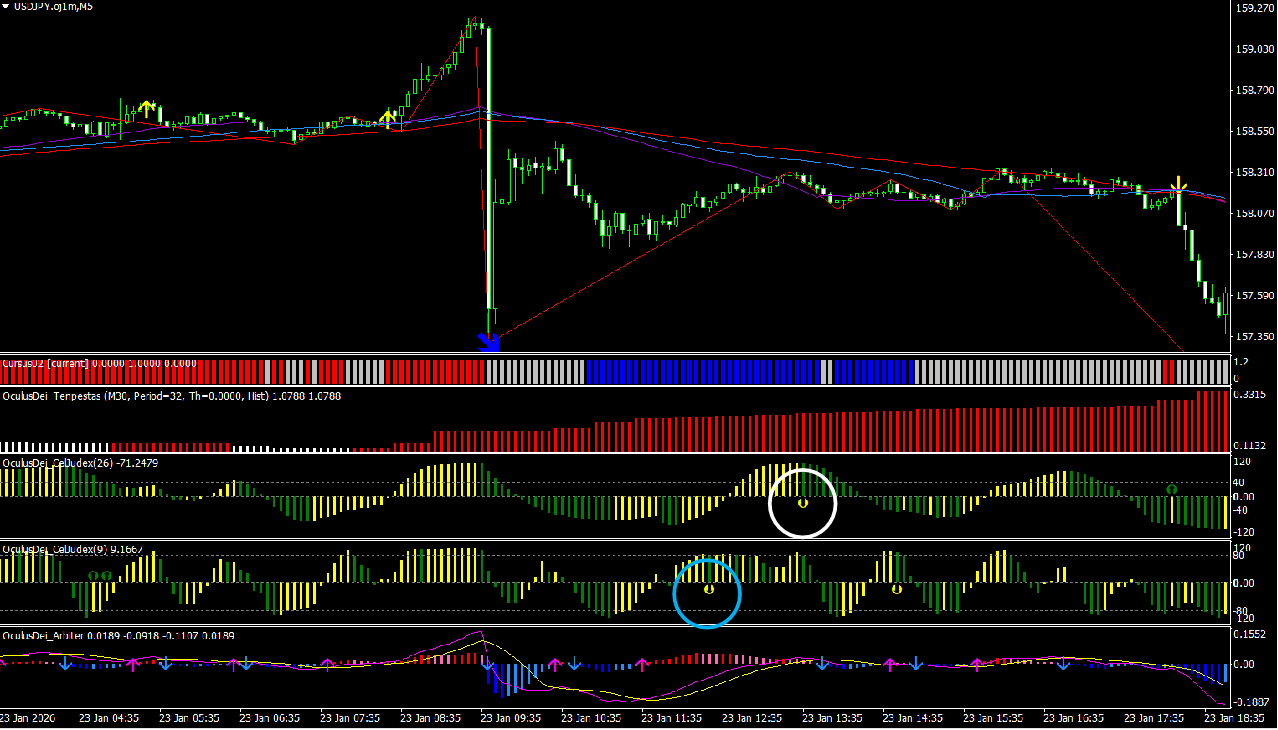
Next, let’s check the 5-minute chart.
Note: CelJudex will soon receive updates with the latest Cursus02 filter and CelJudex(26) filter applied; update planned soon.
Flcutus:A blue arrow appears, suggesting a downward trend based on Dow Theory.
Cursus01:Three moving averages are aligned short-term > medium-term > long-term, indicating a trend state.
Cursus02:There are parts where a blue histogram indicating selling appears.
Tempestas:Volatility increases with rapid movement
CelJudex(26):Sell signal near the MA.
CelJudex(9):Sell signal with light blue circle; slight deviation from MA; there is room for entry considering rapid movement. If executing, keep stop loss small. If you set a large stop loss here you will lose overall. If the trend extends, you may profit. (9) has many opportunities but also noise. However, in strong trend/volatility markets, this can hit, so with favorable background, keep stop loss small and aggressively seek entries.
Arbiter:Sell signal slightly delayed relative to CelJudex(26).
Overall:On the 5-minute chart, there are clear opportunities for a pullback sell. Since signals are near the MA, place the stop just beyond the MA to keep risk low. This time, profits were extended without hitting stop loss, making it a strong opportunity.
How was it?
There are many points to watch, but by using the higher-timeframe trend as the core and combining with each indicator’s characteristics and rules, it becomes much easier to judge pullback buys.
As you gain experience, you will naturally see patterns like “avoid entries here” and “target profit with small loss near the MA here.”
Solidify the basics with the PDF guide for “Tenkogan Awakening Rank,” and review this practice diary repeatedly to incorporate into your own trading. Regular viewing will build reproducibility!
Currently, a prototype to automate the indicator as an EA is nearly complete, and we are considering free distribution as a review reward (paid after a certain number of reviews). For those who want to master pullbacks/ reversals in FX or CFDs, please check out “Tenkogan Awakening Rank.”Follow my investment navigationto receive the next update♪ You can get useful information about indicators and EAs byfollowing my My Page(Get it here) (*´ω`*)
We welcome reviews, comments, and questions!
Let’s continue refining “only aiming for advantageous situations” in our trading together!