

【Latest FX】Discretionless "Demon Speed AI" Usage - Explained with last week's chart
Good morning.
How are you all doing today?
This is Kiwoku AI Public Relations.
We are grateful that, although only a few days since release, we have already received many inquiries.
Self-praising, but the accuracy is wonderful. It is so good that it can feel a bit creepy.
The way the two indicators are used is so superb that I felt a sense of mission to bring this to the world…
Today, I will explain how to use 'Kiwoku AI'!
I would be grateful if those already using it could take a look for reference.
Kiwoku AI — FAQ
Will it repaint (repaint) the signs?
- Not at all.In the first place, if the sign tool repaints, there is no meaning to it.。
Be careful with sign tools that repaint.
Will it appear in real time?
- Yes. The entry sign appears the moment the candle is confirmed.
How to use the two types of signs?
- Please see the explanation below!
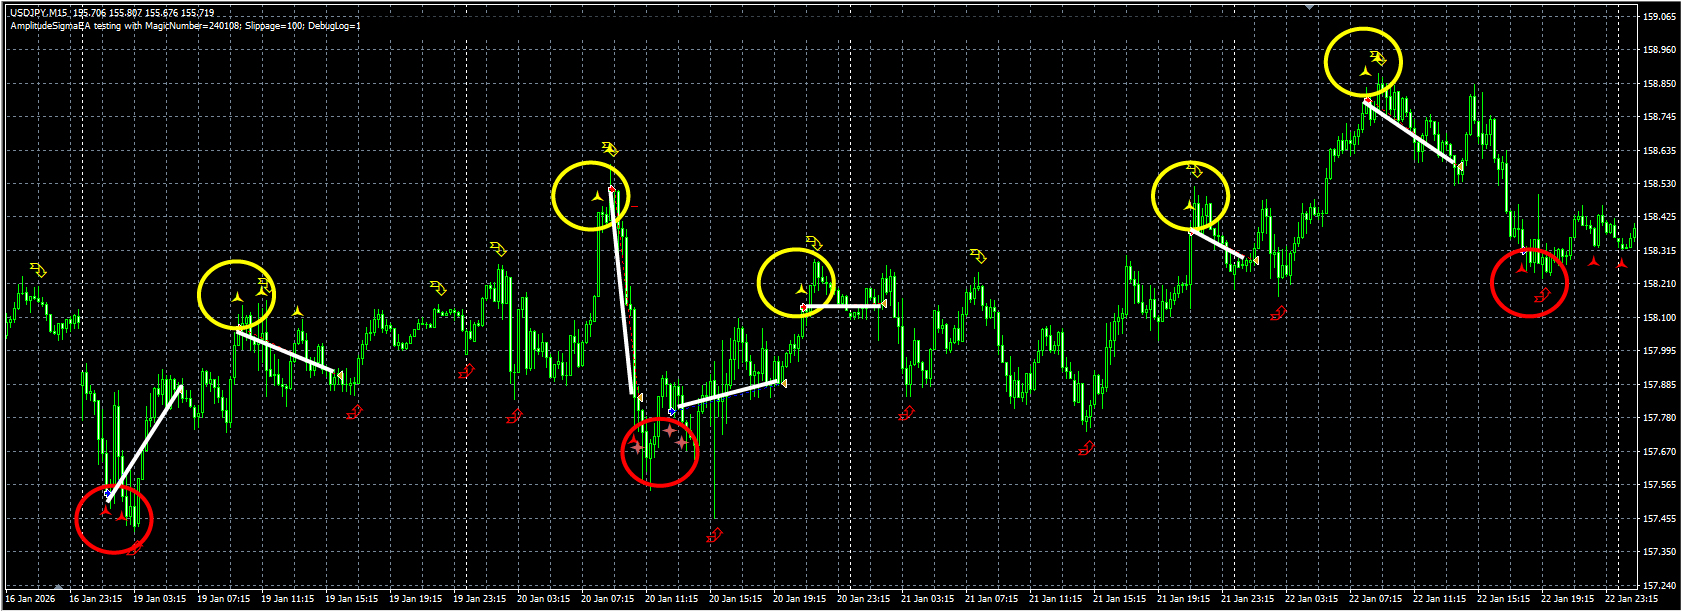
First, let's check the chart signs for 2026/01/19-2026/01/23.
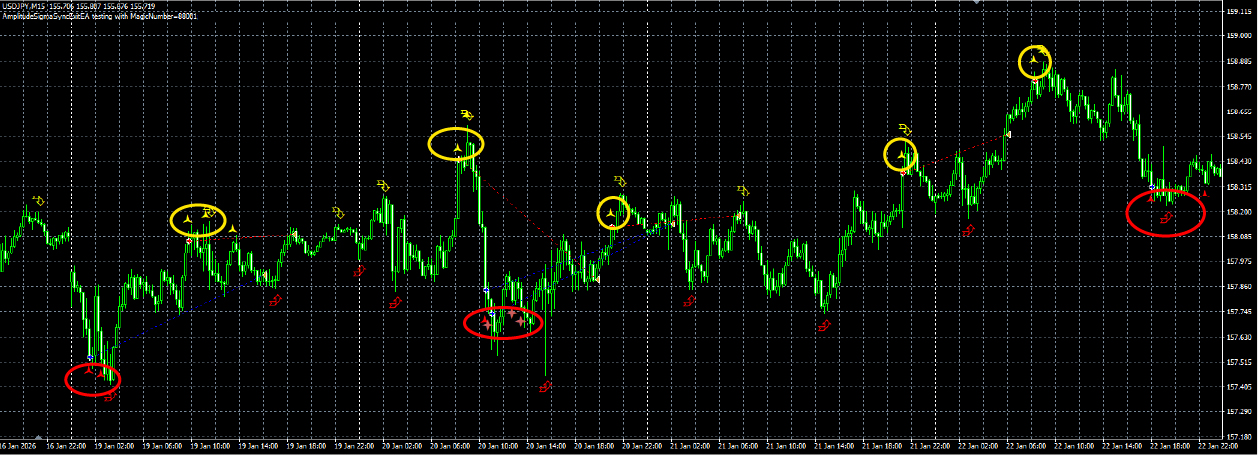
USD/JPY 15-minute chart, 1/19-1/23
The circled items are the “Amplitude” signs (entry signs).
The other arrow is the “Sync” sign.
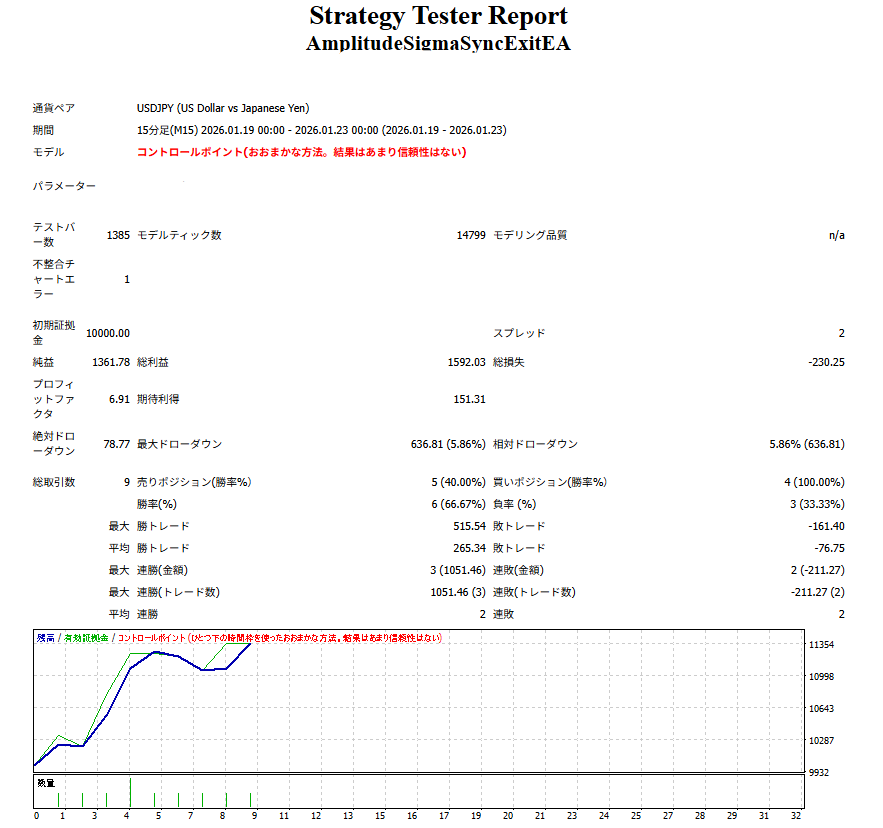
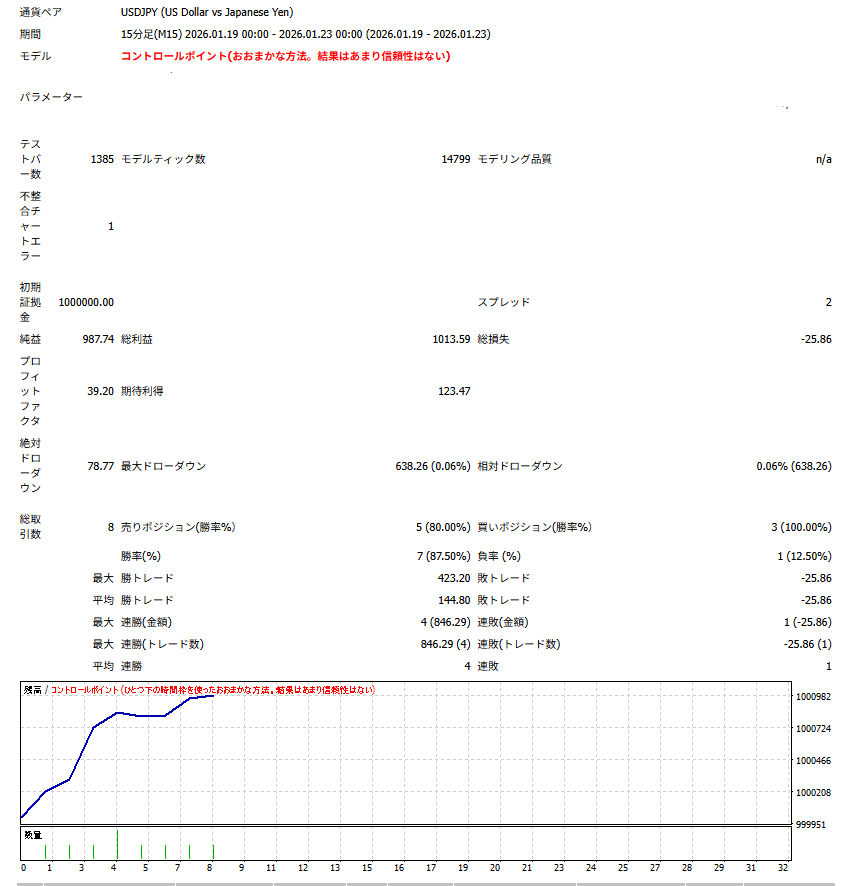
Trading results on the most orthodox pattern (enter with Amplitude sign, take profit with Sync sign)
Last week, even with automated EA trading, it yielded about 200,000 yen in profit.
Also, the number of entries was nine. The win rate is 67%, but the risk of loss is about 30,000 yen and the profit-taking is about 230,000 yen, giving a very favorable risk-reward ratio!
1: Trade using only Amplitude signs
Honestly, I do not recommend it. However, it is profitable.
It may be profitable, but the reason not to recommend it long-term is that
・You don’t know when the opposite sign will appear, so you might close a position without waiting for the sign
・You miss profits once you’ve ridden them
If you choose this method
・Use a trailing stop
・Use a break-even stop
・Apply discretion to stop losses
Then, you need to devise
However, since clear rules are needed for stops, a rule like “stops are discretionary” is NG.
But,if you just do it normally, you can win.
Many sign tools adopt this approach, but the downside is
・Entry and exit happen at the same timing
as a drawback.
In markets, you cannot predict the future.
That’s why,you should enter in high-probability moments and exit when you feel riskis important.
Having only one type of sign is a bad example of not spreading risk.
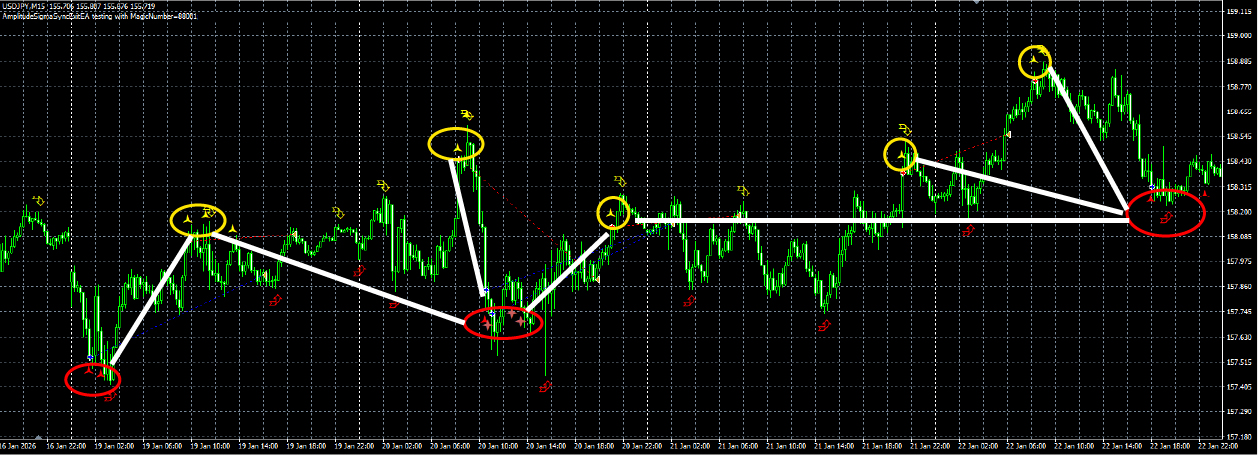
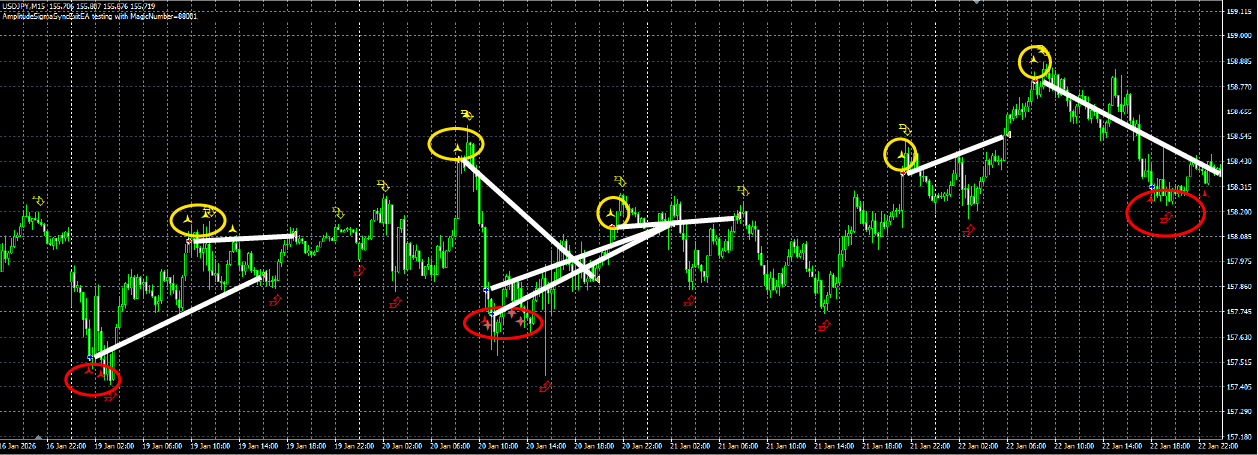
2: Enter with Amplitude sign, exit at Sync sign confirmation (recommended)
This image shows the actual entry marked by the EA.
In other words, this is real trading.
The chart at the beginning is also using this method.
At the exit point, a reverse Sync sign is confirmed.
Sync sign indicates that a bottom or top has been confirmed at that time.
Advantages of this method
・Clear stops and profits
・Profits without discretion
Enter with Amplitude signs and exit when the Sync sign is confirmed—a simple, straightforward rule.
By separating entry and exit logic, unnecessary entries are reduced and profits are reliably secured.
Use entry in high-probability moments and exit when risk is felt
Combining these two approaches enables stable trading.
3: Using trailing stops and breakeven stops in combination (win rate 87.50%)
This is a technique recommended for intermediate or higher levels, combining breakeven stops, trailing stops, and limit-profit targets.
If you are not a full-time trader or using EA, trailing stops are difficult.
What has changed
・Position-holding time is shorter
・Profit margins become more stable
・Win rate increases
By securing profits once you ride them, you can trade without losing.
The most important point in trading is to “not lose.”
If you don’t lose, you can win.
However, since fine-tuning is needed, focus on trading when you can.
First, build funds with method ②, then move to method ③.
Finally, backtest results for the past three months on the 15-minute chart (from Oct last year to now) for method ②
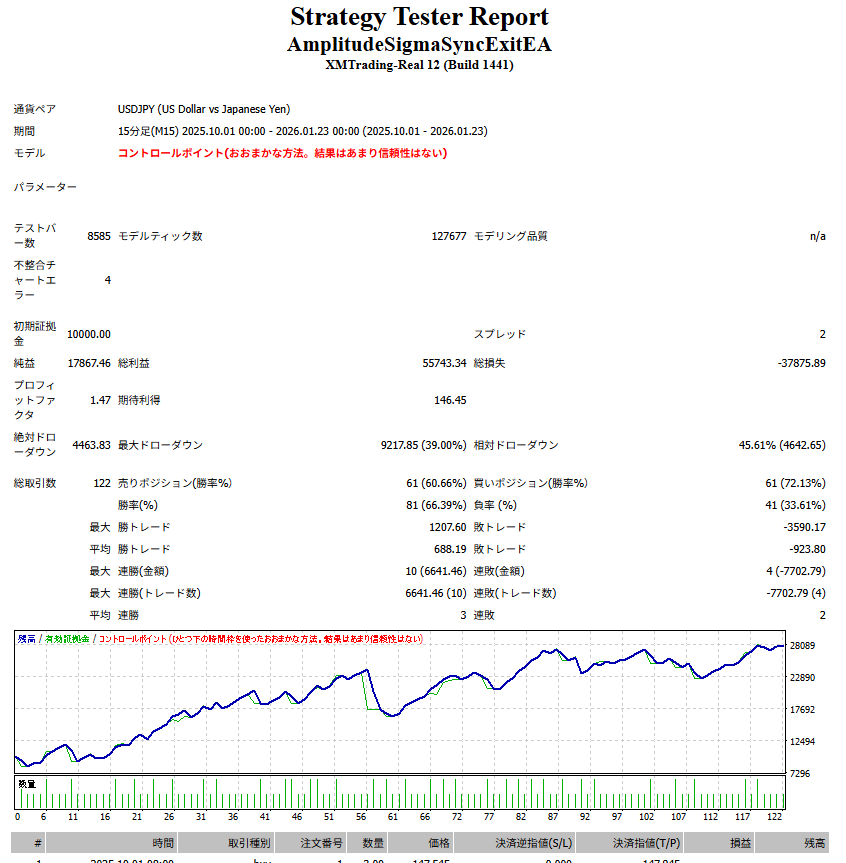
$10,000 → $28,000
If you increase the lot size, you can earn a bit more, but very high leverage is not recommended.
【Kiwoku AI】A sign tool that AI continues to revalidate
https://www.gogojungle.co.jp/tools/indicators/74667
Purchasing is available from the link above
Summary
How was it?
Today we explained how to use Kiwoku AI using an actual USD/JPY 15-minute chart.
We sincerely wish you all success!