

Heavenly Eye Awakening Record Practical Diary #1 Nikkei 225 Futures Bought at the Bottom of the Decline!
0
This series is a diary that uses the Tengen Eye Awakening Rook indicator in daily markets, pursuing reproducibility. It breaks down everything from higher-timeframe trend confirmation to entries and profit-taking/stop losses. Let's aim to improve practical skills through continuous follow-up!
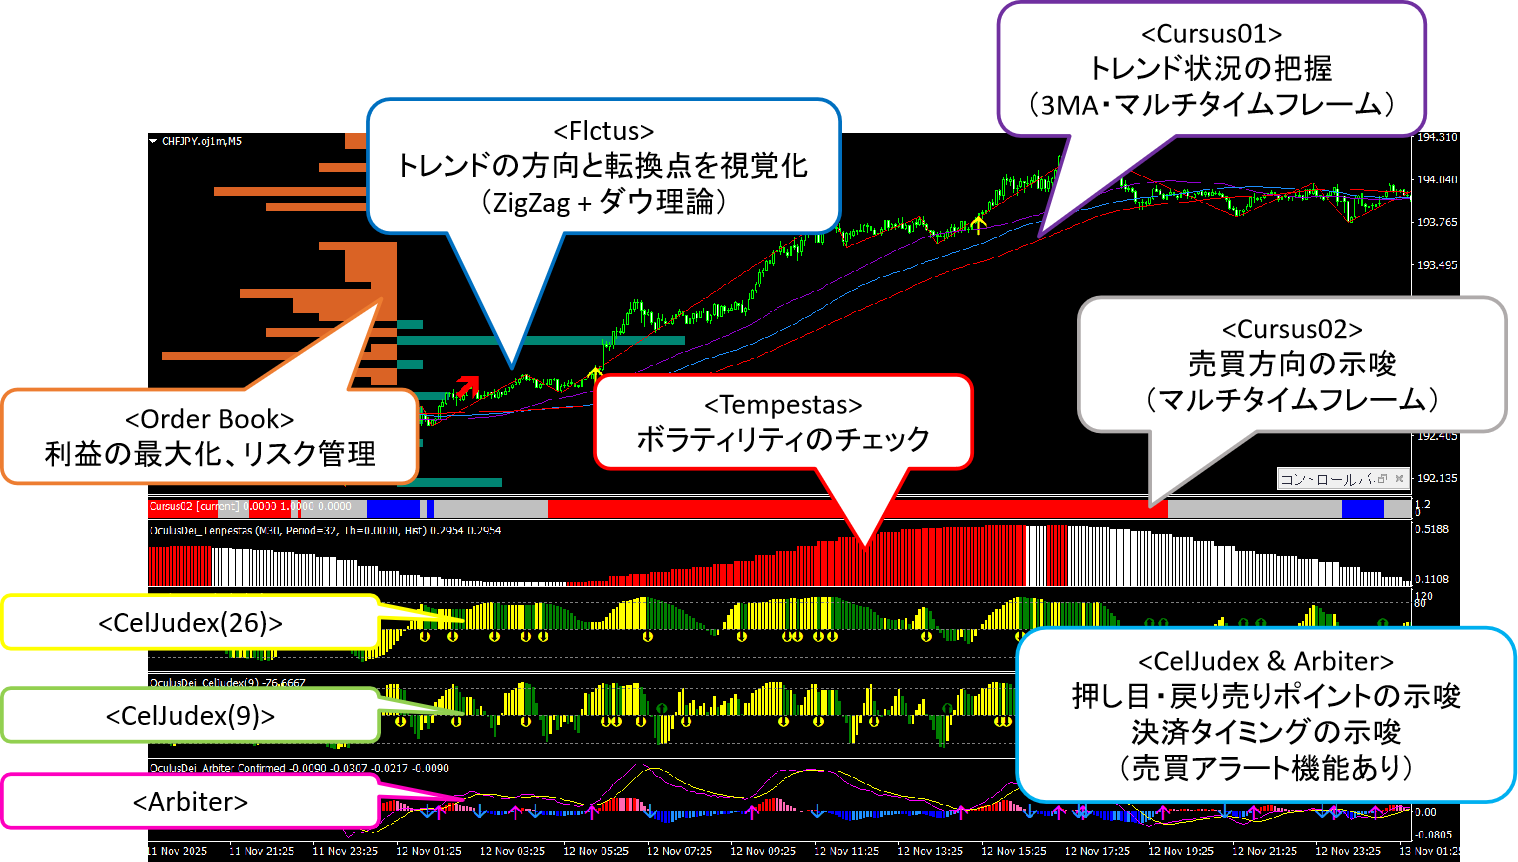
CelJudex(26):Excellent at catching deeper pullbacks. On the other hand, there are moments when the reaction is slightly slow.
CelJudex(9):In volatile trending markets, it is easy to catch pullbacks. There are occasions where it catches the bottom, but there can also be noise. Be mindful of reducing noise by aligning with market awareness.
Arbiter:Low noise and accurately signals reversal points. However, its reaction is slow. Also, by looking at the histogram, it is easy to observe the time-based widening and narrowing of the two lines. It is also useful as a guide for profit-taking besides entry.
Stop lossis basically based on recent highs/lows, resistance/support lines, and moving averages (MA).
Now, let's check the chart right away.
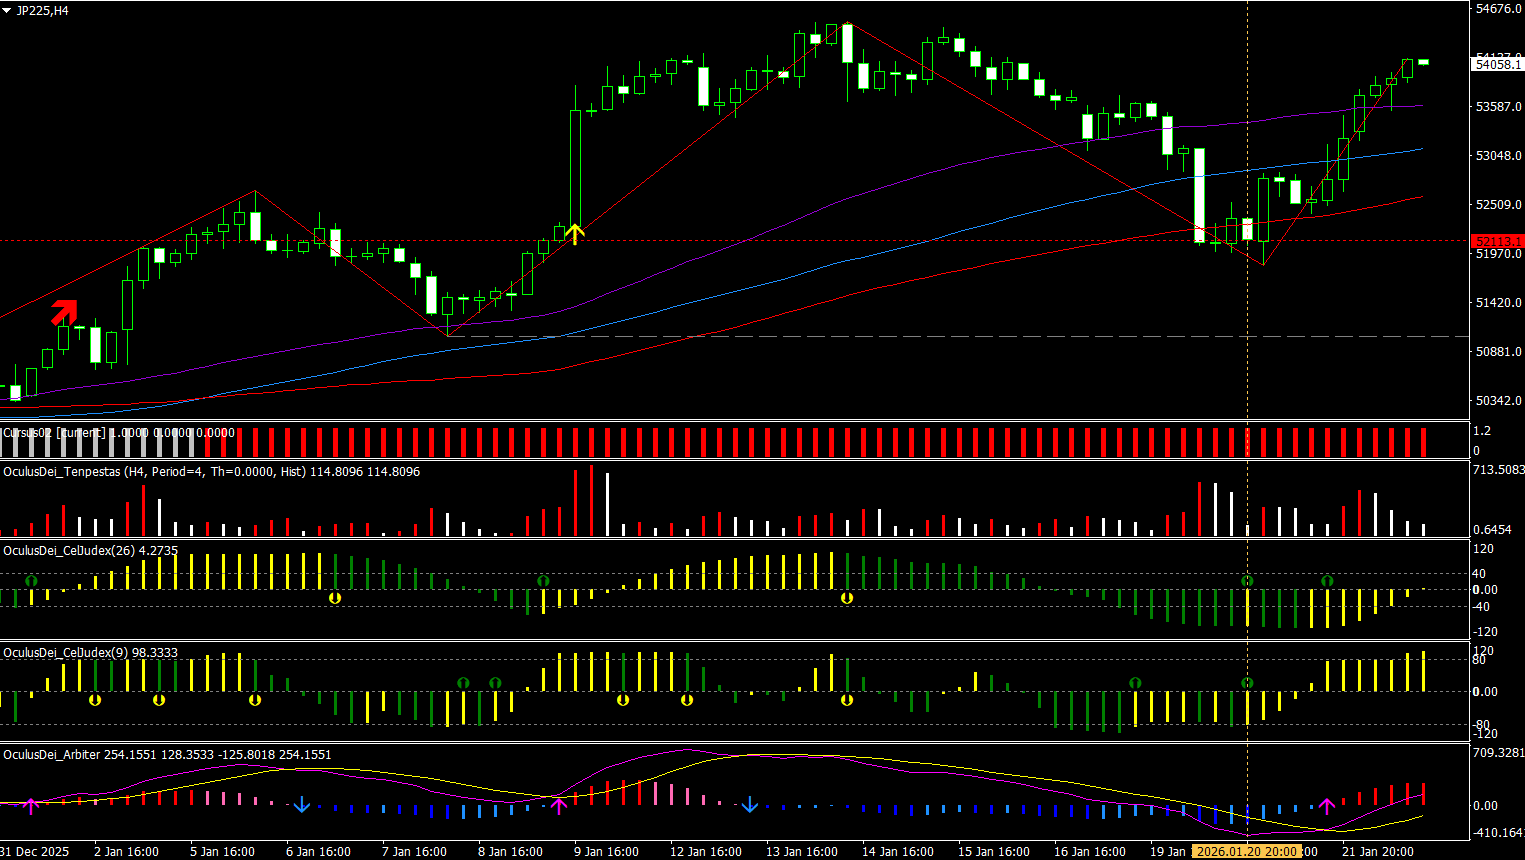
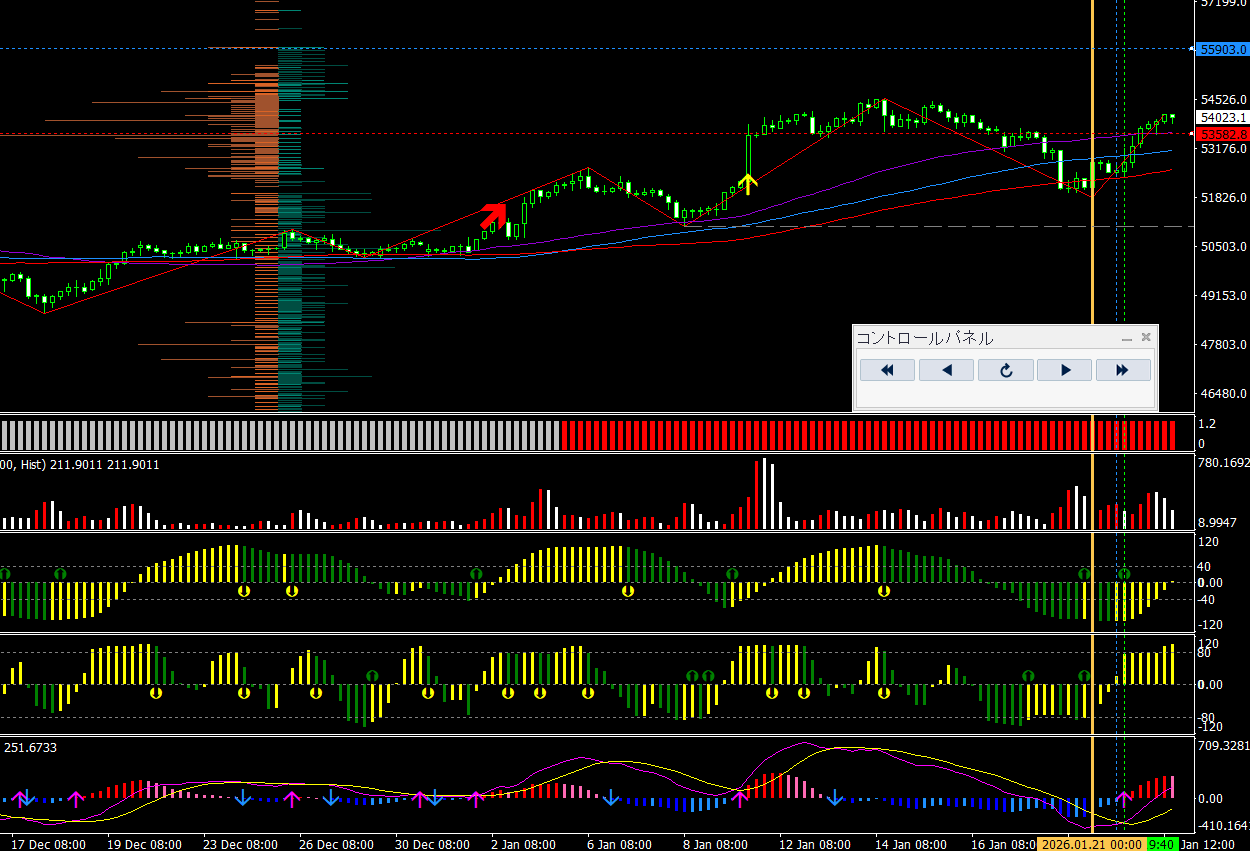
2026/1/22 Nikkei 225, chart with the Tengen Eye indicator applied on the 4-hour timeframe.
We will check the state of various indicators.
Flcutus:Updating highs and lows cleanly
Cursus01:Three MAs align short > mid > long, suggesting a trending state
Cursus02:Signals a buying direction
Tempestas:At the point indicated by the yellow dotted line, volatility is sufficientlydecreased. Note: differs from the point of increasing volatility on sub-5-minute timeframes. Details are described in the product PDF under the “Long-term Trade Strategy Guide.”
CelJudex(26):A buy signal is generated at the point indicated by the yellow dashed line. Since signals are confirmed on the candle close (no repaint), you can enter at the opening price of the next candle after the signal appears (this time it was near the bottom with a pullback-buy).
CelJudex(9):A buy signal appeared earlier than the point indicated by the yellow dashed line, but according to the method’s rules, it is an invalid signal (see “Short-term Foot Trading Strategy Guide.” Pay particular attention on short-term timeframes). On mid-to-long-term timeframes, you may consider entries ignoring this rule (the deviation from 50 MA is small), but you should ensure profits are adequately secured and set a shallower stop loss (be mindful of high risk-reward).
Arbiter:A buy signal appears after the yellow line, with earlier judgment possible from histogram changes.
Other:Note that buy/sell signals occur near the MA. By selecting signals that occur near the MA, you can keep stop losses shallow while maximizing profits, enabling naturally risk-on/profit-off trading (currently developing an indicator showing the relationship between MA and signals, and adding as a filter to EA).
Overall:From the 4-hour long-term perspective, entries are possible.
Pullbacks are being bought, but CelJudex(26) is a counter-trend entry, while Arbiter is a trend-following entry, which could be a deciding point.
For profit-taking, leveraging Arbiter’s changes on the 4-hour timeframe seems likely to significantly extend profits based on the existing trend.
Next, let’s look at the 15-minute chart.
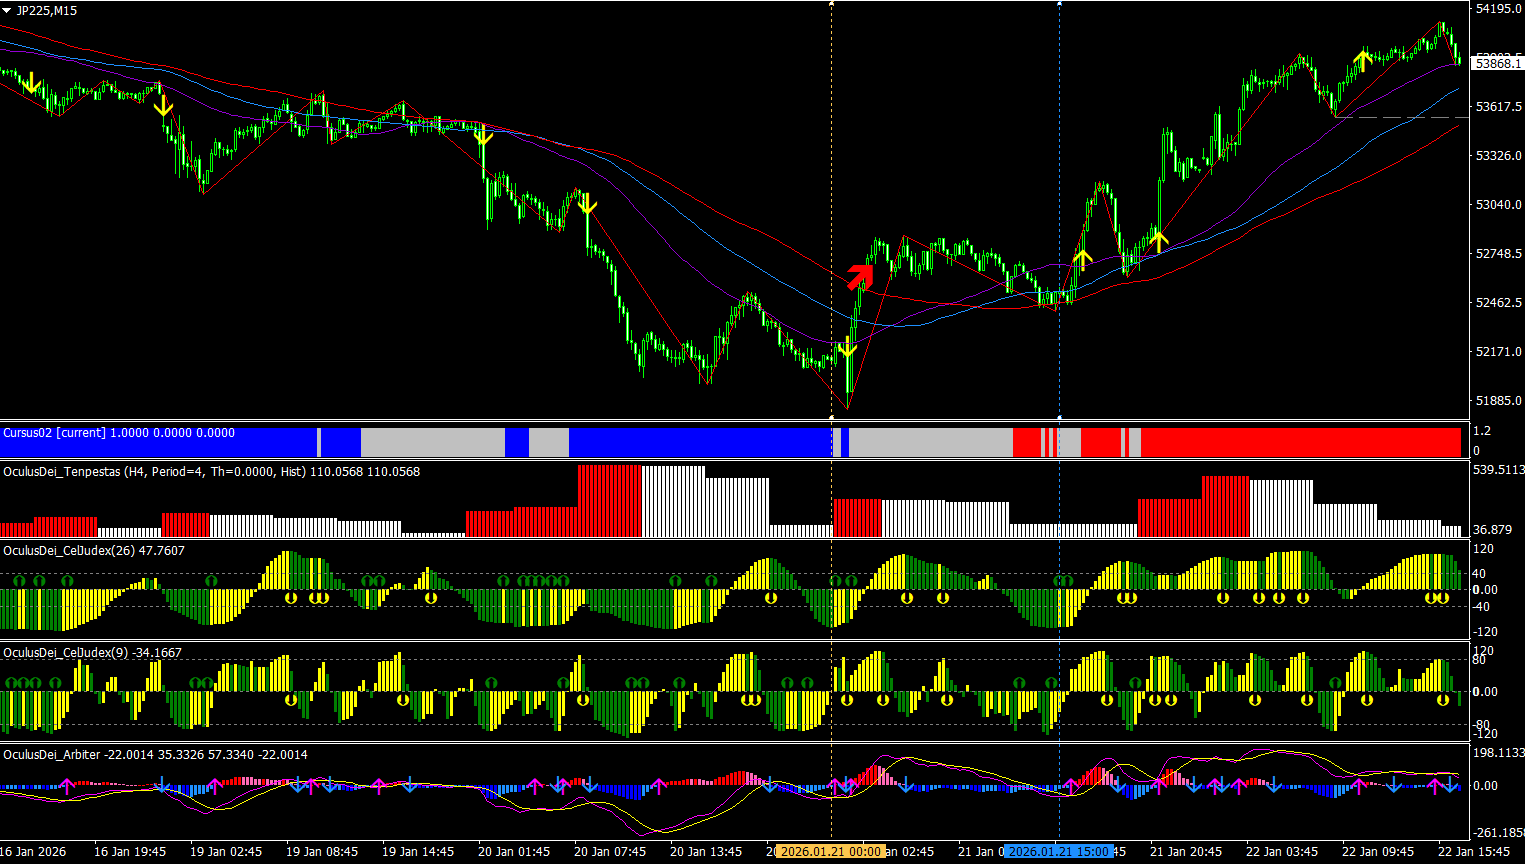
Yellow dashed line: the point where a buy signal occurred and was confirmed on the 4-hour timeframe for CelJudex(26)
Light blue dashed line: the point to read a buy signal on the 15-minute timeframe
Flcutus:Red arrows appear, indicating a Dow Theory-based shift to a rising trend.
Cursus01:Three MAs align short > mid > long, suggesting a trending state
Cursus02:Implies a lack of clear direction, shown in a gray zone.
Tempestas:Volatility is sufficientlydecreased at the light blue line. Note: differs from the short-term 5-minute timeframe where volatility is expected to rise. It is also acceptable on the 15-minute timeframe to have a rising pattern.
CelJudex(26):Buy signal generated at the point indicated by the light blue line (on the 15-minute timeframe, also near the bottom with a pullback-buy).
CelJudex(9):Although a buy signal appeared earlier than the point indicated by the light blue line, it is an invalid signal per the method’s rules (see “Short-term Foot Trading Strategy Guide.” Especially on short-term timeframes). If you ignore this rule and enter, ensure profits are adequately secured and set a shallow stop loss (be mindful of high risk-reward).
Arbiter:A buy signal appears after the light blue line. Early judgment can be considered from histogram changes.
Other:Also note that buy/sell signals occur near the MA on the 15-minute timeframe.
Overall:Compared to the 4-hour chart, the 15-minute chart shows a trend reversal confirmed by Flcutus, and buying on pullbacks near the MA with a favorable trend-following approach is excellent. One concern is that Cursus02 entered a slightly gray area.
This time, let's also check the 5-minute timeframe.
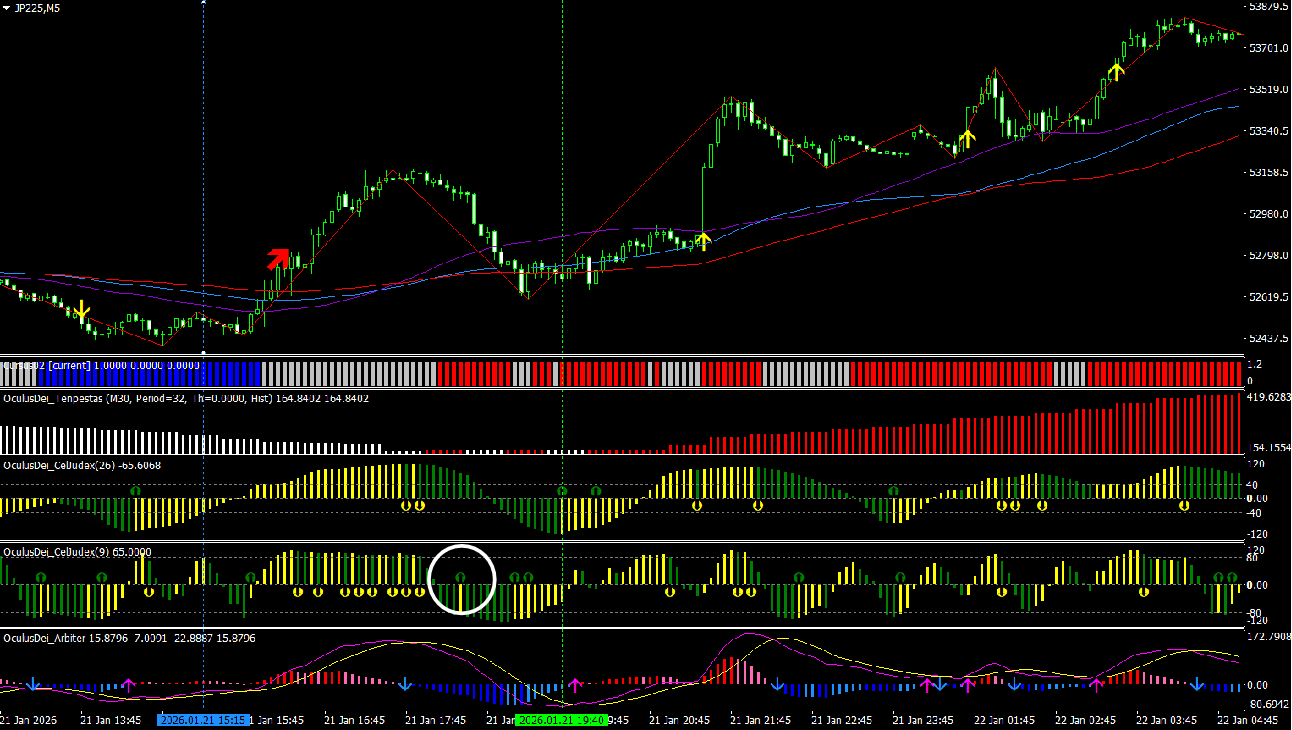
Light blue dashed line: points where a valid buy signal on the 15-minute timeframe was triggered and confirmed
Green dashed line: points where a valid buy signal on the 5-minute timeframe can be read
Flcutus:Red arrows appear, indicating a Dow Theory-based shift to an uptrend.
Cursus01:When the buy signal lights up, the three MAs align short > mid > long, suggesting a trending state
Cursus02:When the buy signal lights up, it suggests buying direction.
Tempestas:If the green dashed line indicates rising volatility, it can be judged as valid. Note: it may appear as if there is no momentum in white, but understanding multi-time-frame specifications allows judgment (see the “Short-Term Foot Trading Strategy Guide / Multi-Time Frame Points”). Of course, you may also wait for solid volatility in the latter part.
CelJudex(26):Buy signal generated at the point indicated by the green dashed line (pullback-buy near the bottom on the 5-minute chart as well).
CelJudex(9):Before the point indicated by the green dashed line, a buy signal shown with a white circle is considered valid per rules. However, it is far from the currently set MA, so the advantage is low. If entered, set a small stop loss. When momentum is present, a small stop can still lead to a large rise. A larger stop increases the chance of overall losses, so maintain a strong focus on risk-controlled, reward-favorable trading.
Arbiter:A buy signal appears after the light blue line. Early judgment can be considered from histogram changes.
Other:Also note that there are valid trading signals near the MA on the 5-minute timeframe.
Overall:The bottoming pullback buying setup is clean, but the time is late at night, and it is unclear whether volatility will expand after entry. I believe that higher-timeframe analysis and fundamentals support such subtle decision-making. With this 5-minute timeframe, entry decisions should be possible if you keep the higher timeframes in mind.
Finally, let’s briefly check the Order Book. For CFDs like Nikkei futures, the absolute order amount is small, so this is only a rough reference.
There are many sell orders at the line indicated by the red dashed line, apparently aligning with a resistance/support line. When such orders are broken through, price movement tends to follow (note that order characteristics may not apply to other currencies). Also, there are stop-loss orders up to the line indicated by the blue dashed line, which could act as fuel for moves. However, CFDs' order status changes over time, so it is clearer to take profits first using recent highs, resistance/support lines, and Arbiter changes.
How was it?
There are many points to watch, but by using the higher-timeframe trend as a base and combining the characteristics and rules of each indicator, it becomes much easier to judge pullback buys.
As you become more experienced, patterns like “don’t enter here, avoid” and “near MA signals for small stops with big profits” will naturally appear.
Solidify the basics with the PDF guide of “Tengen Eye Awakening Rook,” then review this practical diary repeatedly to apply it to your trading. Regular review will reliably build reproducibility!
Currently, a prototype to convert the indicators into an EA is nearly complete, and we are considering free distribution as a review incentive (paid after a certain number of reviews). If you want to master pullbacks/retracements in FX or CFDs, please check out “Tengen Eye Awakening Rook.”Follow my investment guidanceto receive the next update. You can get valuable information about indicators and EAs by followingmy personal page(*´ω`*)
We welcome reviews, comments, and questions!
Let’s sharpen a trading approach that targets only advantageous situations together!
× ![]()