NHadou Trade History_ Domestic Individual Stocks_1965
We will post the trade history by NHadou.
【Subject】
Domestic stock 1965 Techno HiwA Co., Ltd.
【Assumptions】
The investment target is weekly Japanese individual stocks.
Tolerance for loss is 100,000 yen.
【Result】
Profit of 149,683 yenwas realized.
【Trade History】
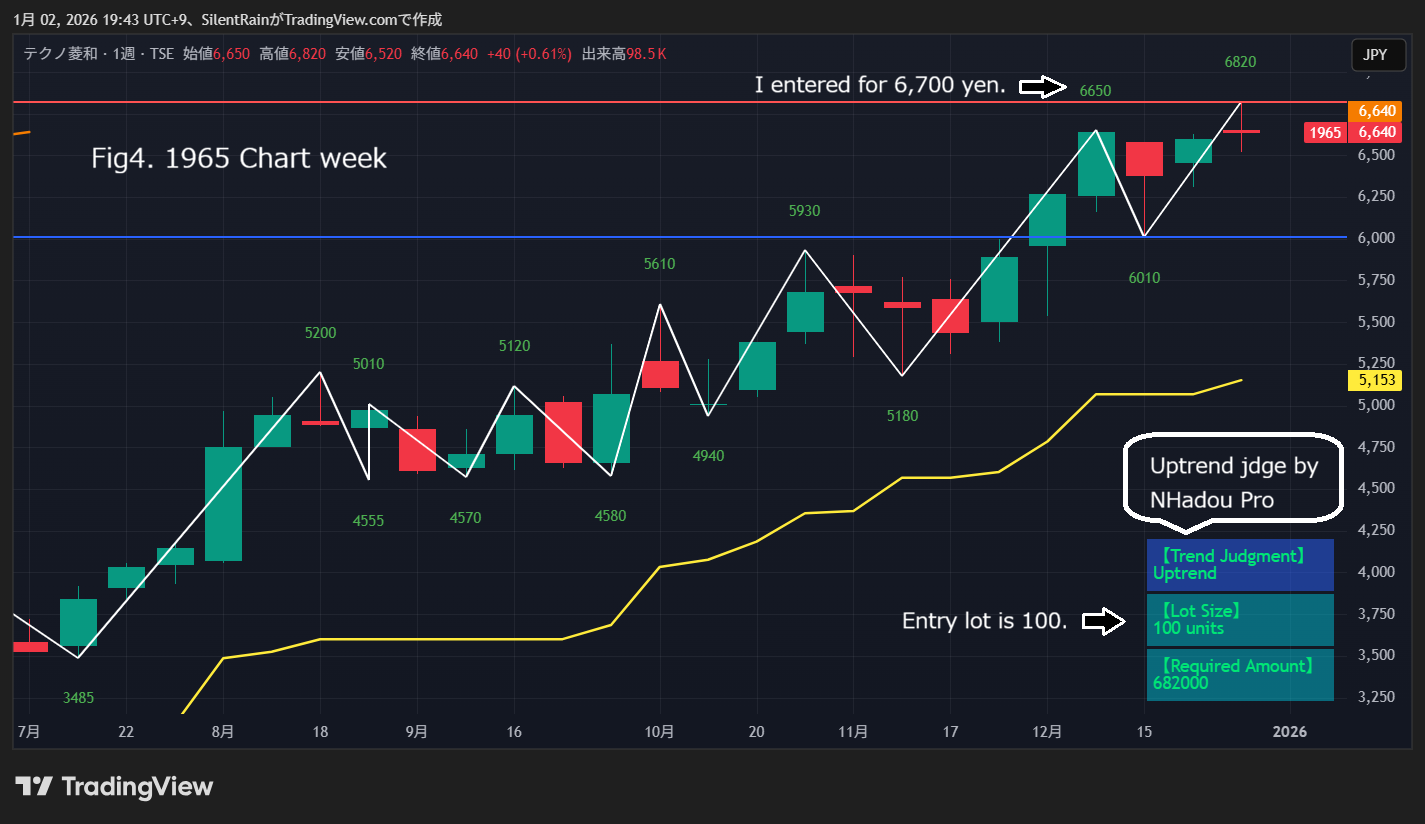
1. Entry (2026/01/04)
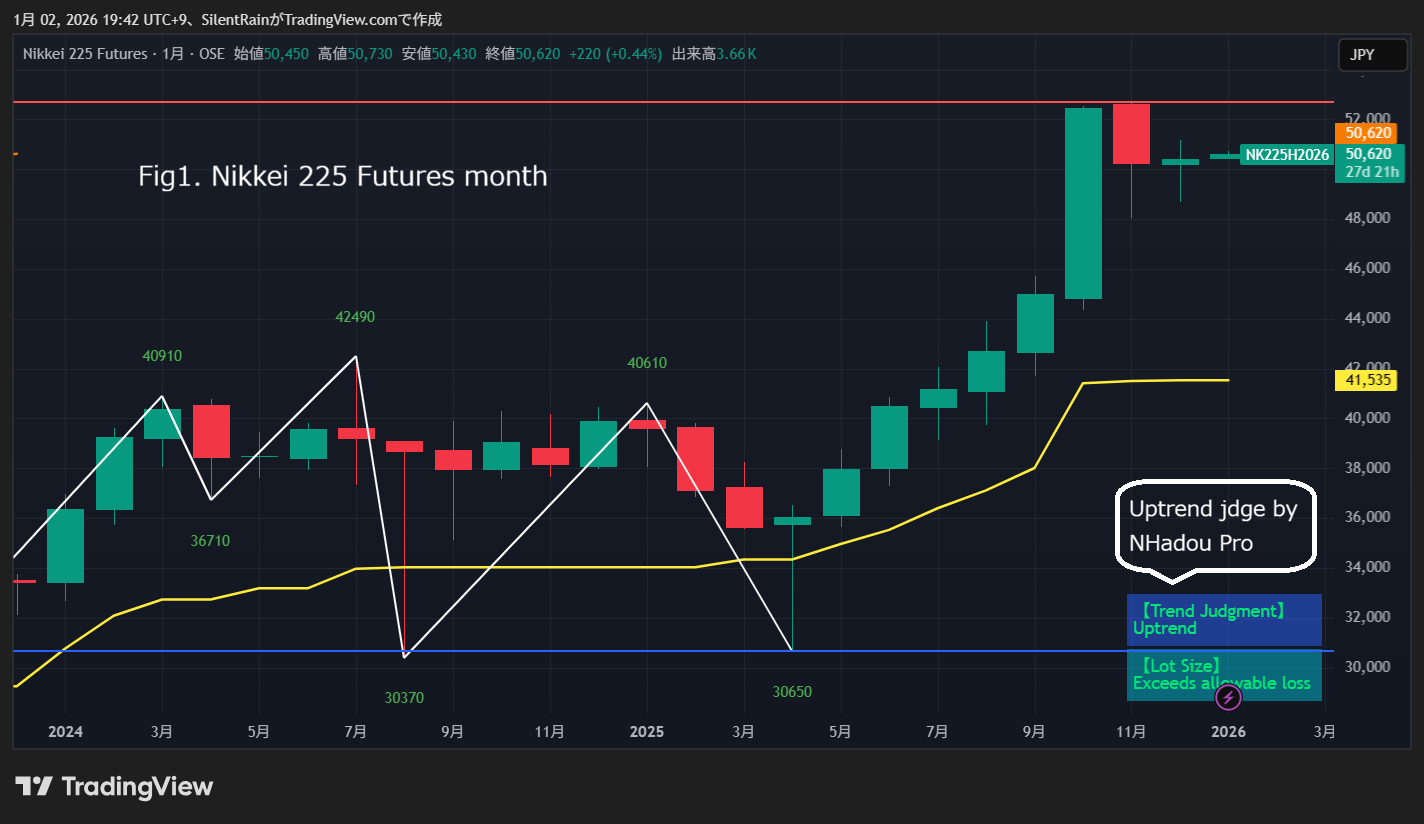
① From Fig1, the Nikkei futures monthly chart forms an uptrend.
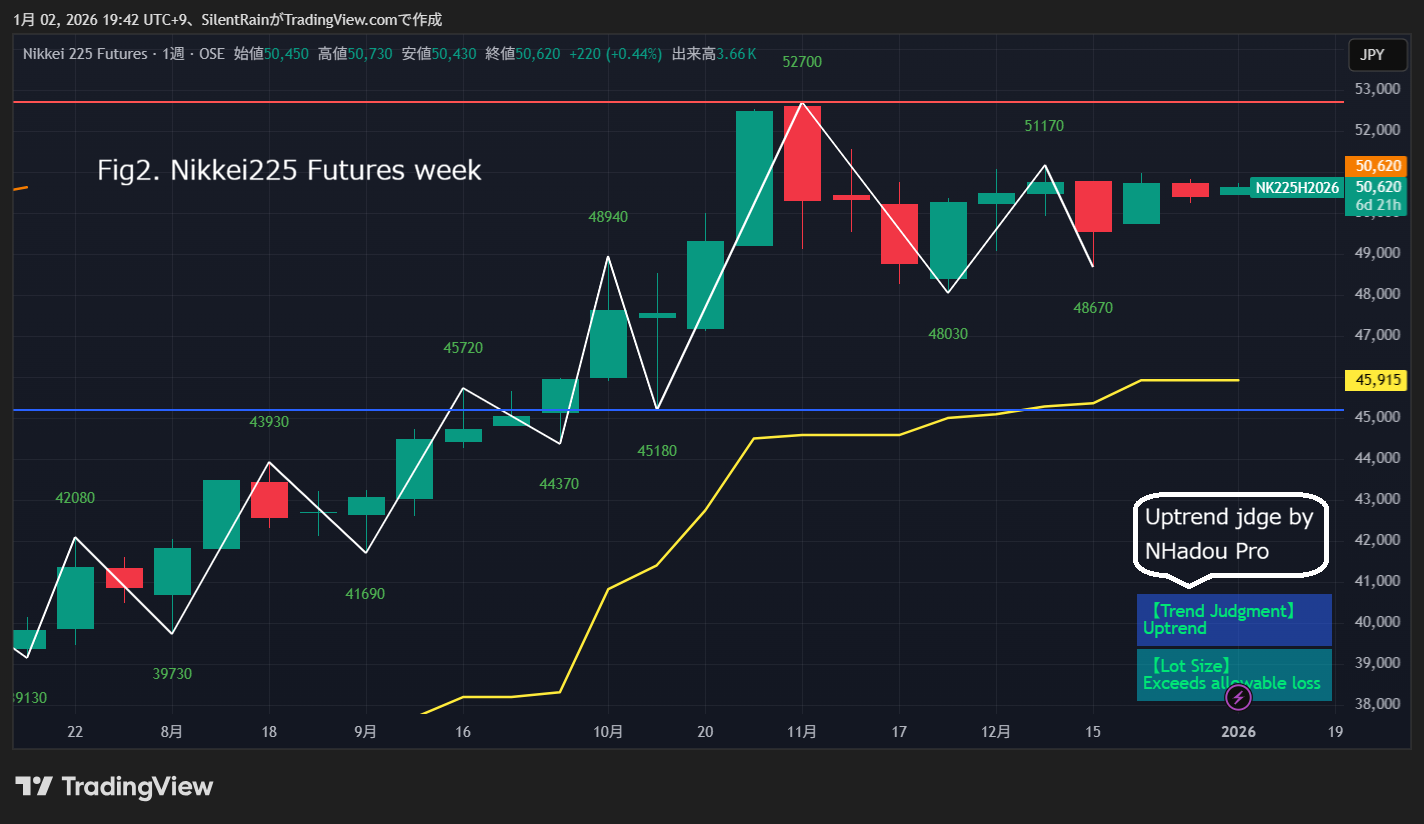
② From Fig2, the Nikkei futures weekly chart forms an uptrend.
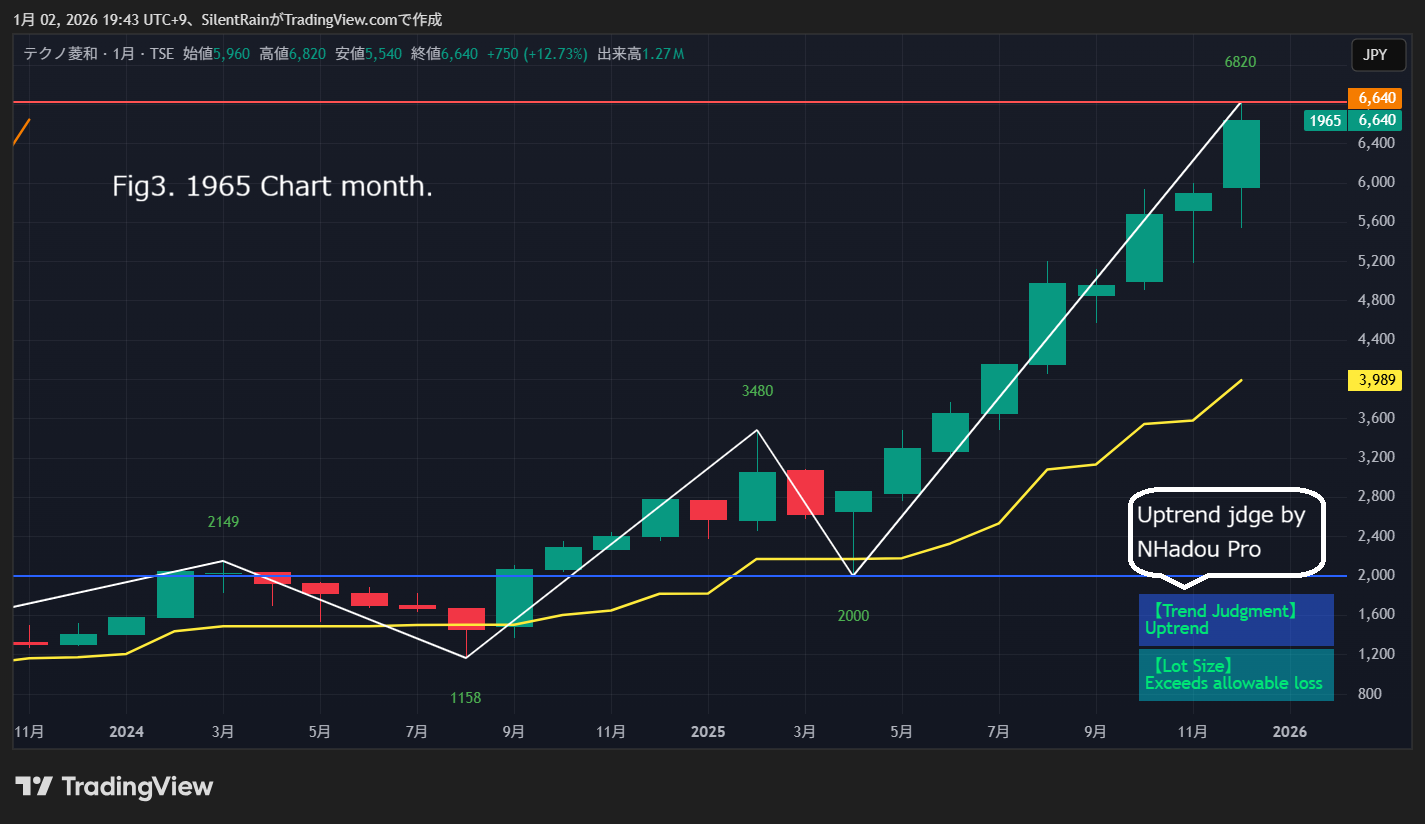
③ From Fig3, the individual stock 1965 monthly chart forms an uptrend
④ From Fig4, the individual stock 1965 weekly chart forms an uptrend

From ① and ②, Nikkei futures show an uptrend on both monthly and weekly charts,
and from ③ and ④, the target stock shows an uptrend,
therefore, we entered at NHadou's 6650+ bid, at 6700 yen, with a lot size of 100.
2. Profit Taking (2026/01/21)
Profit taking is based on the following common criteria.
① Parabolic SAR turns to sell on the weekly chart
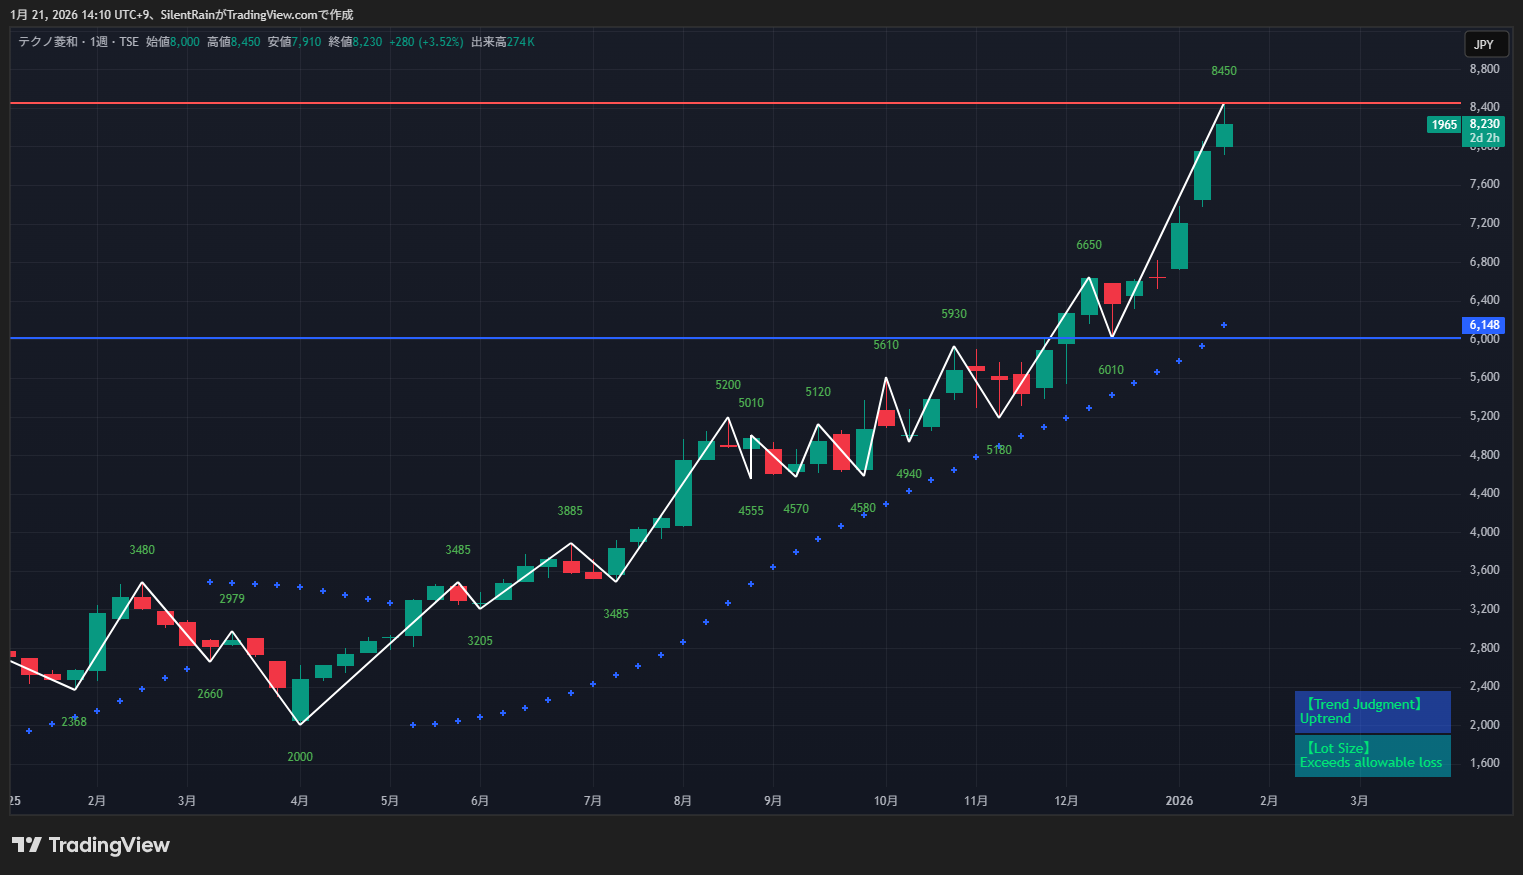
② When profit reaches 1.5 times the tolerance for loss
This time, criterion ② applied, so profits were taken.
Coincidentally, we had good trades since the beginning of the year.
When introducing NHadou, although simple, from the amount of tolerance for loss you set and the number of units
① Entry point based on a refined Dow Theory
② Entry lot size
③ Required investment amount
can all be understood on one screen.
Also, whether on monthly, weekly, daily, or other timeframes, chart drawing is evaluated for each candlestick, so there is no need to change settings.