

【Verification result】 GBP/JPY moved 192 pips | Most recent trade where the 4-hour × 5-minute EA functioned
① Fundamentals: Can temporary adjustment phases become opportunities?
In the forex market since last week, both USD/JPY and the cross yen pairs are in a phase wheretemporary pullback sellingtends to occur from high levels.
Although the overall yen depreciation trend has not been fully negated, with officials’ statements and market caution in the background, in the short termthe price tends to have difficulty moving higherbecoming less favorable for chasing gainsand thus the market environment isto some extent.
In such an environment,
-
rather than aiming for a trend reversal,
-
it isshort-term selling rallies that follow the correction trend
tends to be an effective strategy.
In particular,
setting risk to a lower level and restricting entries to situations with clear technical justifications makes aggressive selling options quite conceivablecan be seen in this scenario.
※This is a short-term perspective strategy and should be separated from mid- to long-term directional views.
② Technical: Advantage of pullback selling viewed on 4-hour x 5-minute charts
Technically,we employ a pullback selling strategy that combines 4-hour environment recognition with 5-minute execution.
Specifically,
-
4-hourCelJudex(26)sell signal, or Arbiter’sdeath crossas a market environment cue
-
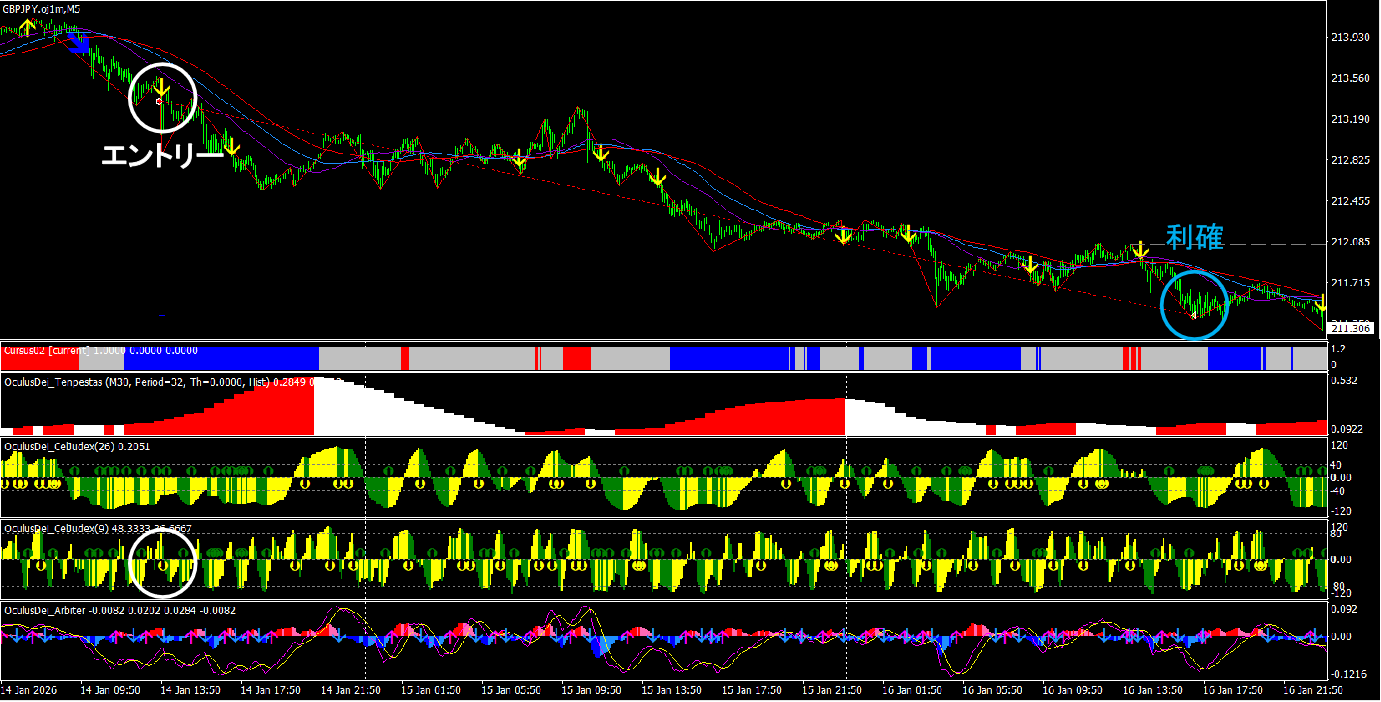
Set EA on the 5-minute chart under that environment
-
When volatility and a trend occur, the pullback selling is automatically triggered
This is the flow.
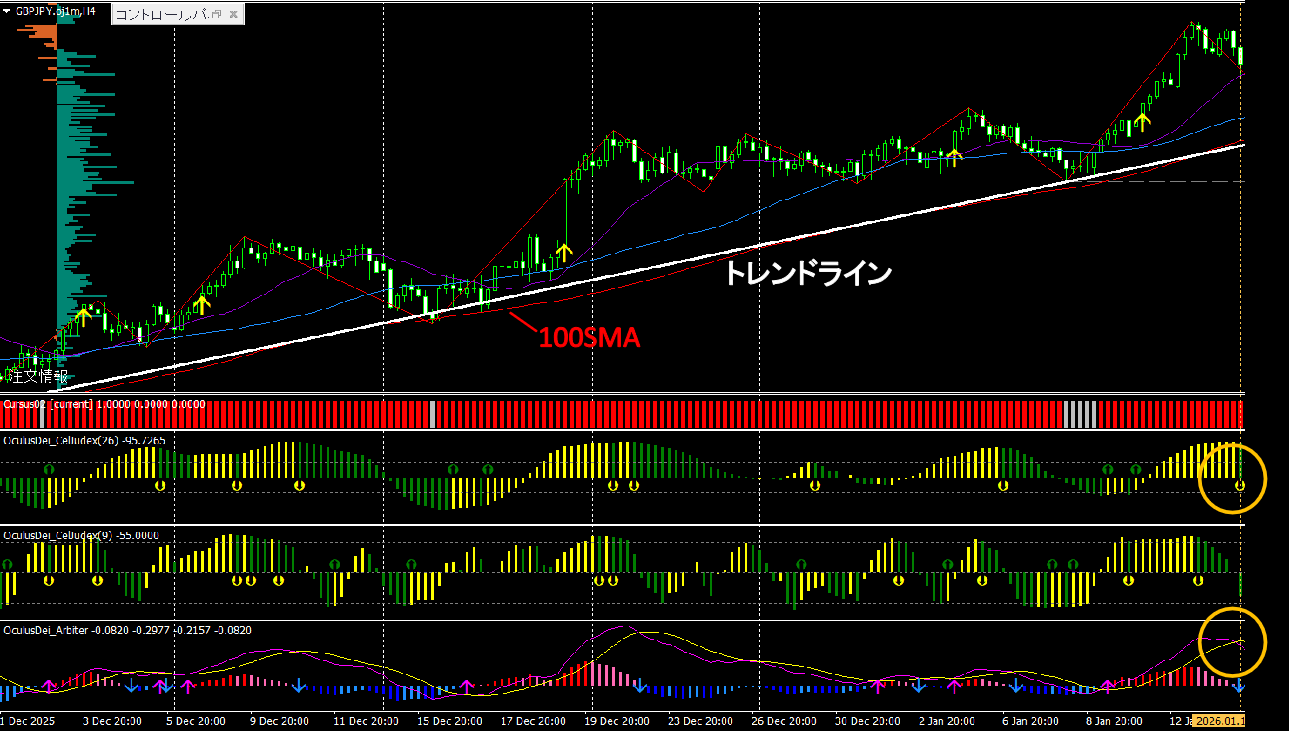
As for taking profits,we consider the 100 MA on the 4-hour chart as a level that has repeatedly been respected in the past, and exit around touching the 100 MA.
Thus,
-
define the direction and exit target on the higher time frame,
-
and time the entry on the lower time frame
whichhelps maintain a high risk-reward ratio while reducing unnecessary entries and aiming for price movement.
【Actual EA behavior】

For the EA settings,
with 1,000,000 yen as capital, risk at 3% compounded, automatic nearest-highs + α stop loss, and including Cursus02 and Tempestas filters.As a result, +192 pips, +162,608 yen, RR 6.3.
【Tips】 About the Order Book
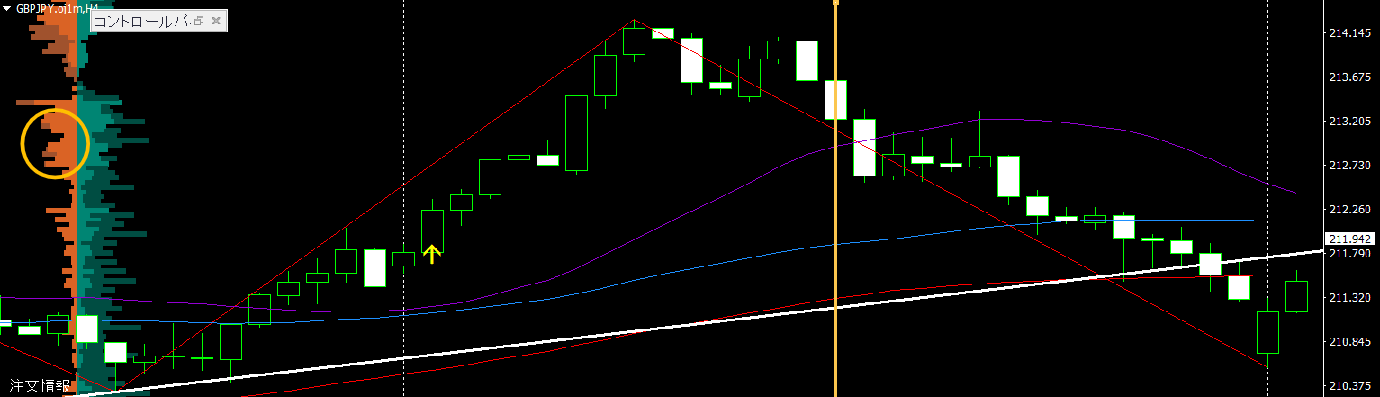
Check the order book at the time of entry (a tip is to also review a bit before entry).
As indicated by the yellow circle, there are often thick stop orders, and afterward there can be a large gap with no stop orders remaining.
This suggests that consuming stops may cause price stagnation.
(Be aware that in some currencies or around data releases, orders may not function as expected)
Therefore, there may be cases where the price reverses from the same level, requiring consideration of retreat (mild stop loss or closing at breakeven, etc.).
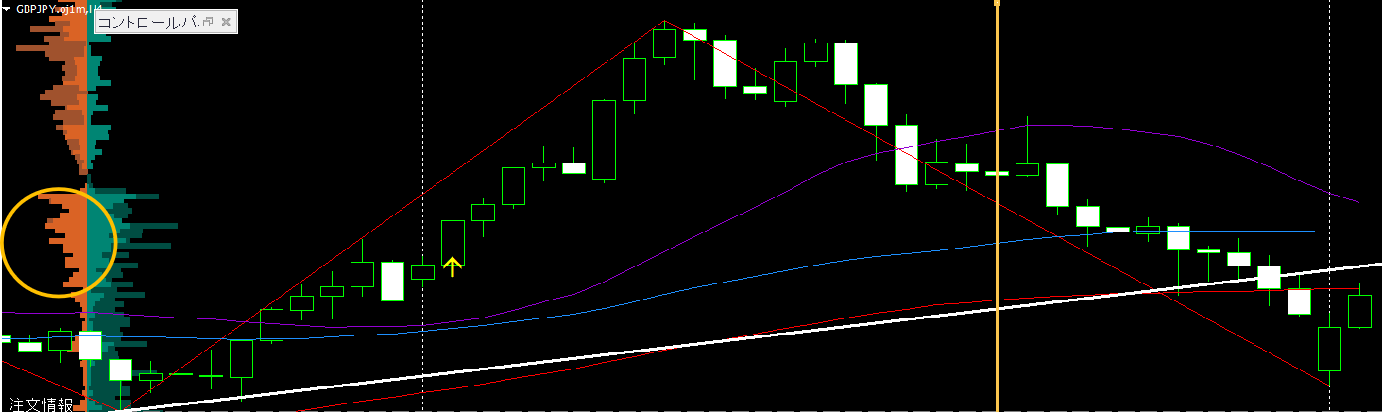
Later, when checking the stagnation area again, you’ll see that stop orders occur near the trendline and around the 100 MA. If you break through this stagnation, you can target profit-taking near the 100 MA as originally planned (in subsequent moves, you may see long lower shadows near where the stops were consumed).
Cautions
- “Stops exist = will break through” is not guaranteed
- The Order Book is an auxiliary element aligned with technical analysis
Please keep this in mind.
What we introduced this time is not a case of
“leaving everything to the EA” nor “completely discretionary,”
but an operational example built on clear technical rules used together.
In the future, we plan to share
-
EA setting examples
-
adjustments by market environment
-
verification of trade results
-
a viewpoint centered on the Tenkan Indicator
and more in due course.
If you would like to view the market from the same perspective, or are interested in practical uses of EAs and indicators, please follow and check it out.
■ The Tenkan series visualizes the market’s “waves”
As with this trade,
“where do pullbacks or retracements tend to occur”
“whether current price movement has volatility riding on it”
Just being able to judge this can dramatically increase high-expected-entry opportunities.
The Tenkan indicator series
shows trend strength
temporary acceleration
propensity for price moves
likelihood of reversal points
These kinds of “basis of judgment” are clearly laid out on the chart, which makes it easier to ride the waves even in today’s market conditions
without hesitation.
“When the market moves, jump on quickly.”
“Conversely, if it doesn’t move, don’t enter.”
This discipline is a truly significant strength for short-term traders.
▶ Why it is suitable for those who want to stabilize trade quality
High reproducibility of entry points
Alerts notify you even when you’re not glued to the screen
Easy to decide not to trade when volatility is low
Less likely to miss the moment to ride a wave
After reading this article,
you may think, “I want to enter at this timing, but I’m actually hesitating…”.
For those people, this approach is especially compatible.