

Reading FX through the Tri-Parity of Three Currencies — Turning Everyday “Distortions” into Profit with TriParity Analysis, Episode 5: What it looks like when you drop three-currency parity onto a chart — Visualizing Distortion Lines and the “Leading Leg”
Episode 5: The distortion is visible. The next confusion is "which pair to build (trade) with."
Complete visualization of the Distortion line and the "Leading leg" — the final piece to make the decision in one action
Up to Episode 4, we have viewed the triangle's distortion asZ (Distortion Line)and reached a point where we can see it. However, once Z is visible, you will inevitably wonder this:
"I understand the distortion.
But… there are three charts.
Ultimately, which pair should I buy/sell?
This final hesitation is what Episode 5 addresses. The content here is also explained with diagrams in the YouTube video below.
Product page:
- Z (Distortion Line) = when to enter
- Leading leg = which pair to build on
By overlaying these two, make the judgment intoone action.
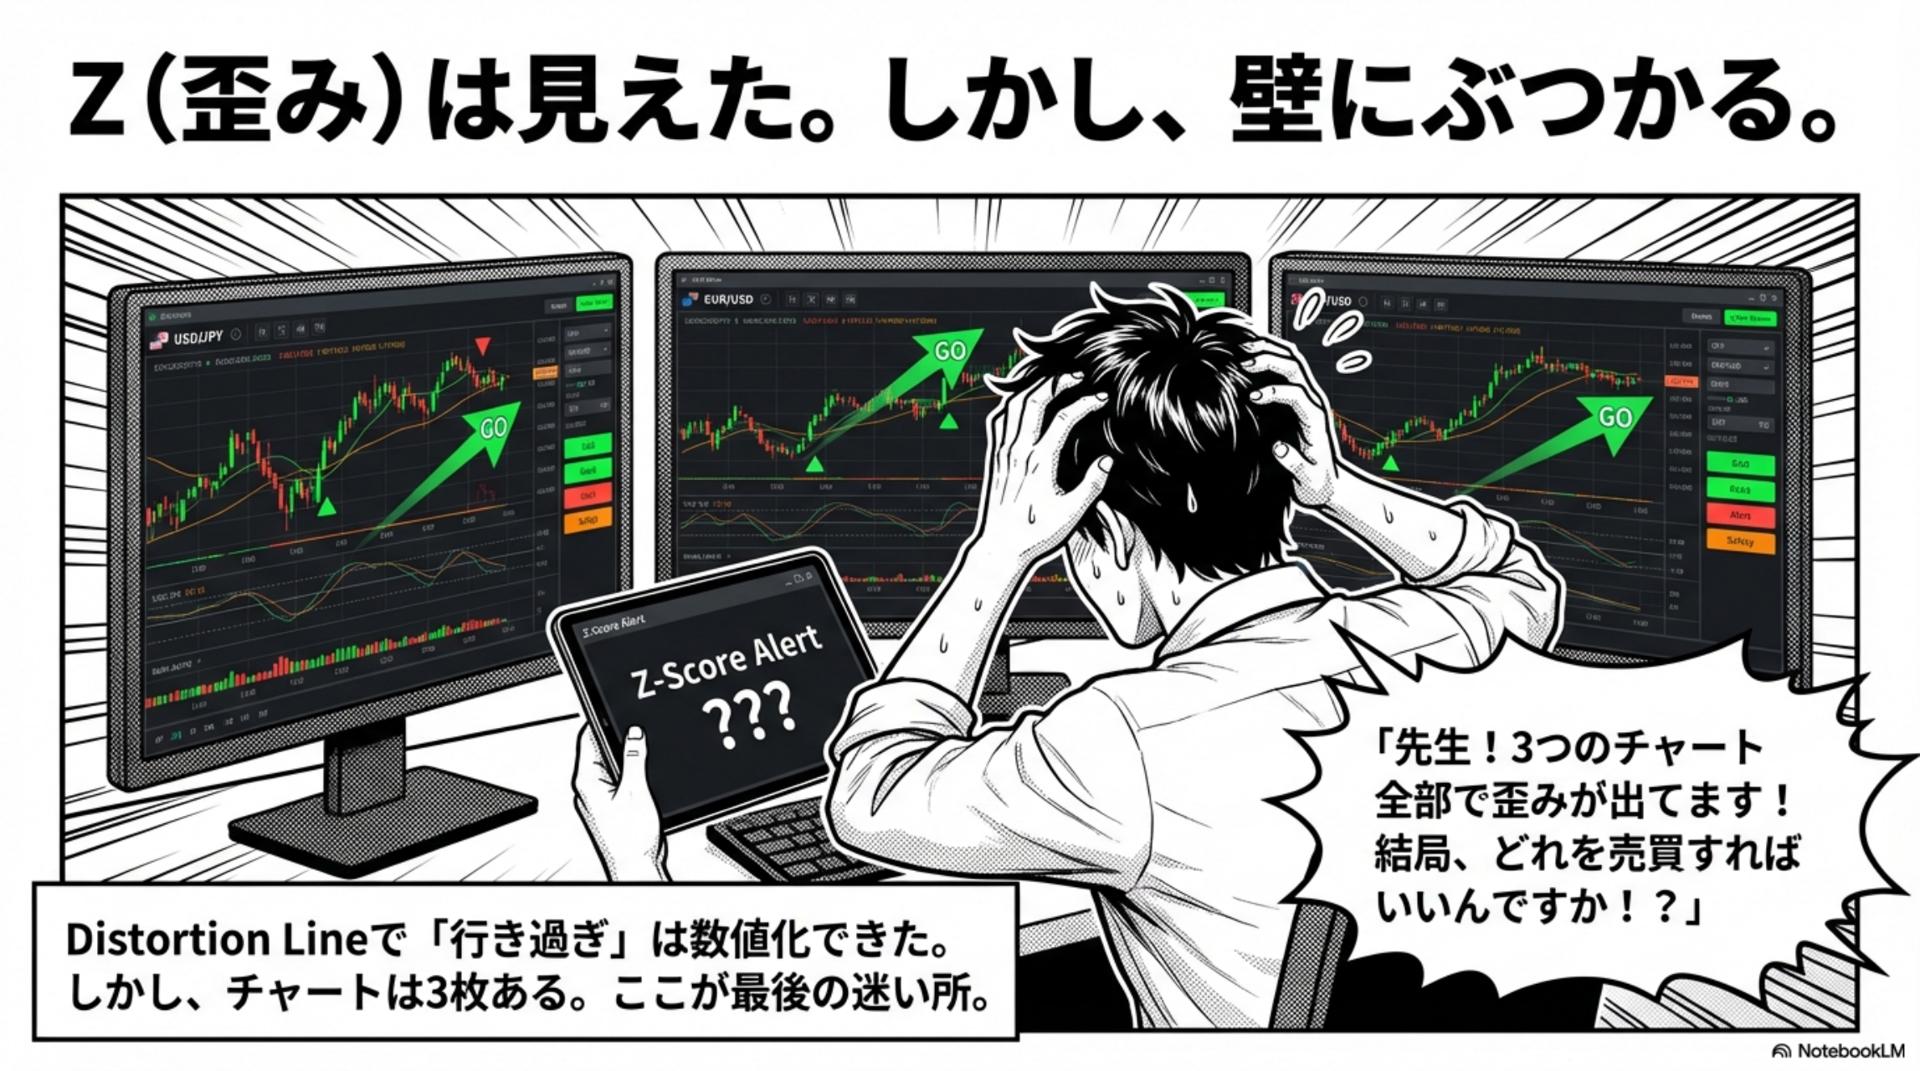
Z ( distortion) is visible. But you hit a wall
We can quantify the “overextension” with Z. In practice, though, it always looks like this:
- Z is reacting
- All three charts appear to move
- Each looks plausible
And beginners are the most confused.
"Teacher! All three charts show distortion!
So which should I trade?"
This is the final hard spot of Triad trading. Conversely, once you solve this, decisions become much easier.
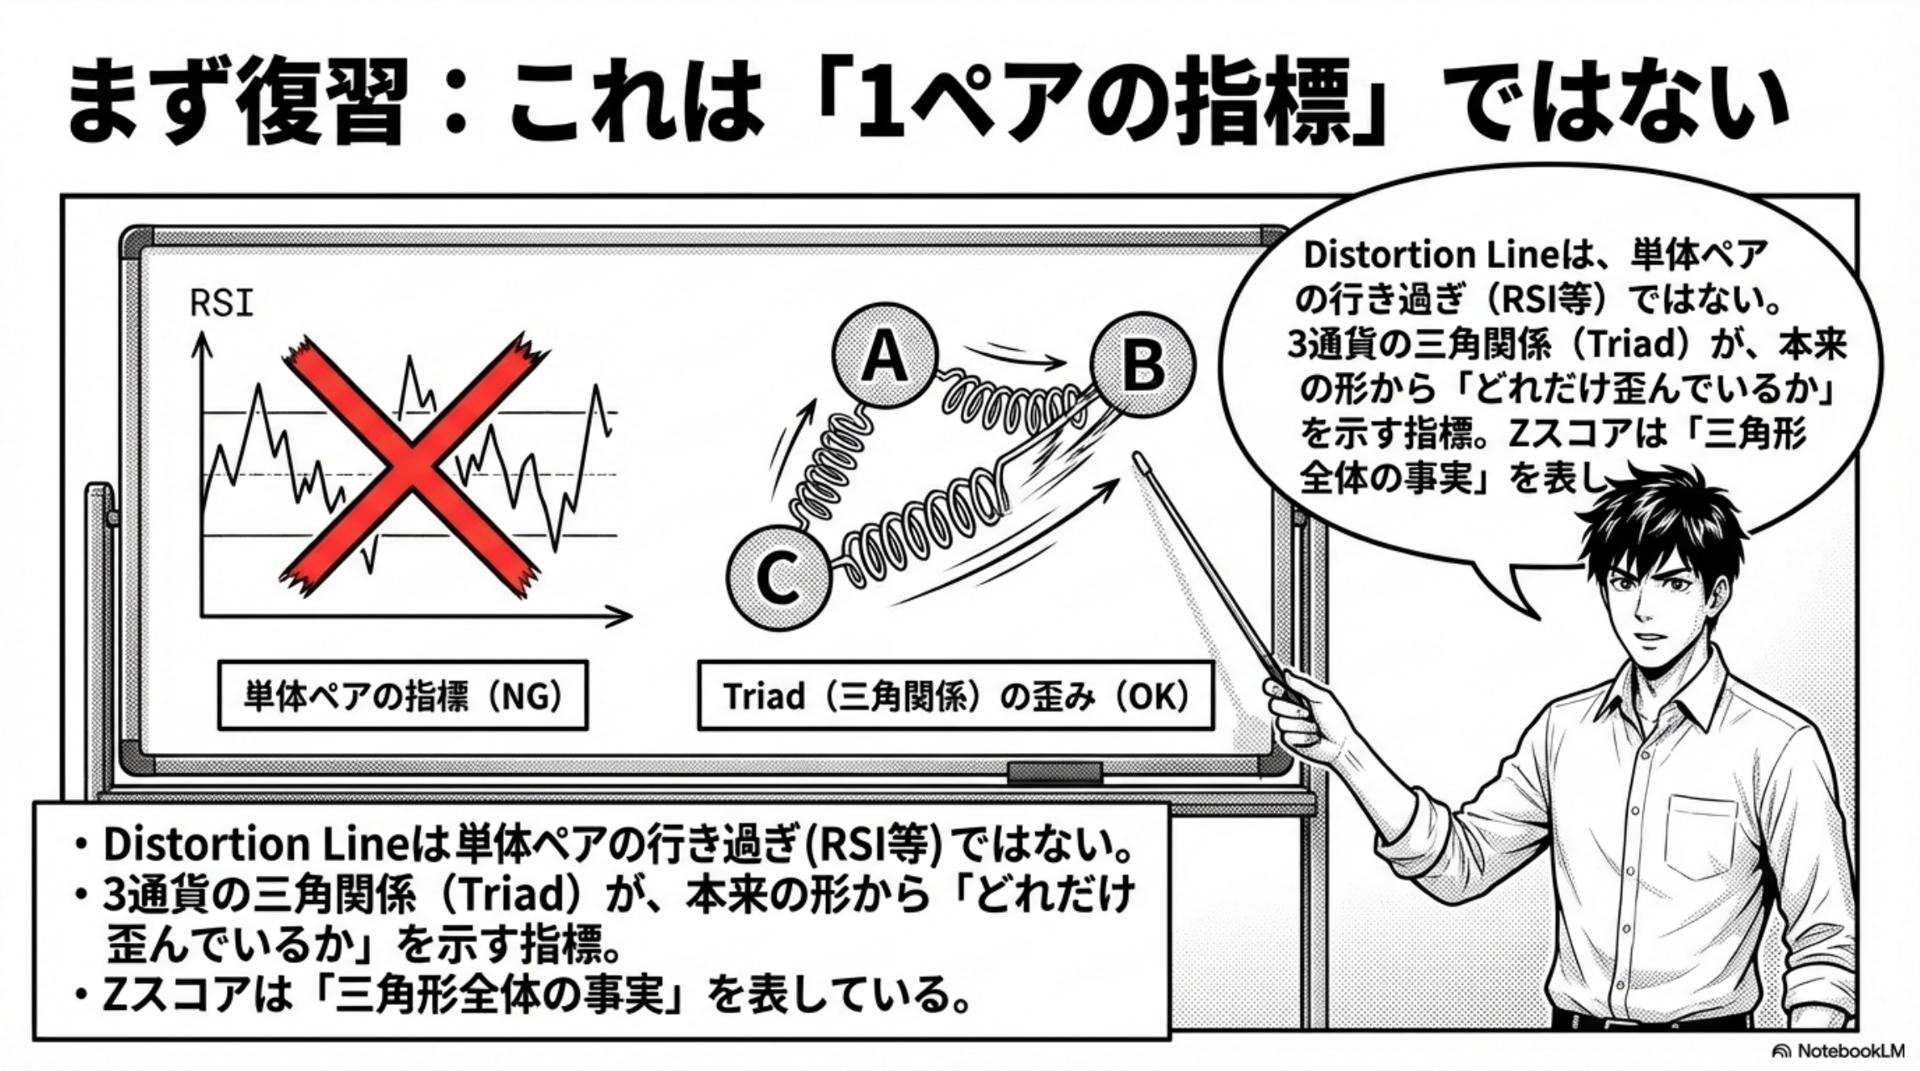
First, a recap: this is not a “single-pair indicator”
Here is one important recap.
Distortion Line is not a “one-pair overextension indicator” like RSI.
What Distortion Line observes is,the extent to which the triad of three currencies is distorted from its normal shape. In other words, what Z score represents is not “this pair is high or low,” but“the whole triangle is distorted.”That’s why even when Z appears, the problem of three charts remains. And the solution isthe Leading leg.
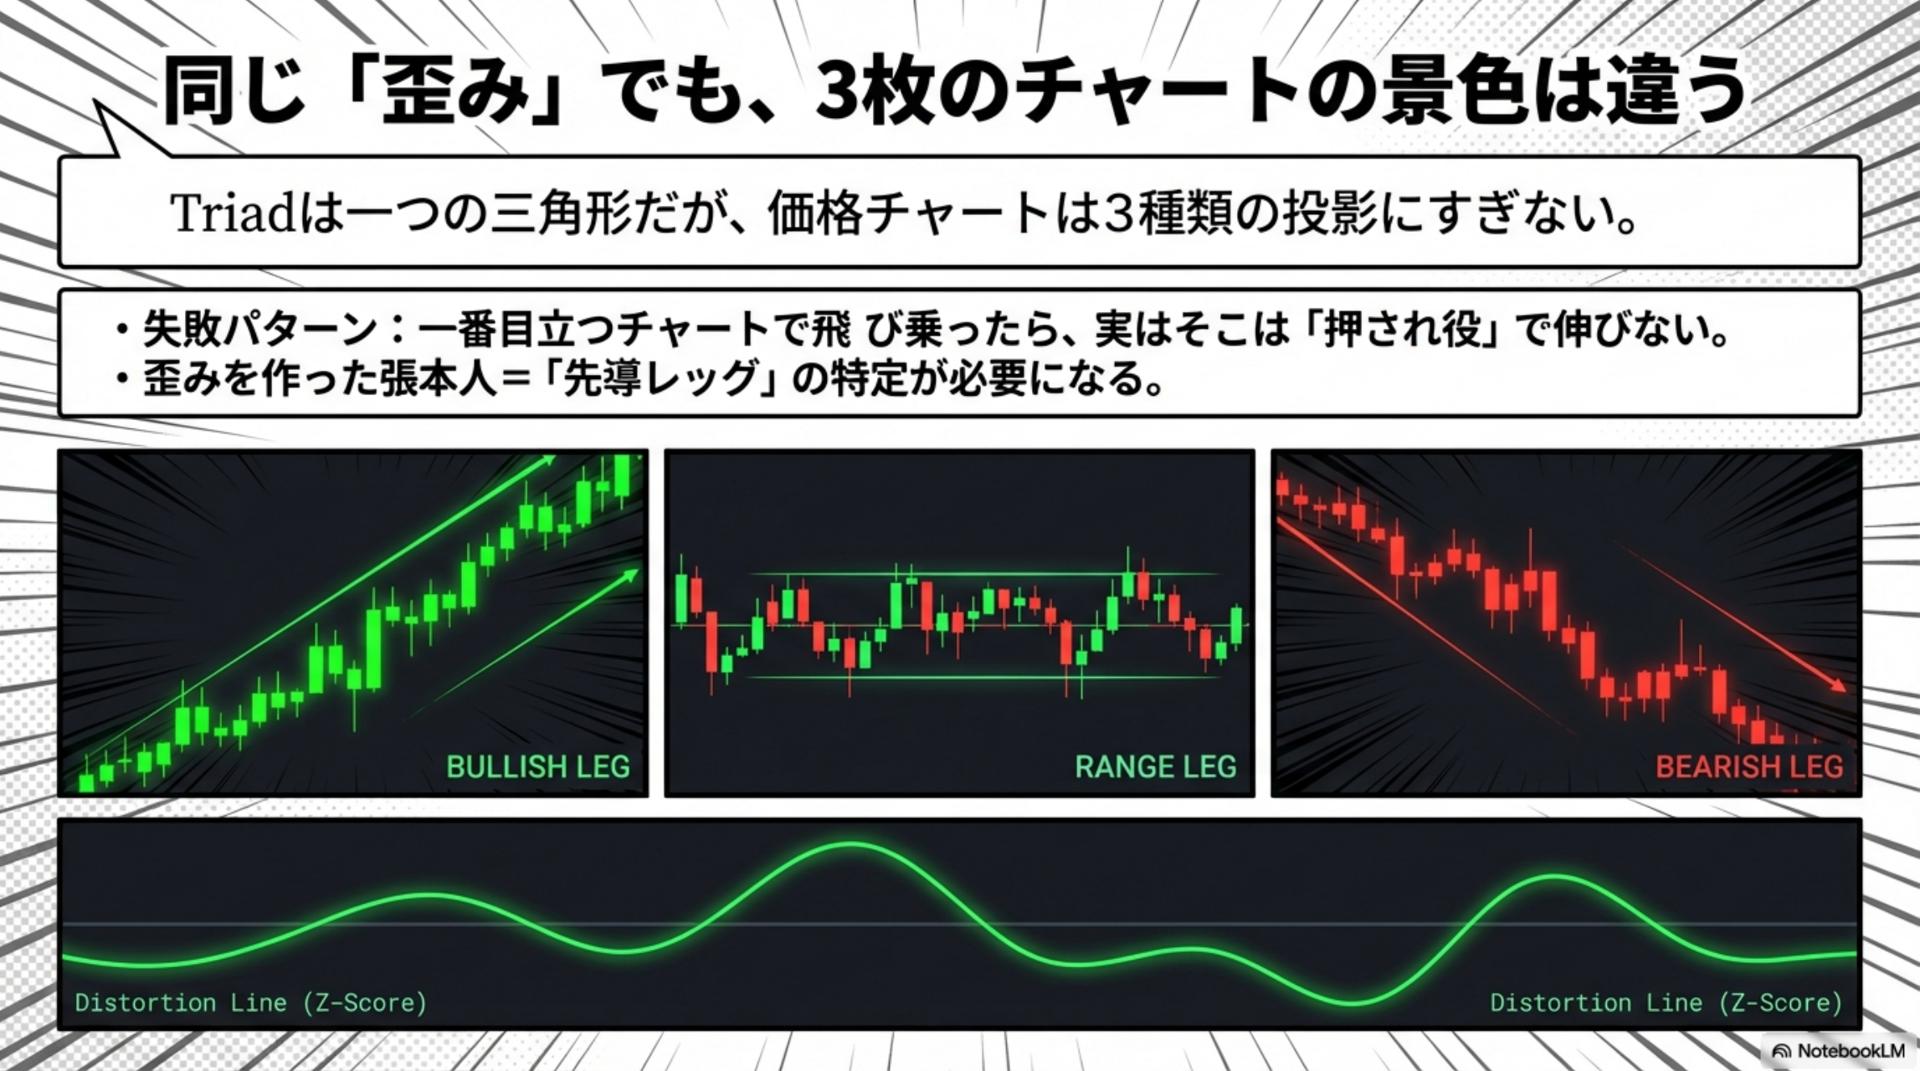
Even with the same "distortion," the three charts show different visuals
A triad is one triangle. But price charts come in three types.
The three charts are merely projections of the same triangle from different angles.
Therefore, even with the same Z, the moves on the three charts have different “faces.” Some look like uptrends, some look like ranges, some look like downtrends.
A common mistake is this:
- Jumping on the most prominent chart
- That chart is actually serving as a follower (being pushed)
- It doesn’t extend, it’s uncomfortable, judgment becomes late
What you need to aim for distortions is this.The leading culprit behind the distortion = the “Leading leg” identifying it.
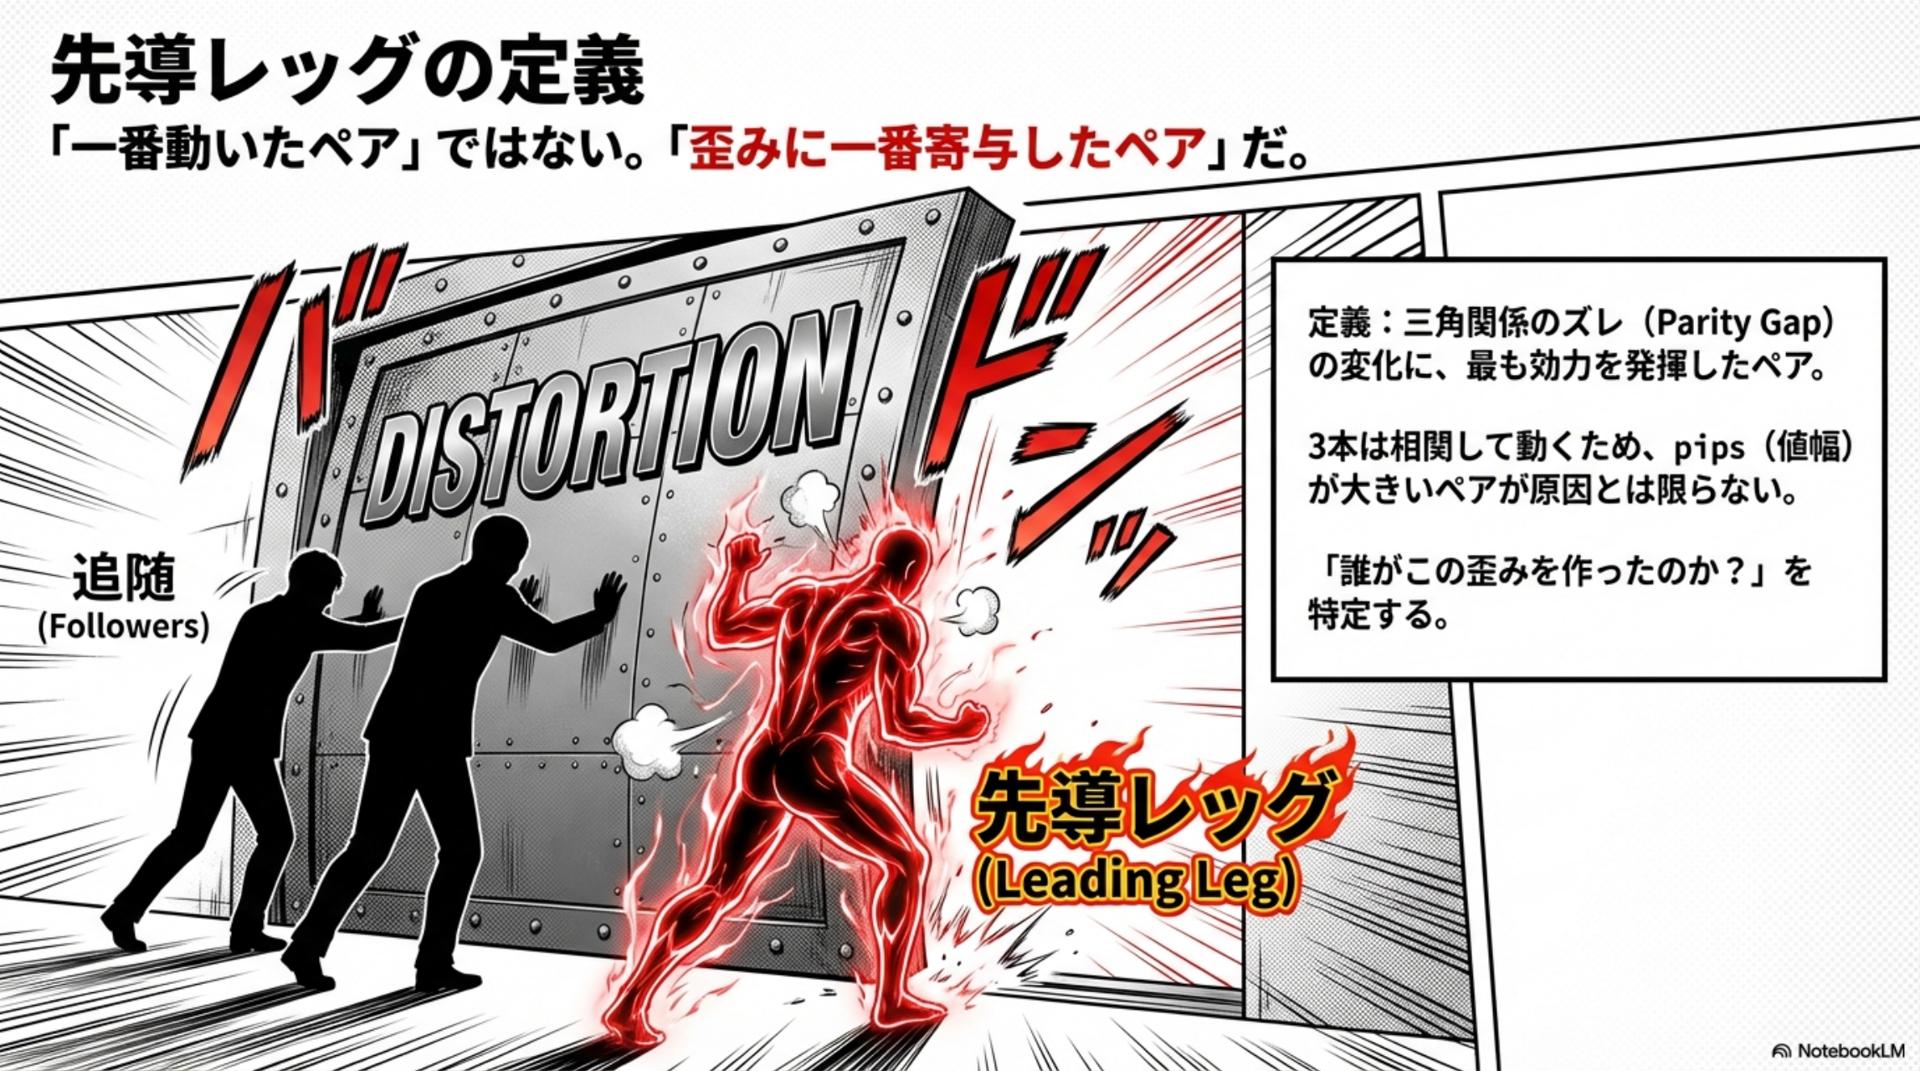
Definition of the Leading Leg: It is not the “most moved” pair
The Leading Leg is a commonly misunderstood term. Let me be blunt.
The Leading Leg is not the “pair that moved the most.”
Here is the definition.
The pair that most influenced the change in the Parity Gap of the triangle
=the pair that contributed most to the distortion
The three lines move in correlation. So a large pip value being the “cause” is not guaranteed.
What we want to know is “who made this distortion?” That answer is the Leading leg.
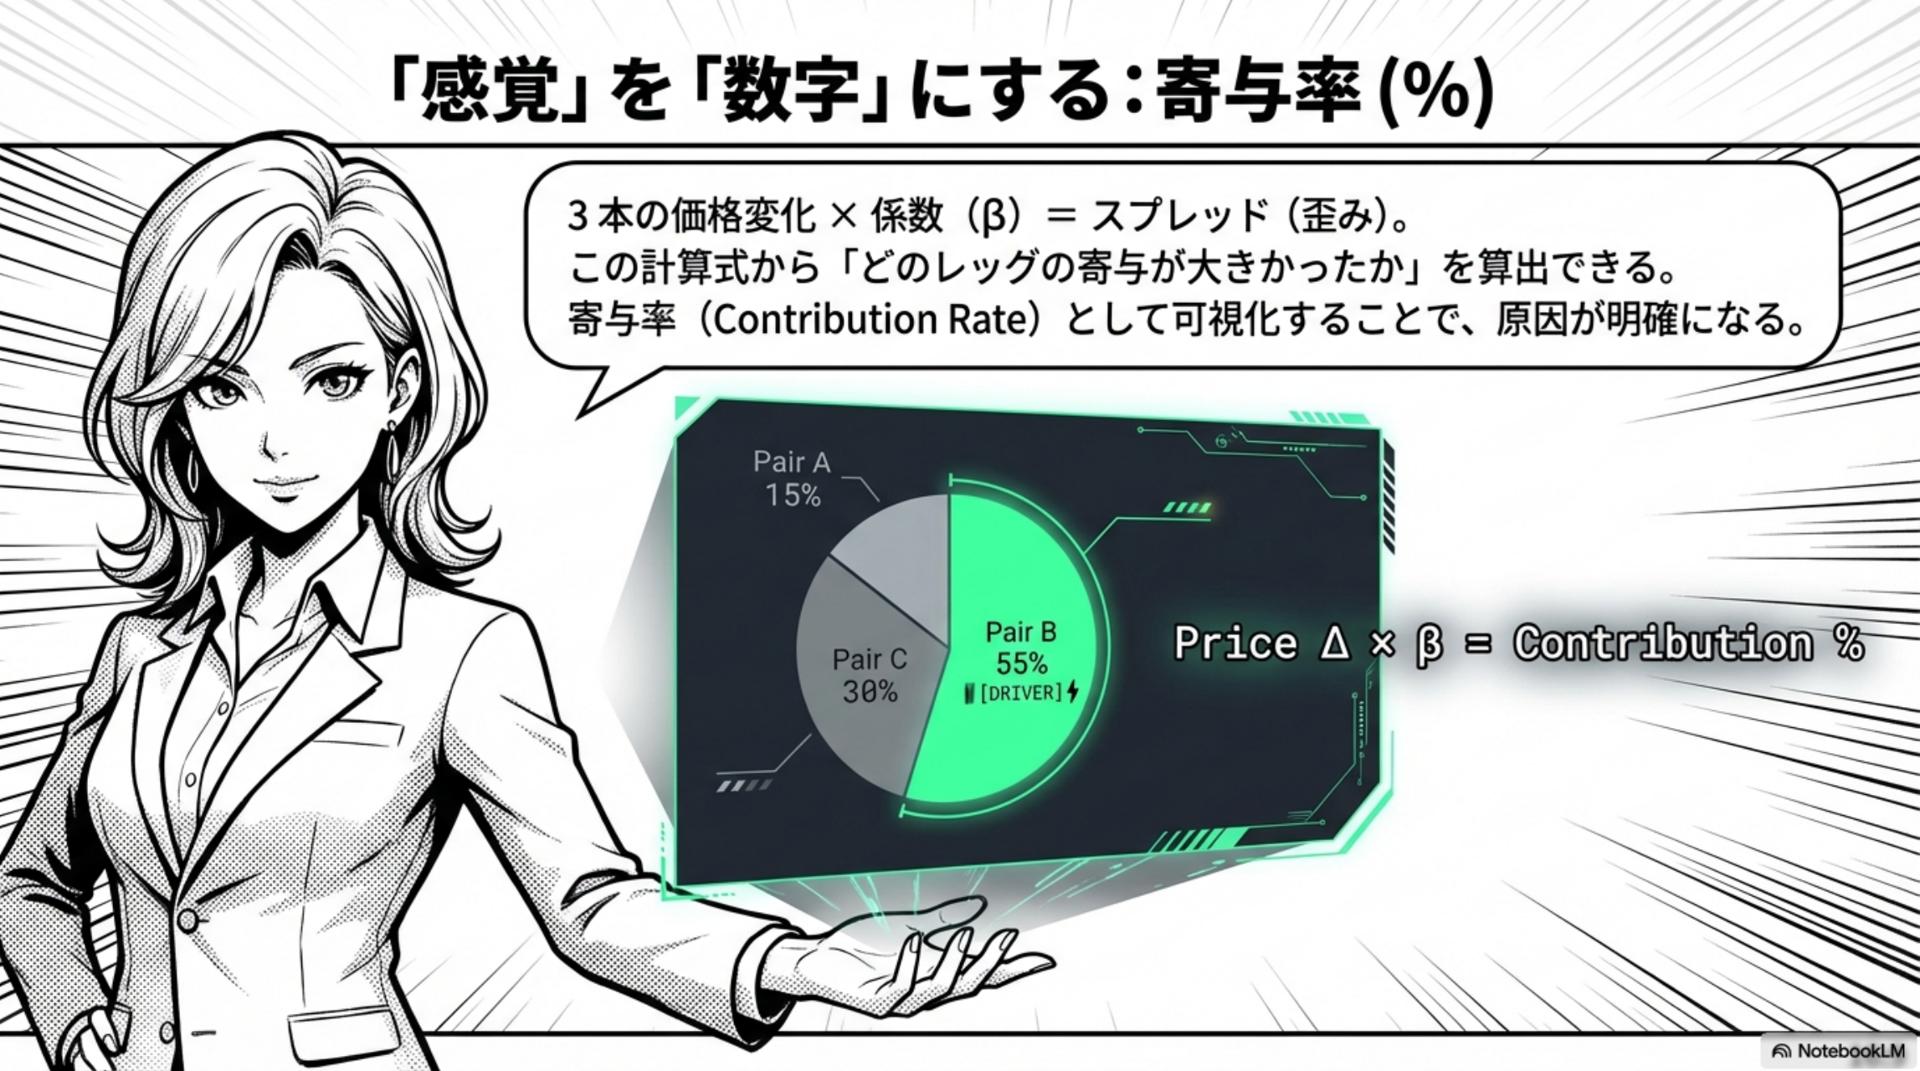
Turning “feel” into numbers: Contribution rate (%)
This is the key from here on.
Instead of something that looks central,decide the main character with numbers, which is the TriParity approach.
The idea is simple.
- Distortion (spread) is created by the synthesis of three price changes
- In rough terms
three price changes × coefficient (β) = spread (distortion)
From this viewpoint, we can answer questions like: “Which leg contributed the most to this distortion?” And visualize it asContribution Rate, %.
% largest indicates the Leading leg (main actor)
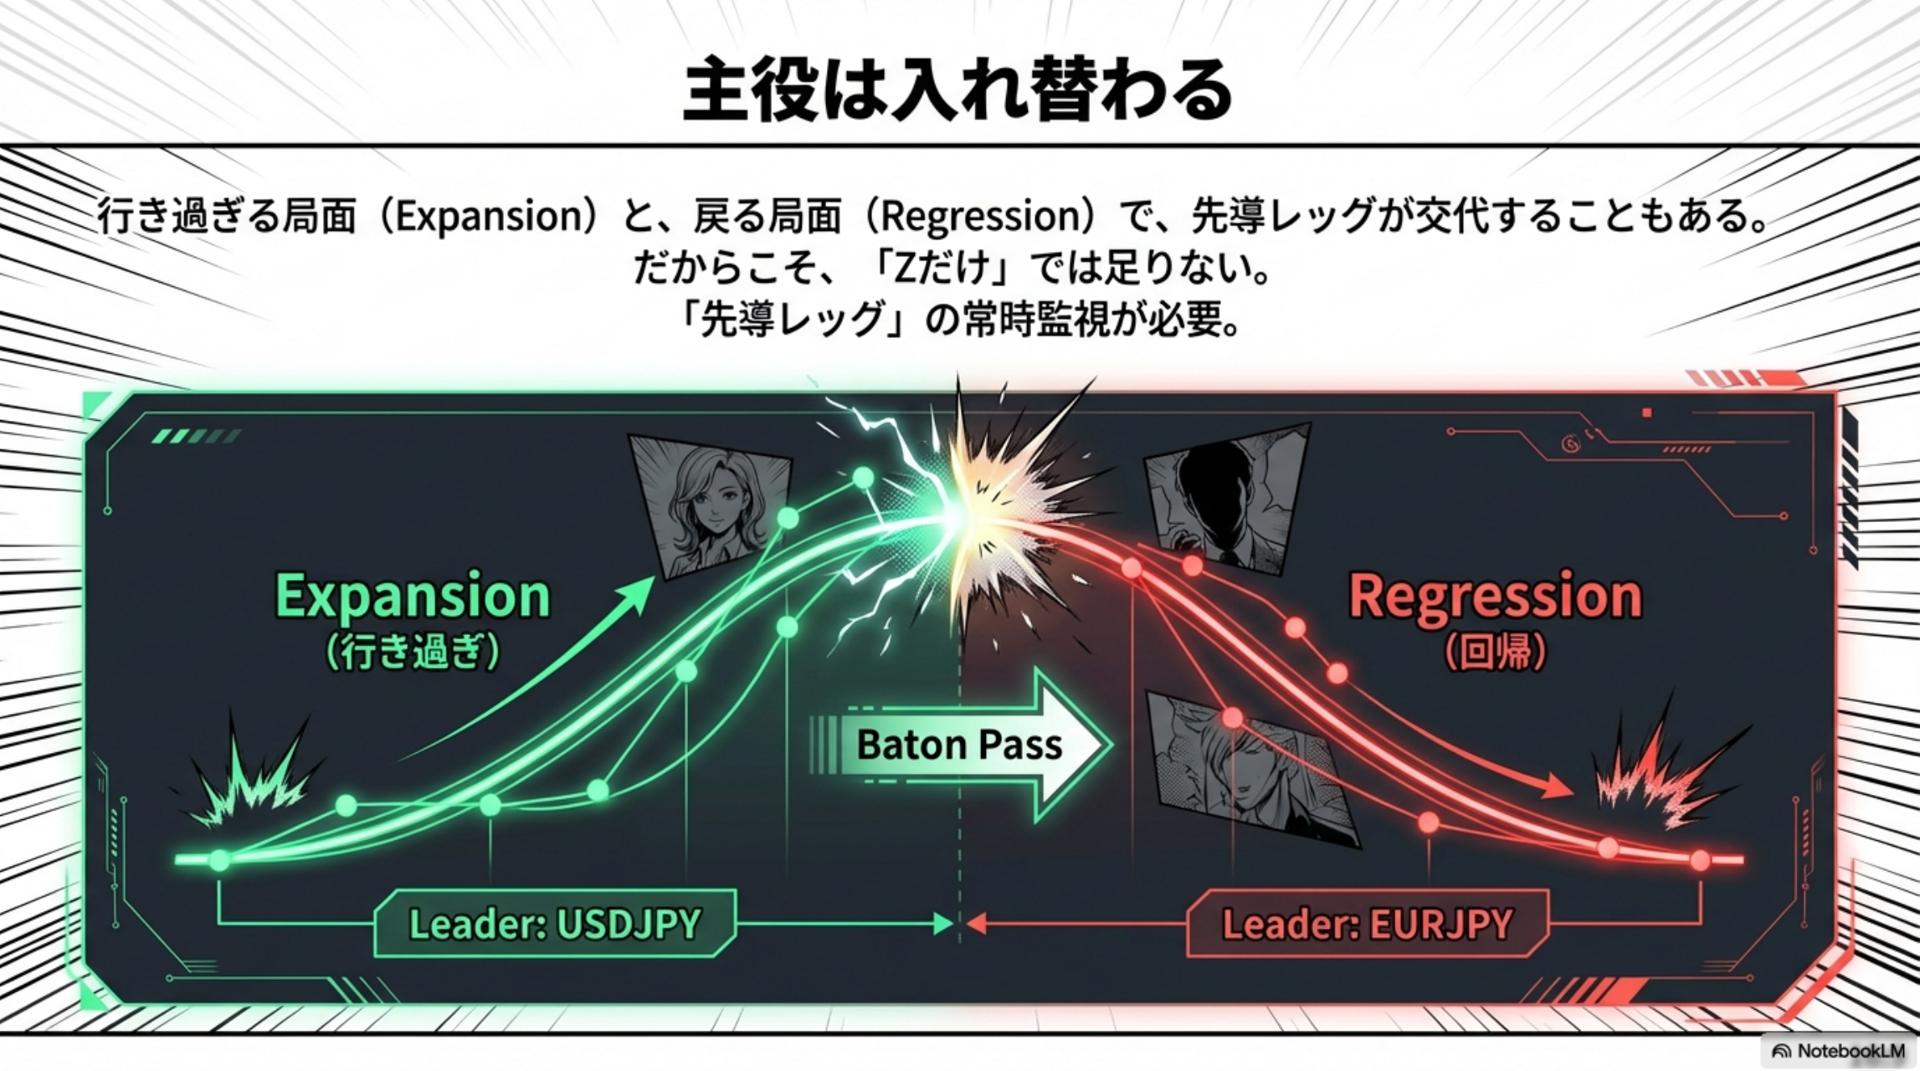
The main actor changes: Expansion and Regression
There is another important point. The Leading Leg is not fixed.
During overextension (Expansion) and during retreat (Regression), the Leading Leg can switch.
- Lead actor A that caused the overextension
- Lead actor B that drives the regression
- A baton pass can occur in the middle
Therefore“Only Z” is not enough. The Leading Leg must be monitored constantly. This is the strength and the trick of Triad trading.
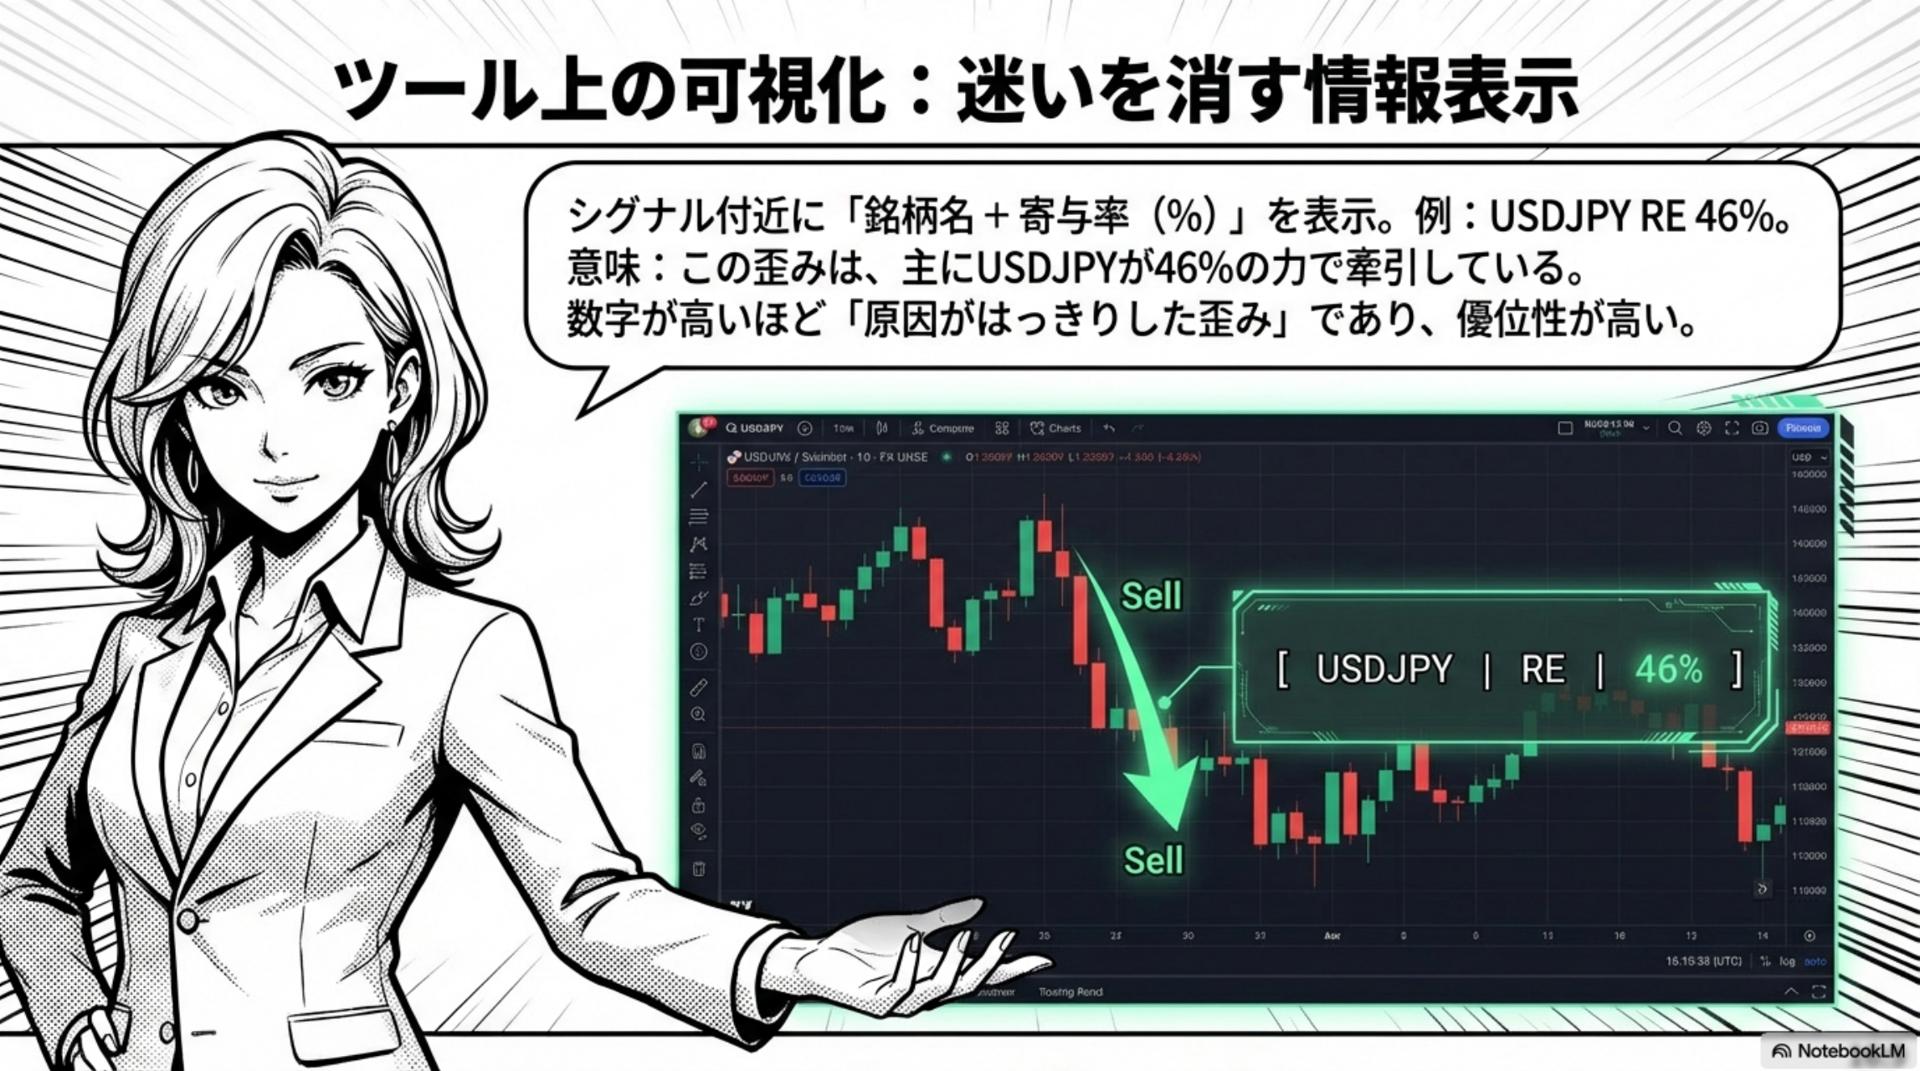
Visualization on the tool: information display to remove confusion
“So how does it actually display on the tool?” Here is how it appears near the signals.
Example: USDJPY / RE / 46%
- This distortion is mainly being driven by USDJPY46%.
- the main actor (Leading Leg) is USDJPY
Even more importantly,the higher the number, the clearer the source of distortion. When the cause is clearer, judgments become easier.
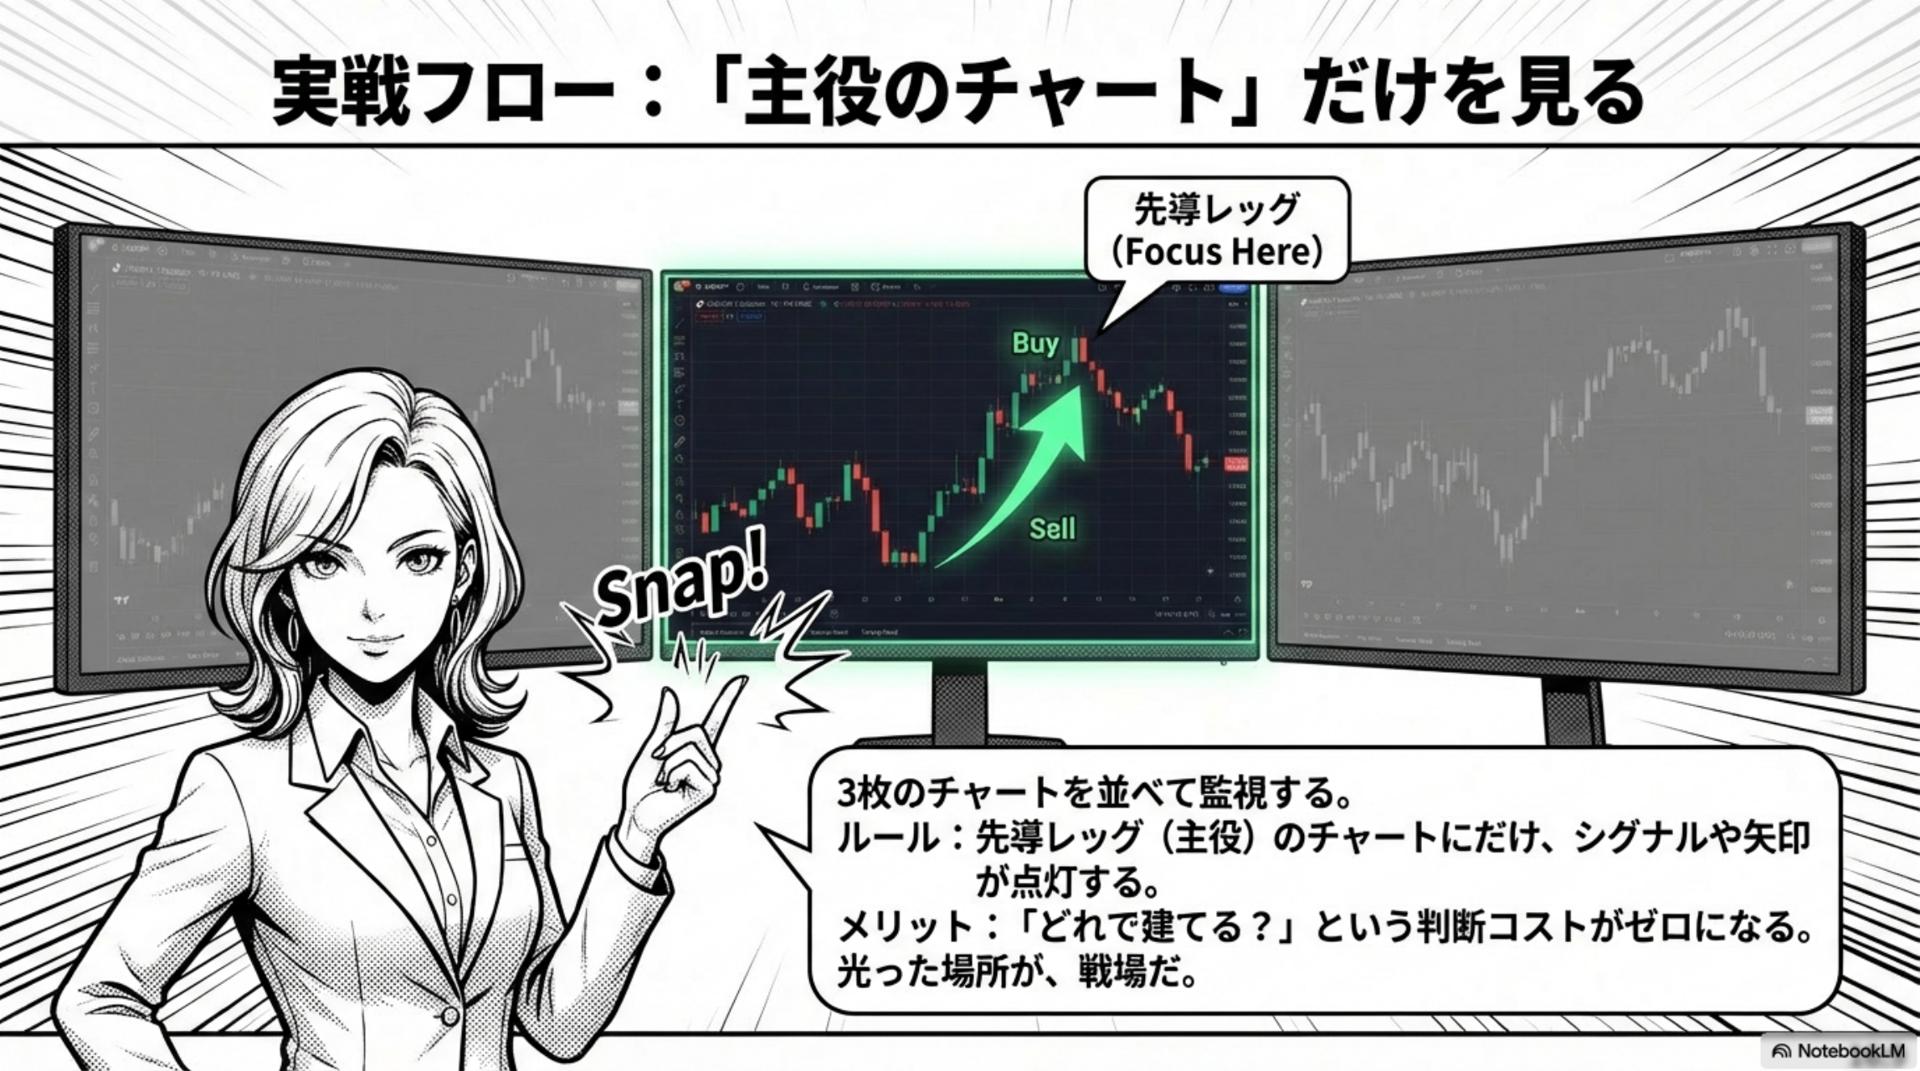
Practical flow: Look only at the “main actor” chart
This is the operation rule I most often recommend to beginners.
Place three charts side by side and monitor.
Then only look at the main actor (Leading Leg) chart.
The rule is one line.
Only the Leading Leg’s chart lights up with signals or arrows.
The benefits are clear.
- Eliminates the decision cost of “which to build on?”
- The lit-up area is the battleground
- Reduces misses
In the beginning, really,just look at the lit chart and ignore the others. This is fine.
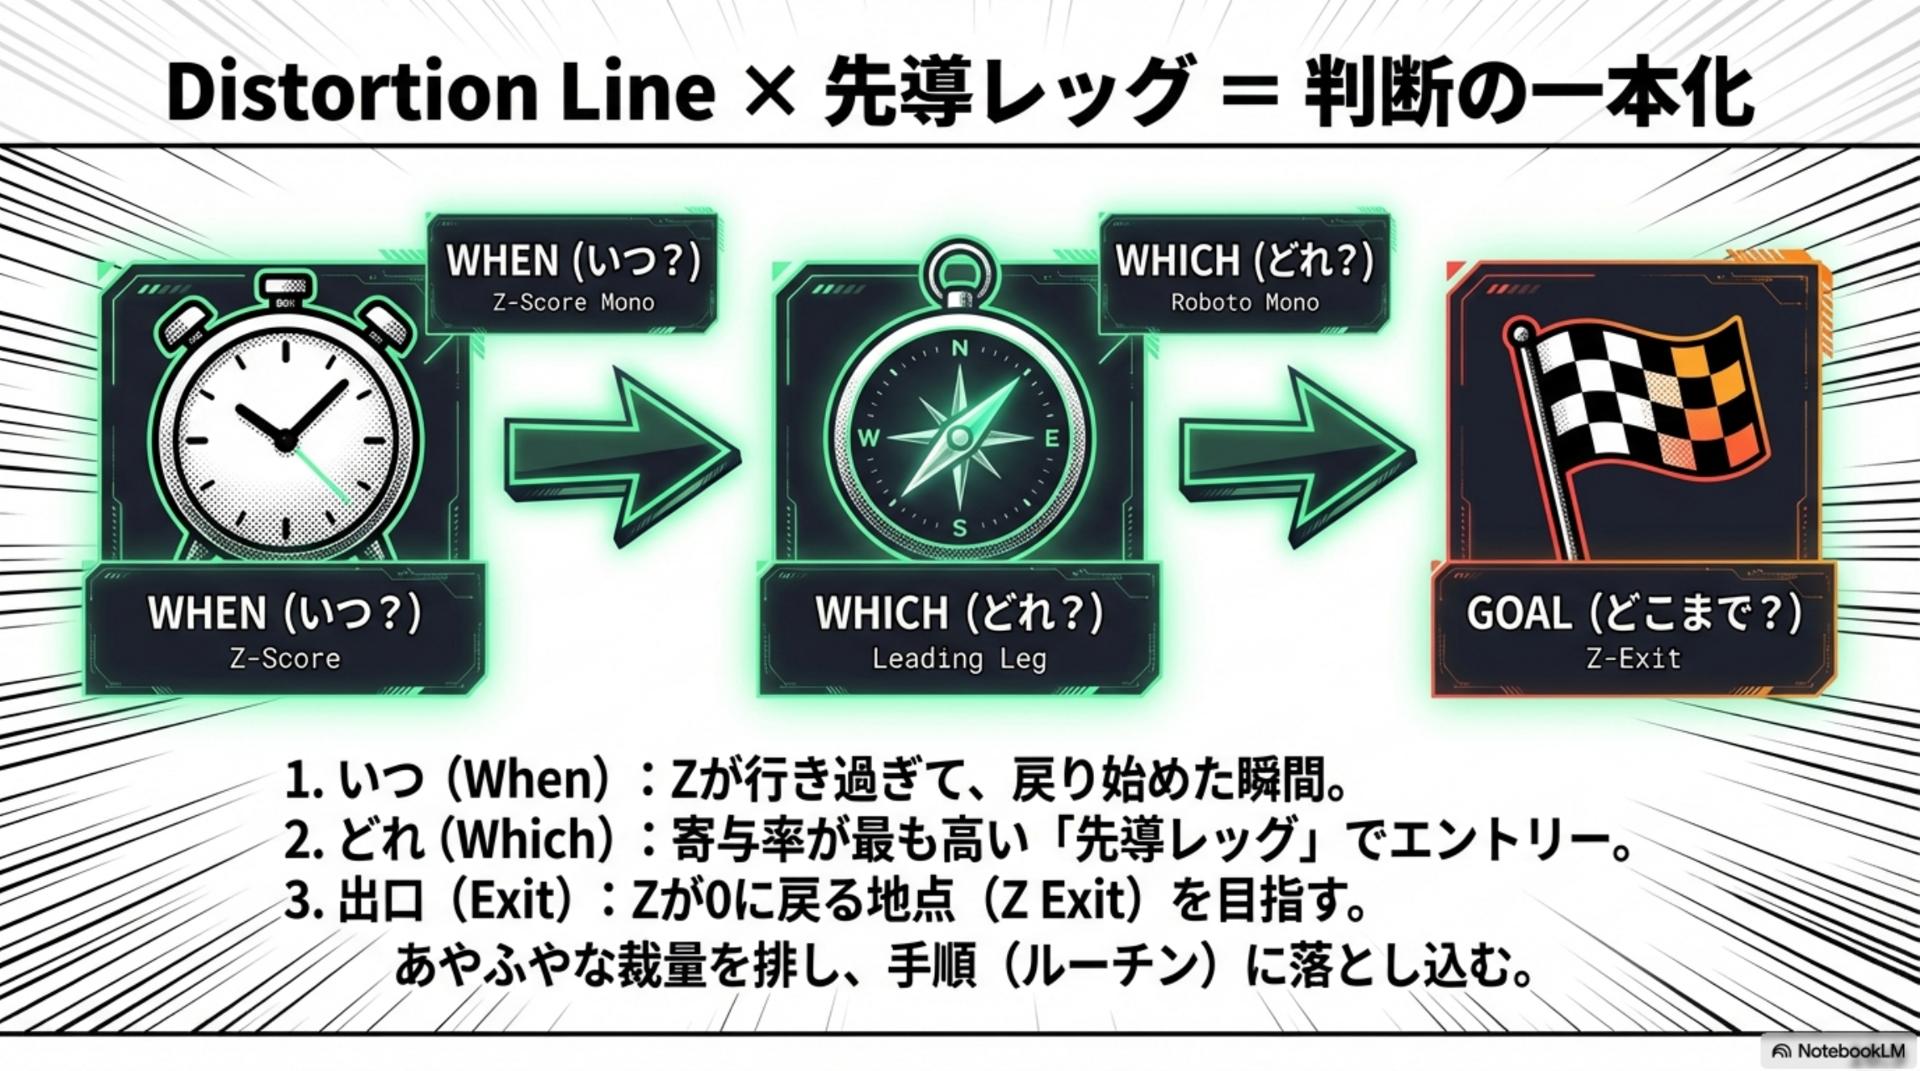
Distortion Line × Leading Leg = unify the decision (When / Which / Goal)
I will now summarize this as a single procedure.
① WHEN (When?)
The moment Z overextends and starts to revert(the moment distortion begins to revert)
② WHICH (Which one?)
Enter with the Leading Leg that has the highest contribution rateand decide on the main actor’s chart
③ GOAL (How far?)
Aim for the point where Z returns to 0 (Z Exit).
Mantra: Time with Z, asset by %, exit at Z=0
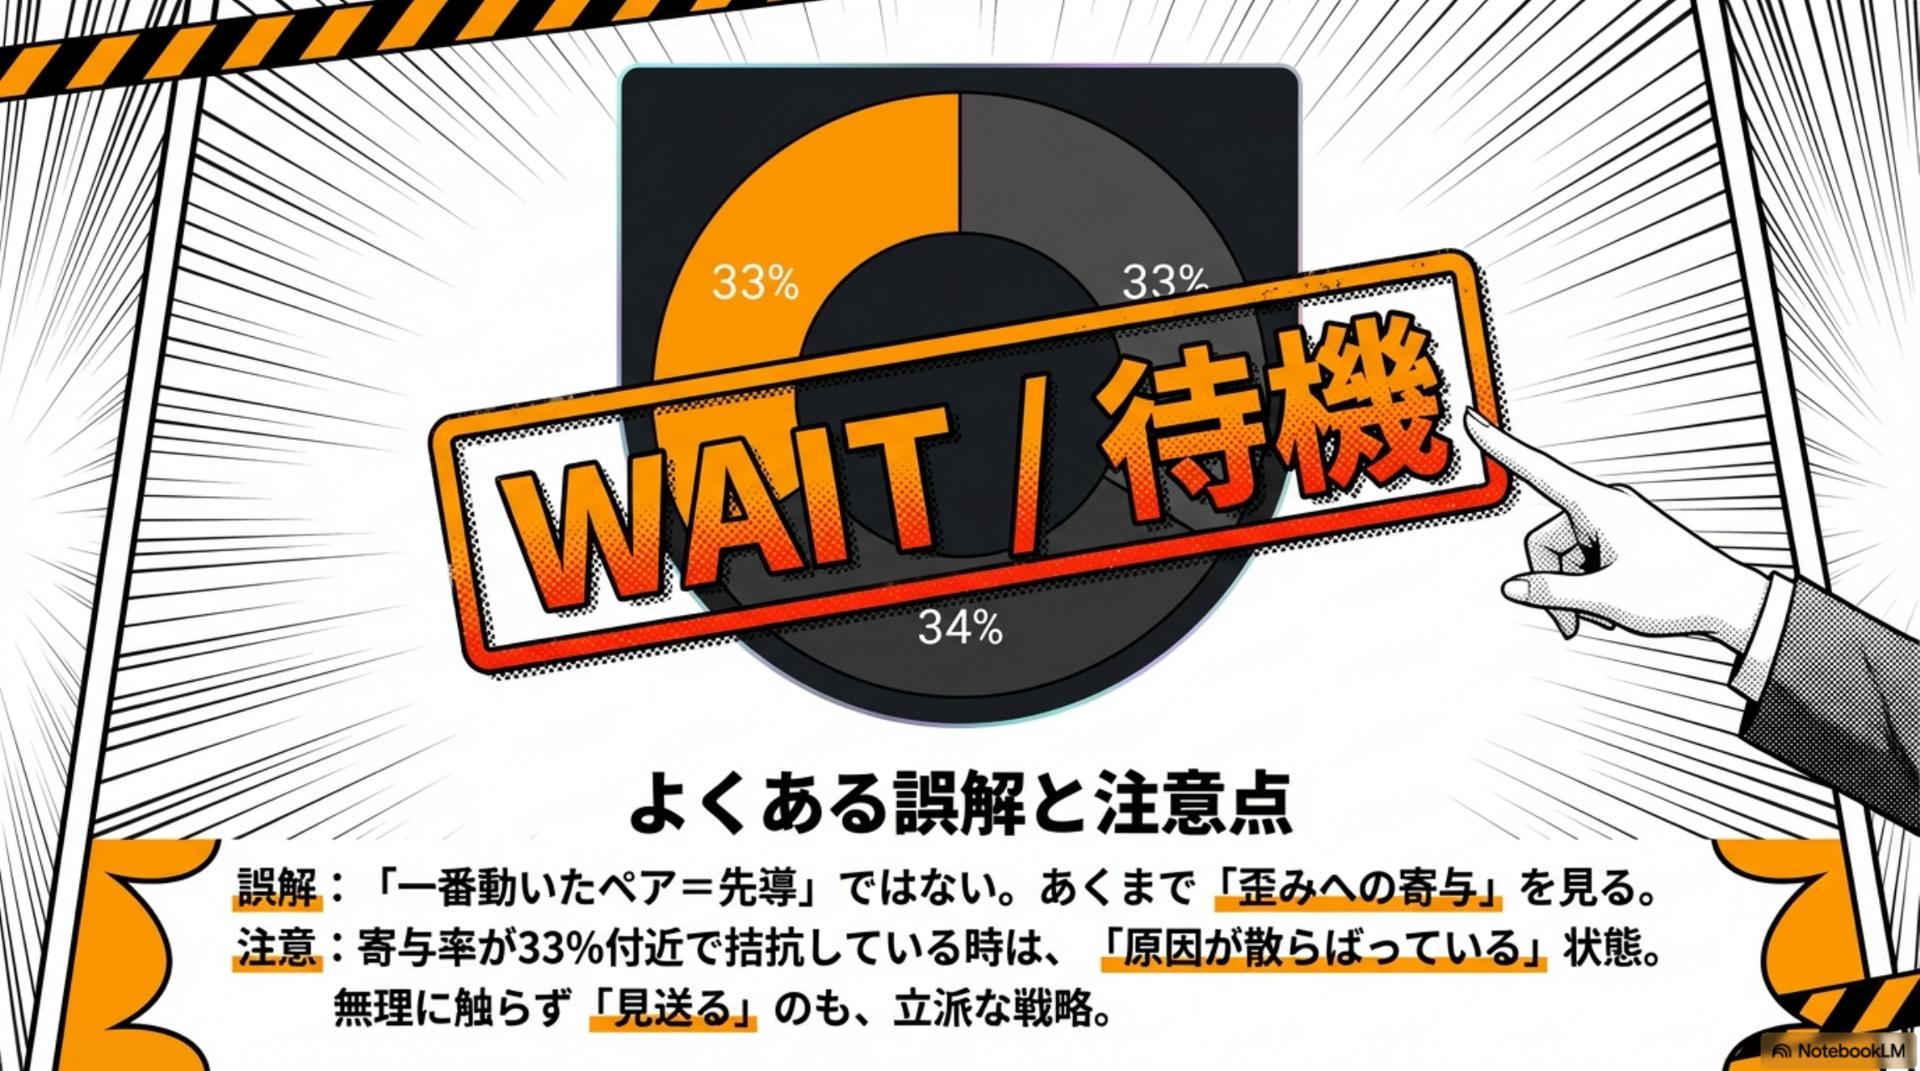
Common misconceptions and cautions: around 33% is a WAIT zone
Finally, a caution to reduce losses.
“The most moved pair is not the Leading Leg.”What you should look at is,the contribution to distortion (%). And the contributions can be, for example,33% / 33% / 34%, balanced in a way that indicates the causes are scattered. This is hard to read.
In such cases, the correct action is: WAIT
Do not force trades; pass on opportunities. Waiting is a valid strategy. This judgment tends to improve win rate for beginners.
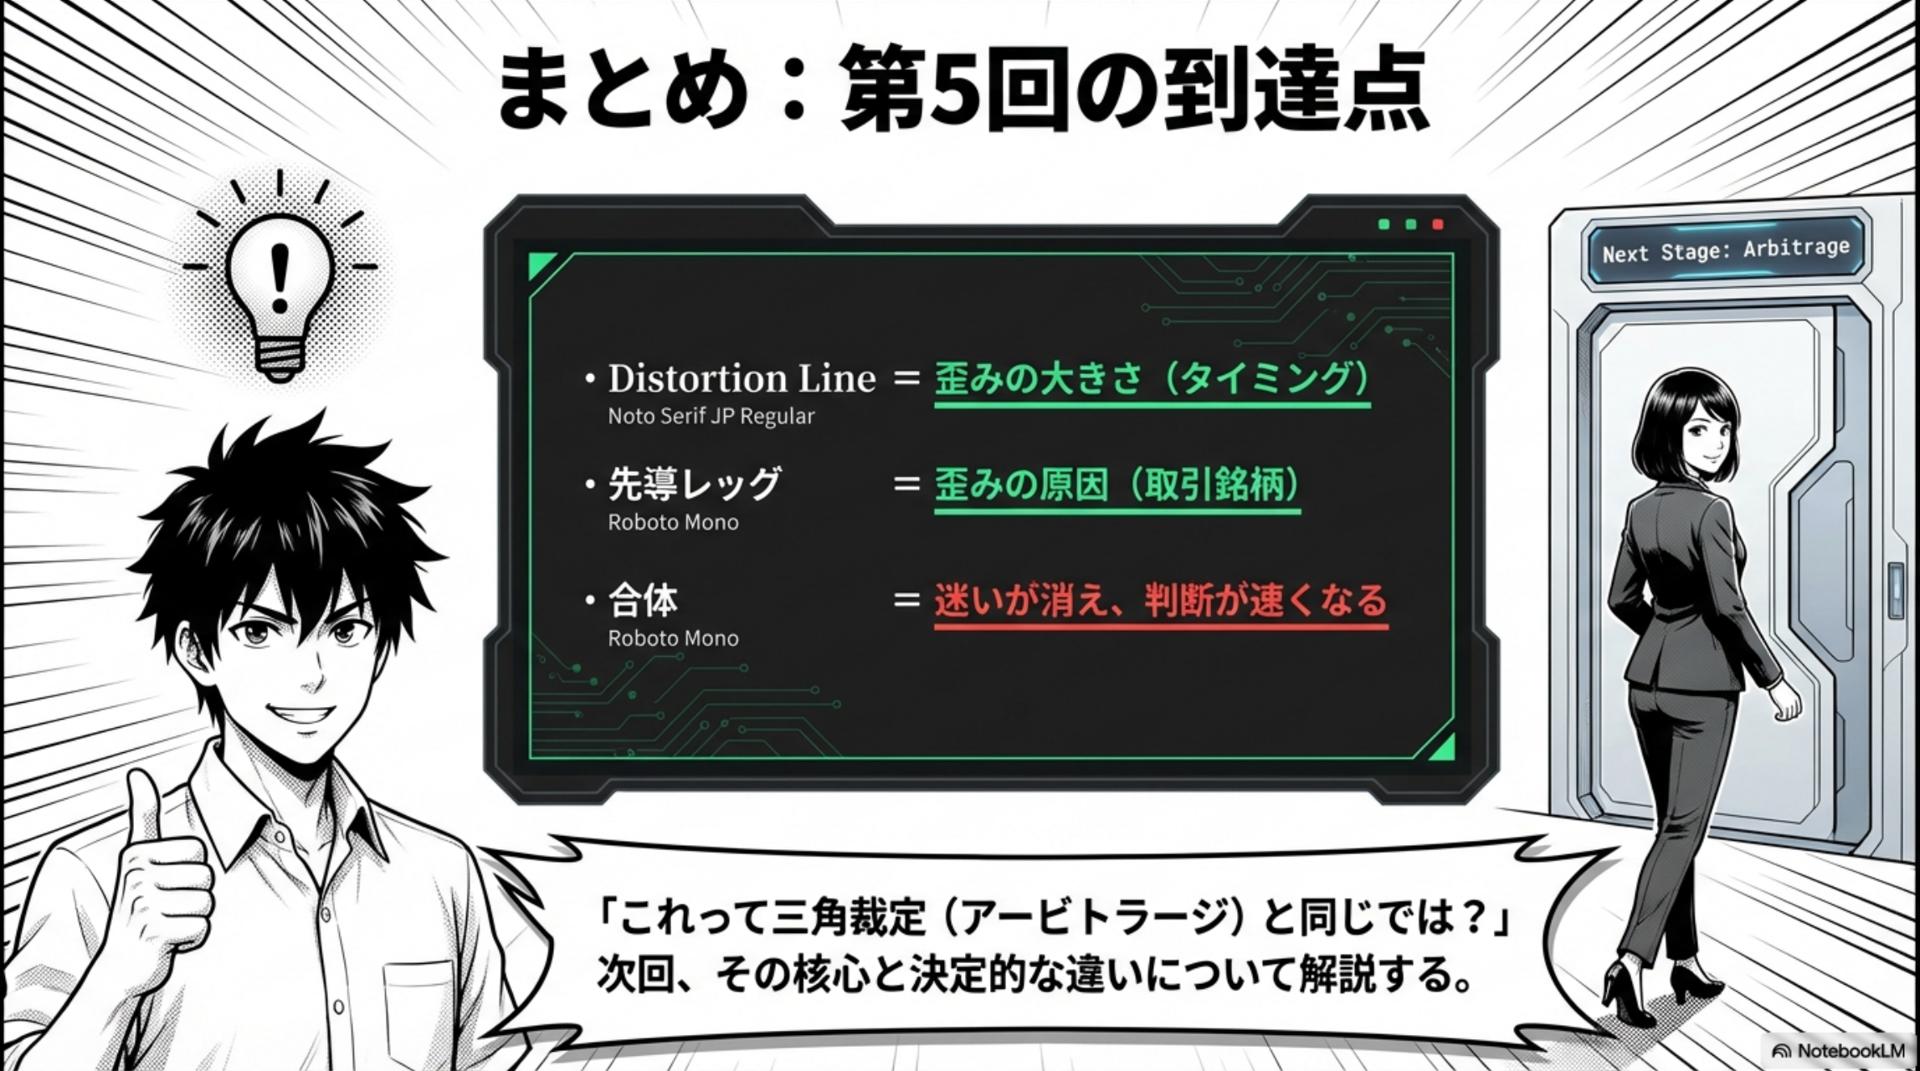
Summary: Episode 5 reach points (plus next episode preview)
Here are the Episode 5 results.
- Distortion Line= Magnitude of distortion (timing)
- Leading Leg= Cause of distortion (trading pair)
- Combination= Confusion disappears, decisions speed up
With this, the final confusion in Triad trading, “which pair to build on?” disappears.
And next time. At this point, many people feel, “Is this the same as triangular arbitrage (arbitrage)?”
Next time, I will directly answer that concern.The decisive difference between conventional arbitrage and TriParity’s “distortion regression”will be explained.
Disclaimer (Investment navigation + for reference)
This article is general information for educational purposes and does not recommend specific currency pairs or trades. Investment decisions should always be made at your own responsibility.
Product page:
https://www.gogojungle.co.jp/tools/indicators/72398