

Utilization of the "Visualization Indicator" (Part 234)
「Visualization Indicator」 utilization(its234)
1. “28 Currency Pair List Indicator” is further evolved into an indicator
“8CP Visualization Indicator” to draw GBPJPY chart
“8CP Visualization Indicator” includes Oceania version direction, London version, NewYork version, AnyCP version. This time, London version was used.
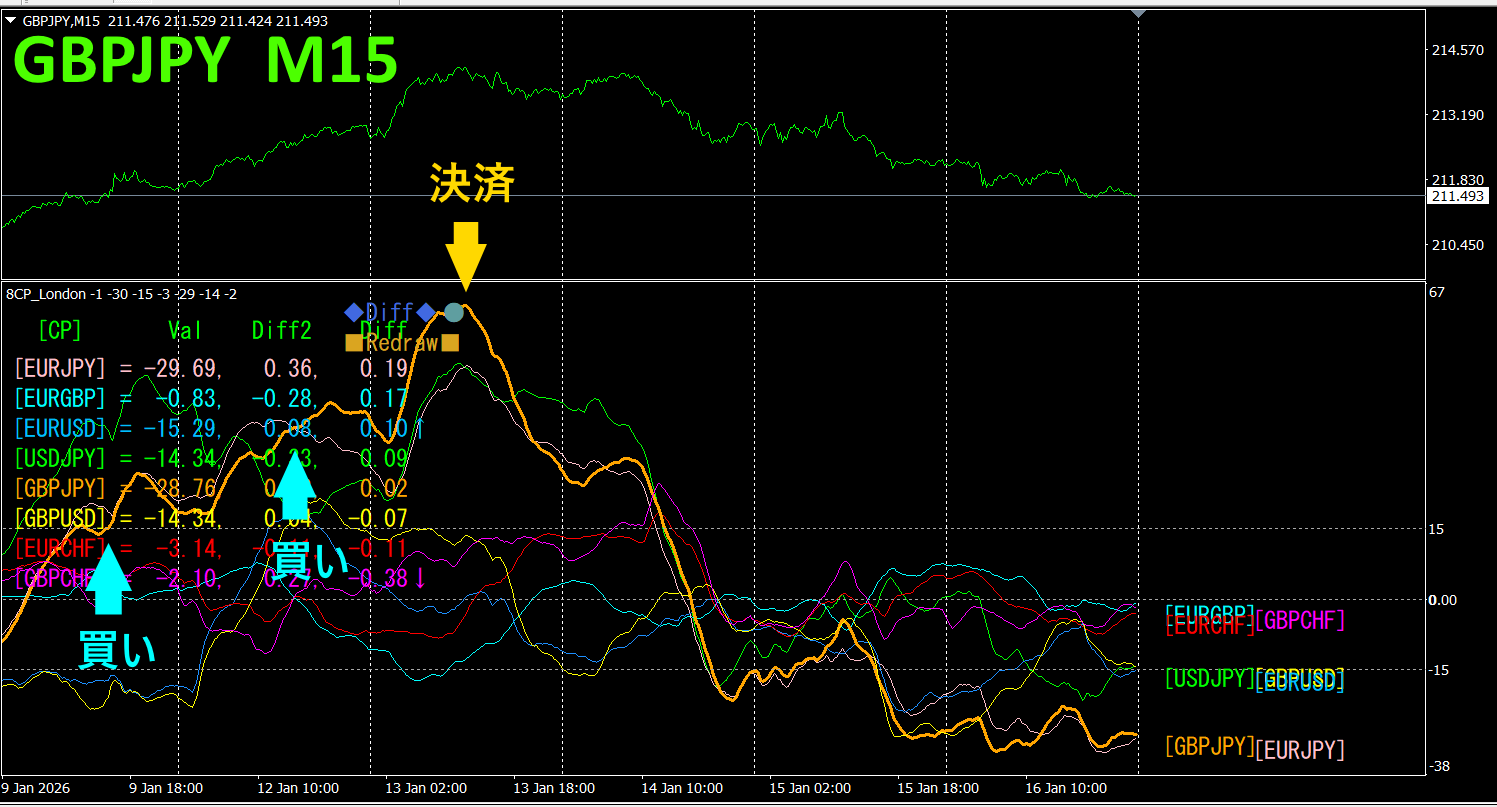
The upper half shows, GBPJPY 15-minute chart. The lower half is from the “8CP Visualization Indicator”, orange colored graphs correspond to GBPJPY.
Over the weekend, it has already breached the threshold and risen(upward arrow on the left). On Monday, the GBPJPY chart rose above the others, and surpassed the other chart groups to become the top one, so we went long to trade. On Tuesday, we reached a peak and closed the position. Profit was about 160 pips.
Currency Strength/Weakness Graph
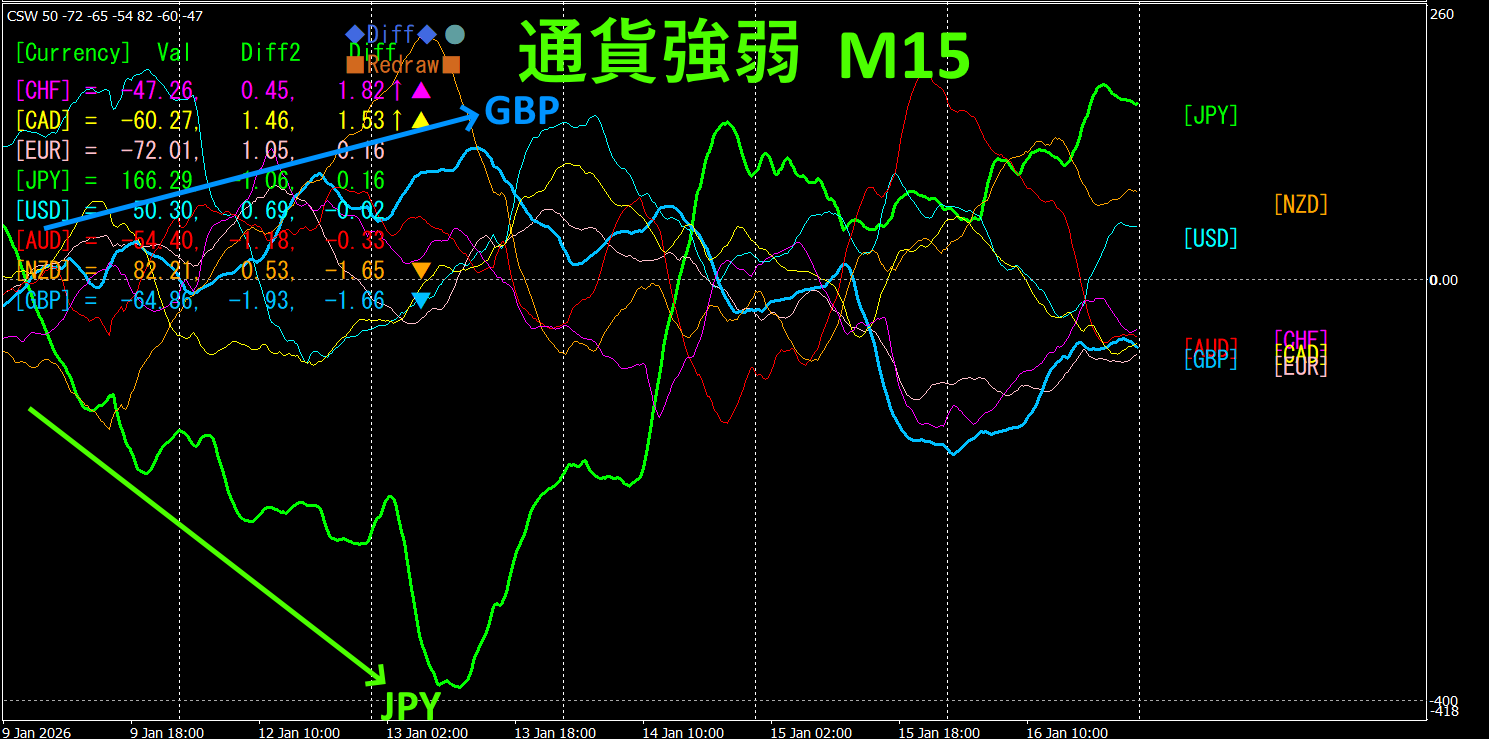
Looking at the 15-minute currency strength graph, GBP is strong, JPY is weak, and in the currency strength graph, GBP and JPY show a clear inverse correlation
The relationship between GBP and JPY is that with GBP > JPY, focusing only on the parts where GBPJPY spreads and expands, you should buy GBPJPY for trading. Since the inverse correlation chart is clean, as long as the vectors are expanding, just hold the position.
In FX, pick the currency pair that is currently growing the most and showing a reverse correlation, and the results will follow naturally.
“Trade currency strength inverse correlation!” is a rule of FX.
Using “TrendLine-EX”, entries and exits can be automated via diagonal trendline breaks. Since you can just leave it as is, easy and comfortable trading becomes possible. “TrendLine-EX” is a semi-automatic EA that can perform automatic selling on trendline breaks below, and automatic exit on trendline breaks above.
2. Best Select Try the indicator
The figure below is a screenshot taken on year January 16 00:49 (JST) .
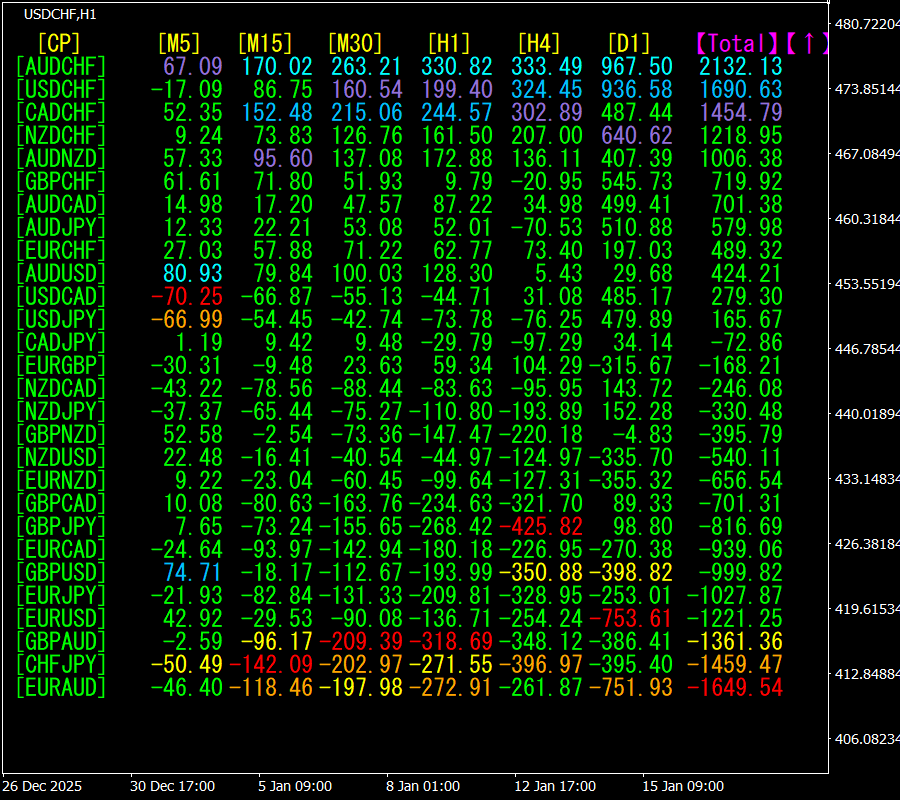
[Total] is sorted in descending order by value. The top is AUDCHF, which is blue across all timeframes. The Total value is 2132.13, a large positive number. This suggests an uptrend in AUDCHF.
Now,.
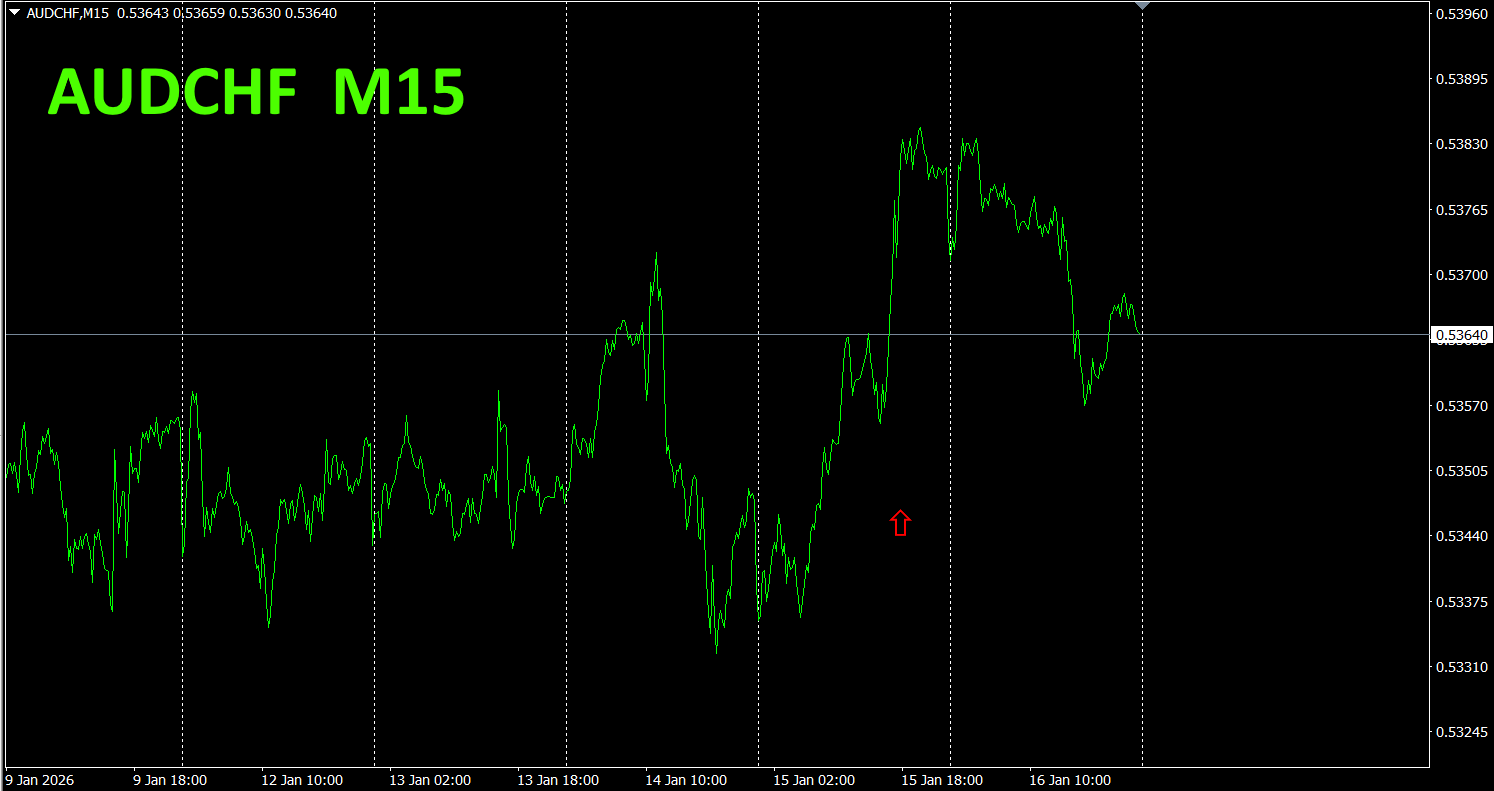
The red arrows mark the screenshot points. They capture rising areas.
“28 Currency Pairs Best Select Indicator” allows you to easily identify which of the 28 currency pairs has the strongest trend among them. It also tells you whether to trade now or not with numbers and colors. It is an excellent indicator for assessing all currency pairs at a glance.
“28 Currency Pair Best Select Indicator”
https://www.gogojungle.co.jp/tools/indicators/35128

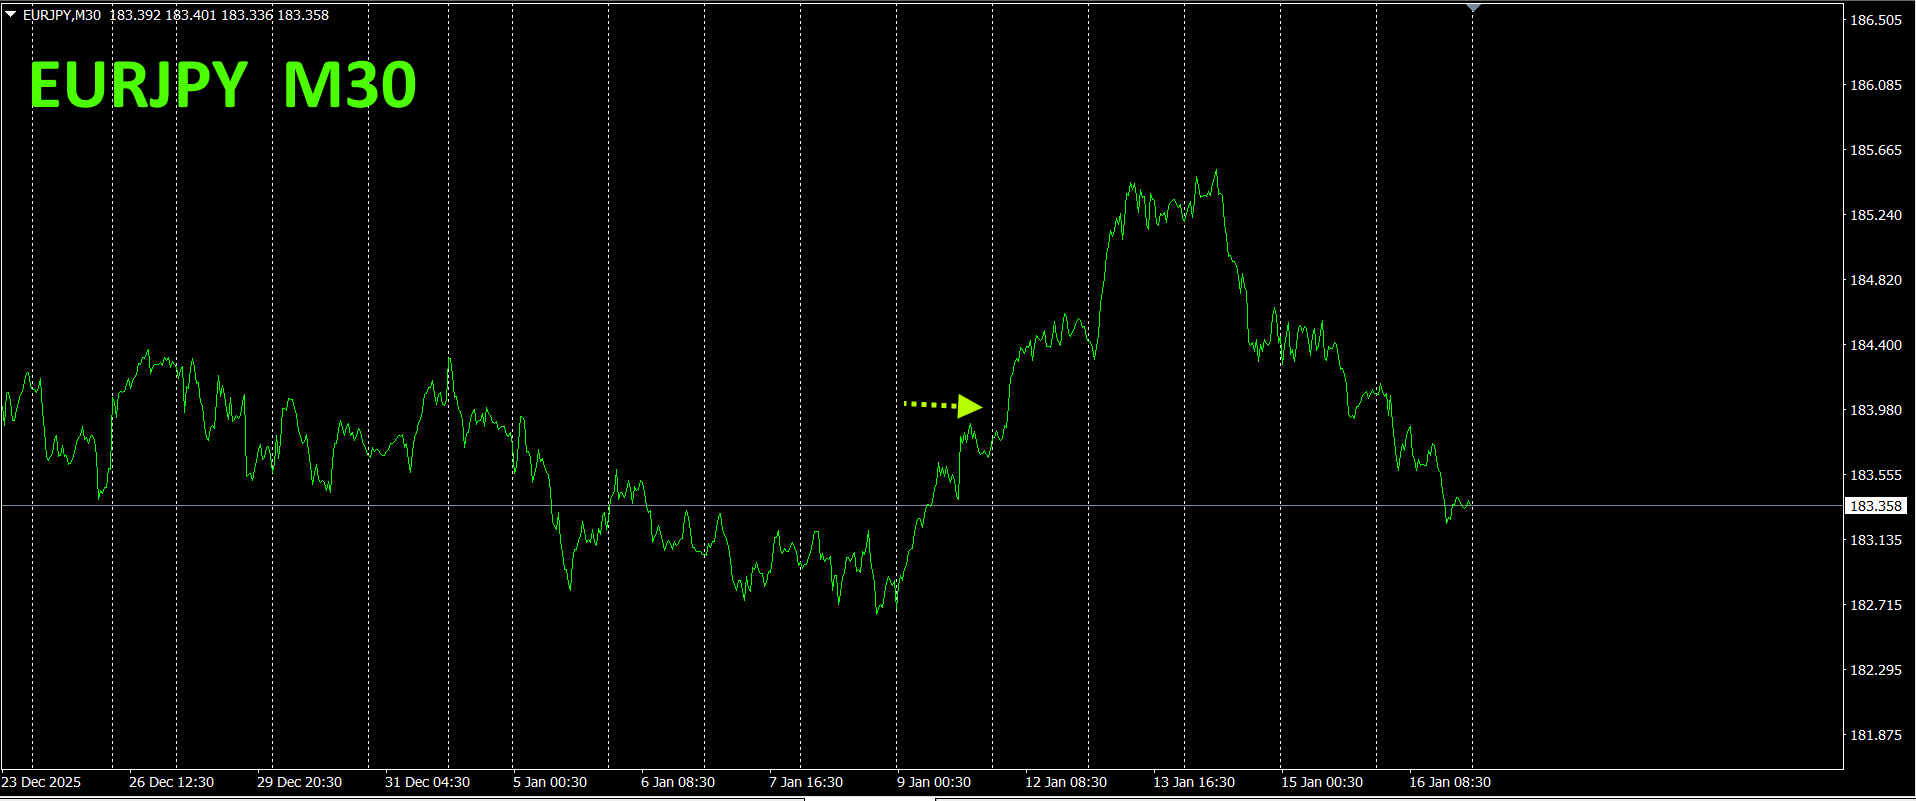
To view the overall trend, a 30-minute chart covering the last about three weeks is drawn
Previously, we wrote the following.
Pink is EUR, green is JPY. EUR and JPY both mostly face horizontally. If anything, since JPY is slightly up, EURJPY is likely to be on a downward trend.
As a result, JPY weakened and rose, then later retraced
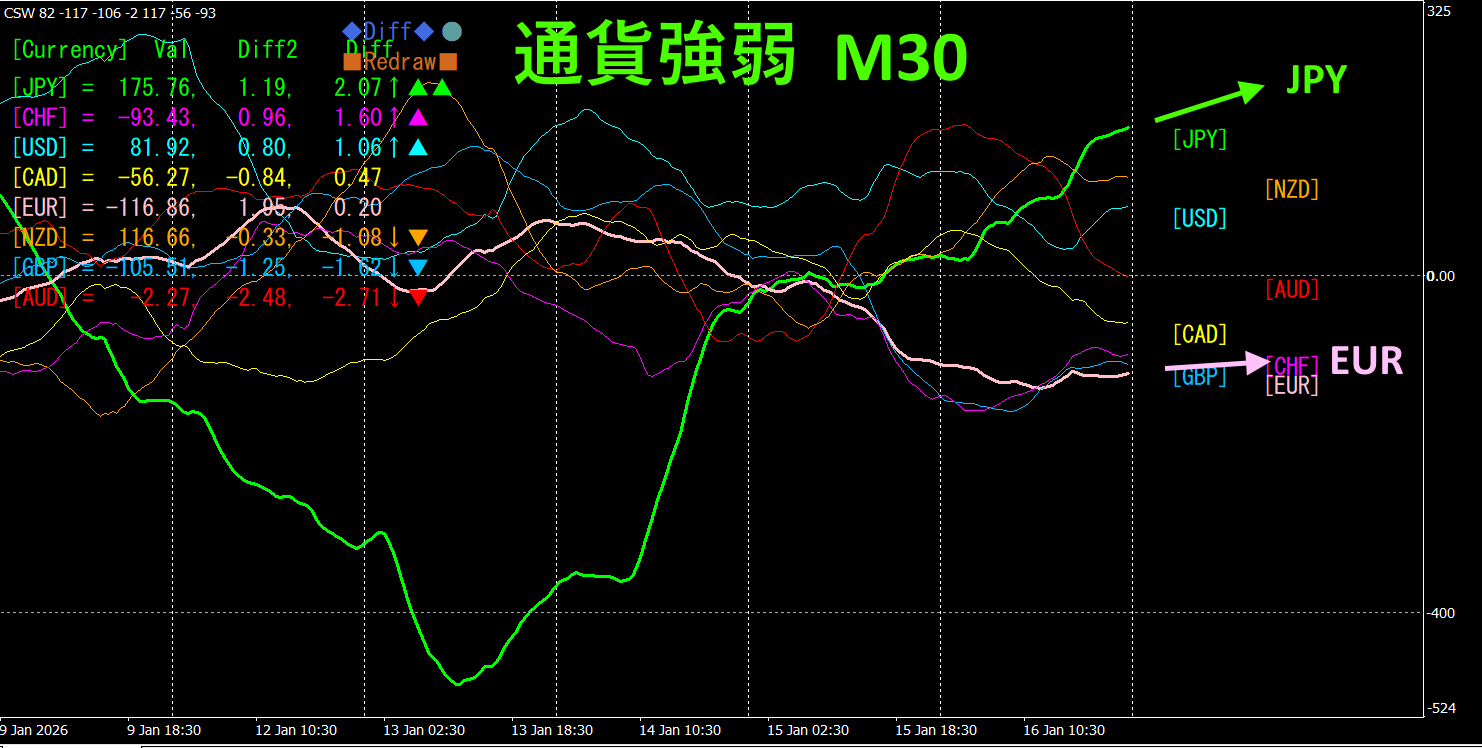
This is a 30-minute currency strength chart
Pink is EUR, green is JPY. JPY has risen sharply, while EUR remains mostly horizontal. Therefore, EURJPY is expected to rise.
4. Try the new indicator Dual_MACD_Trend_Indicator
New indicator “Dual_MACD_Trend_Indicator” is below.
MT4 version:https://www.gogojungle.co.jp/tools/indicators/62199
MT5 version:https://www.gogojungle.co.jp/tools/indicators/62202
It is an indicator that clearly shows the direction of the trend in color. If the color of the bars is Lime, it is a buy; if Red, it is a sell; easy for beginners to use. If the color is green, it's an uptrend; if red, a downtrend; if no color, there is no trend. The color display lets you grasp the trend at a glance.
The red in the sell zone and the green in the buy zone are clearly separated, making trading easy at a glance.In the upper figure, focus only on the parts circled in white ovals; trade buying in the first half of the week and selling in the second half.
With “Dual_MACD_Trend_Indicator”, buy in the green zone, sell in the red zone, and do not trade otherwise.
Using “Dual_MACD_Trend_Indicator” removes any hesitation about trading direction.
5. “Hyper-CSW” has been released
“Hyper-CSW” is a high-performance indicator that can visualize the strength/weakness of the eight major currencies at a glance. It records the strongest currency and score for the past ten bars of the currently displayed timeframe, enabling you to accurately catch trend persistence and turning points. Furthermore, supports multi-timeframe analysis showing currency strength rankings (top 4 currencies) across multiple timeframes such as M15, H1, H4, D1, W1 with scores. With highly visible color lines and a separate window display, it gives you the power to discern market flow in your hands.
For details, please see the following link.

https://www.gogojungle.co.jp/tools/indicators/65082
※Recommended Indicators
“8CFD Visualization Indicator Any Edition””
https://www.gogojungle.co.jp/tools/indicators/32288
“Toretore Indicator”
“TrendLine-EX”

“8 Currency Strength Visualization Indicator” is explained on the following page。

MT4 version https://www.gogojungle.co.jp/tools/indicators/39150
MT5 version https://www.gogojungle.co.jp/tools/indicators/39159
【】


