Environment of USD/JPY, Gold, SP500, and Nikkei 225 on 2026/1/17

『Trendline Pro 2』✖『Dow Jones Break Edge 9』
▶One word◀
『Dow Jones Break Edge』 has added 5→9→line additions.
It effectively has the performance of a Trendline Pro 3.
Since it’s a good opportunity,
from todayProvisional titleTrendline Pro 3, I plan to reflect it on the chart.
By default, it is set to display only the most recent one of the 1–9 breaks.
It can be easily switched with button operations.
▲Light blueis an upside breakout (darkLight blueis a breakout of a reverse triangle)
▼Pinkis a downside breakout (darkPinkis a breakout of a reverse triangle)
■ Triangle consolidation (a small white circle appears on the chart)
Dollar/Yen
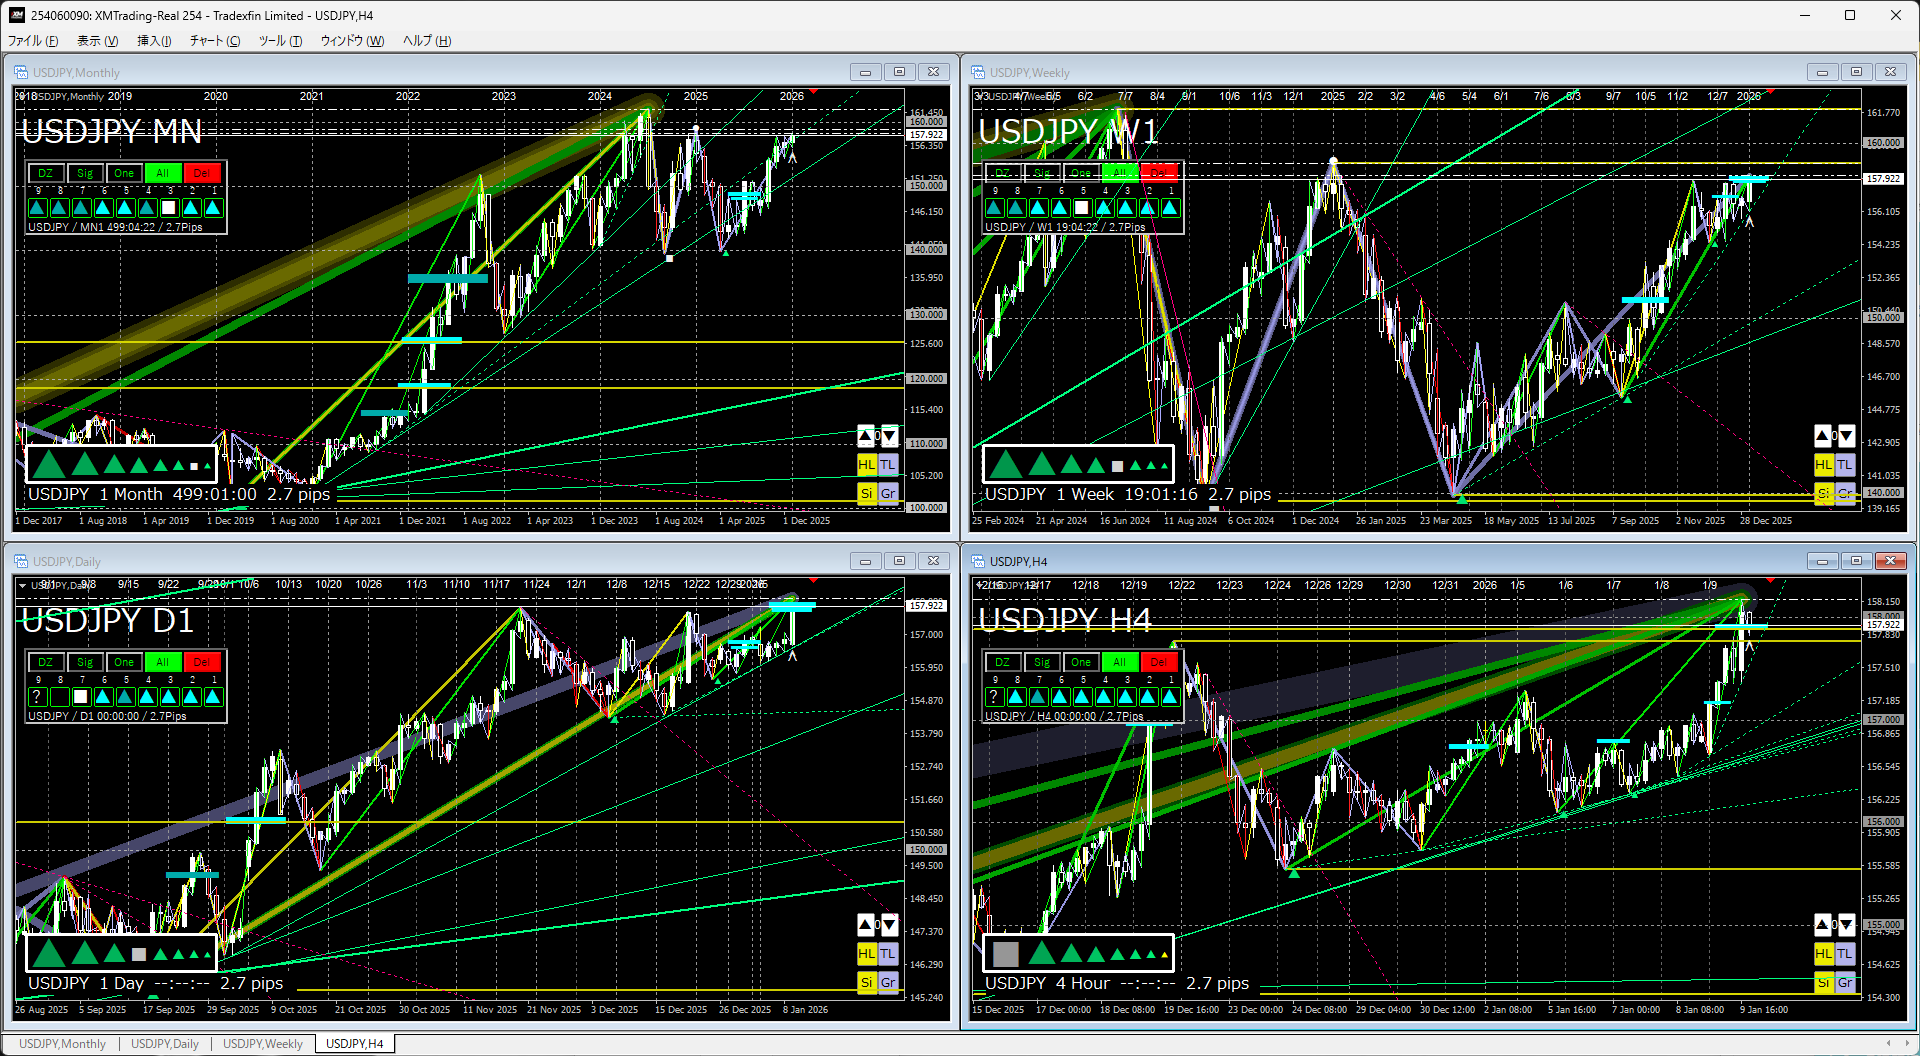
↓Last week's chart↓
↓This week chart↓
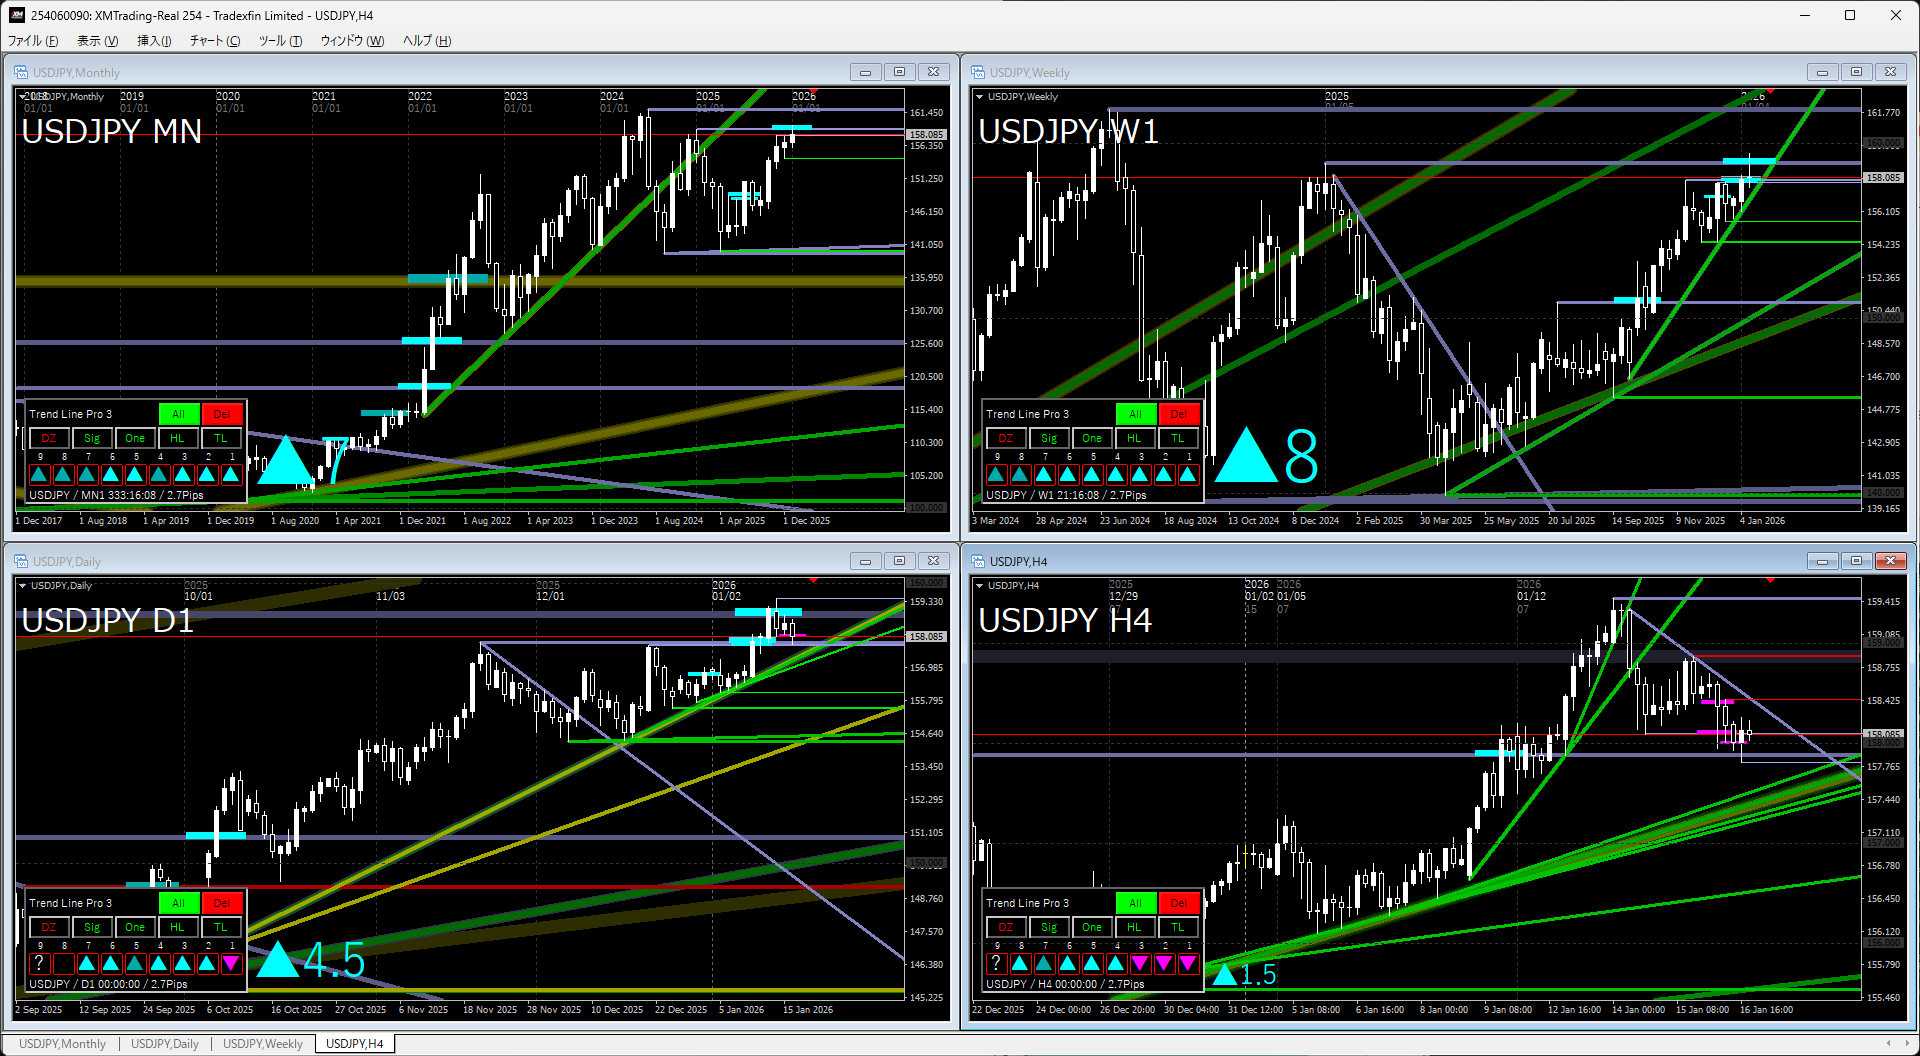
Monthly & WeeklyThere is no change in the image since last week.
It broke above the recent high, making a yen-soft direction more likely.
However, since it pulled back just after breaking out, we should be wary of a temporary larger pullback.
Daily & 4-hourLast week, we imagined it would test the next high.
The target high was easily breached, but immediately it pulled back and fell after touching the next target high.
Rather than aiming for the next high, there is a possibility of a temporary correction.
Gold
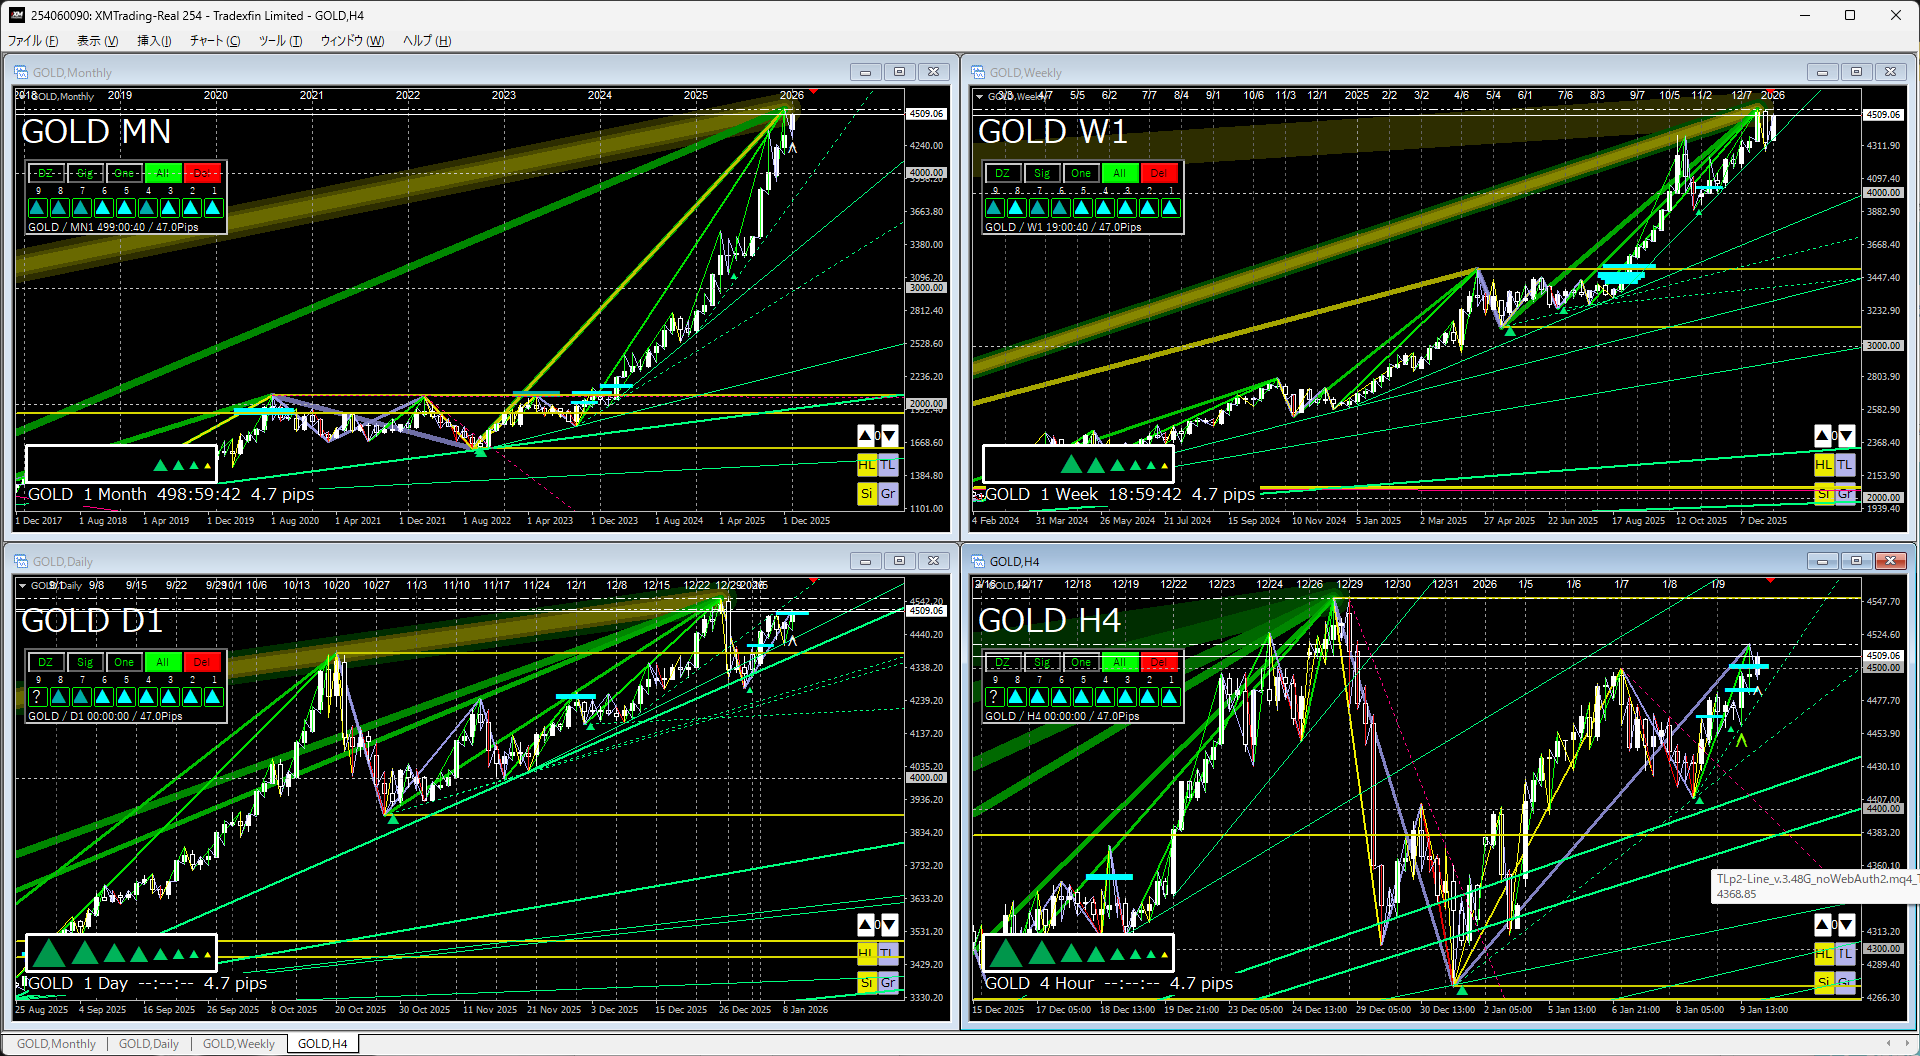
↓Last week's chart↓
↓This week chart↓
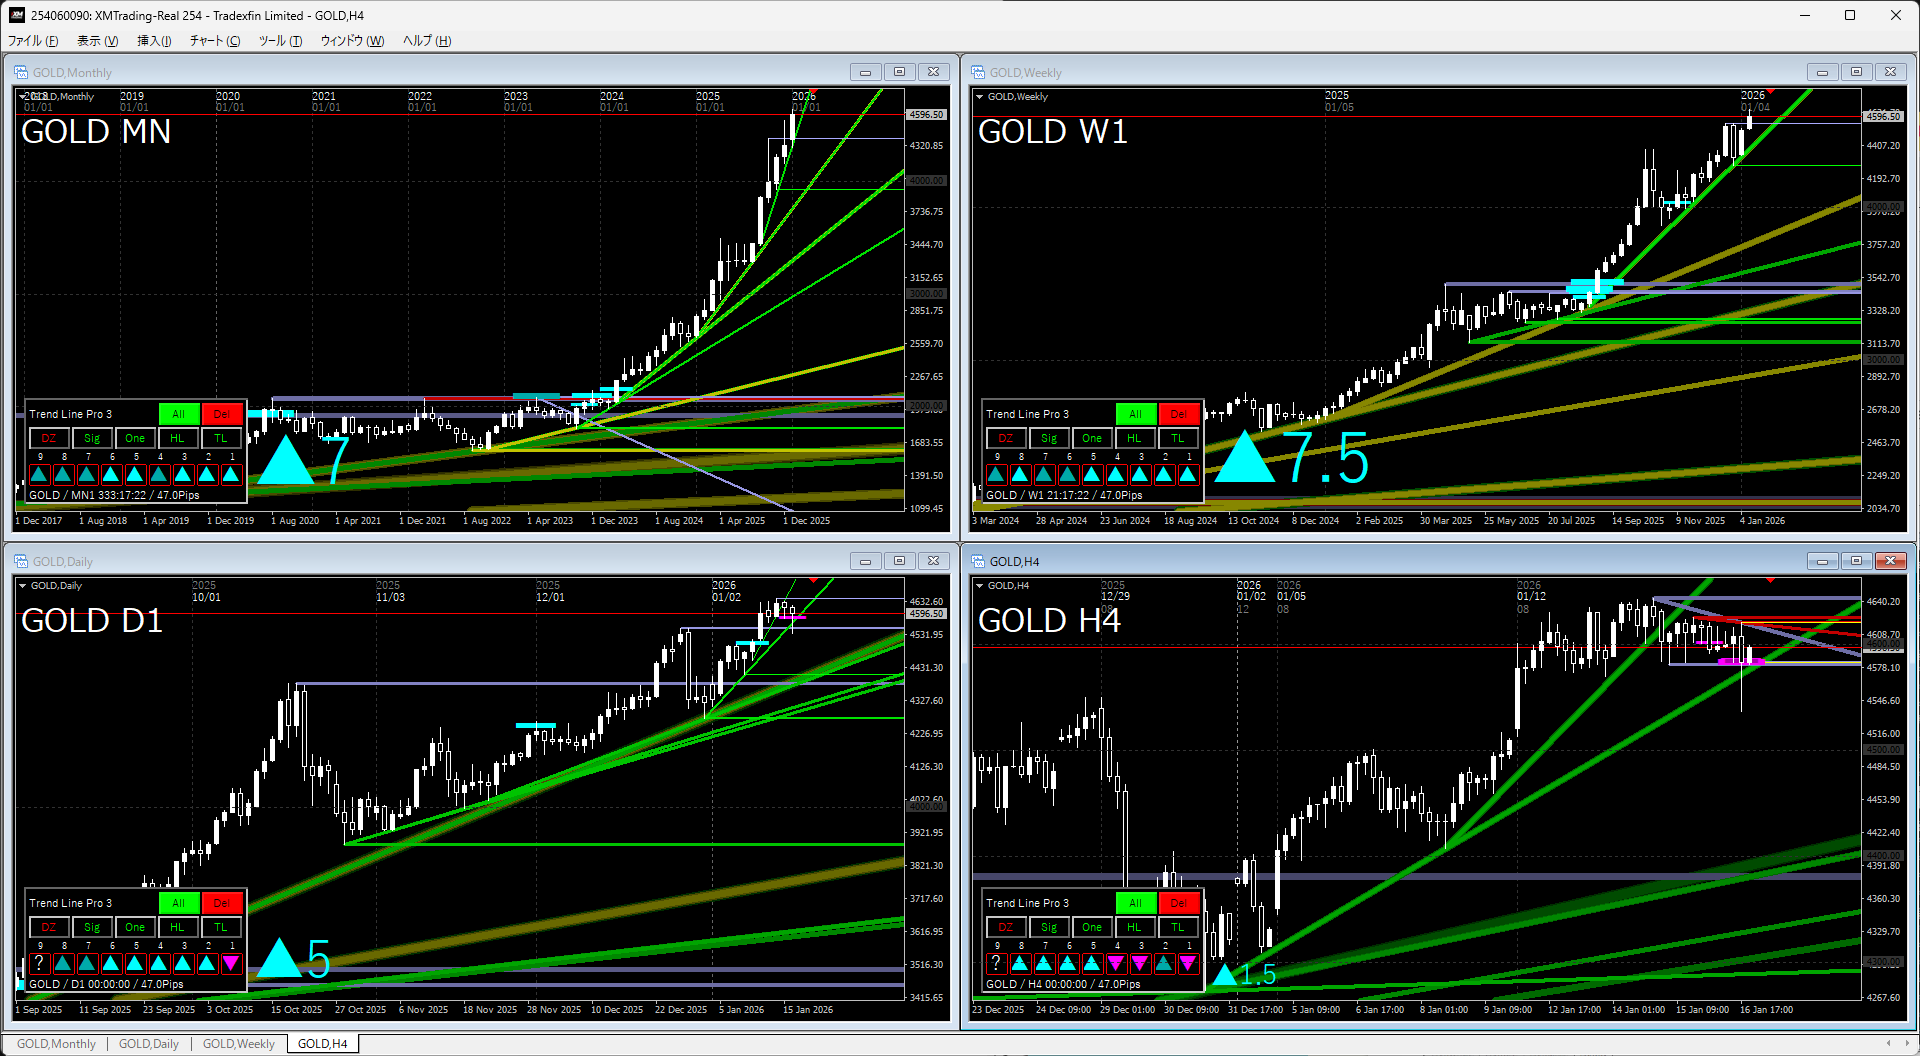
There has been no change in image since last week.
Gold remains a single-buy environment.
This does not mean gold is rising; it’s generally viewed as currency value is falling.
Since there are few sellers, the stance of buying on a big pullback (wait) may not be appropriate.
S&P 500
↓Last week's chart↓
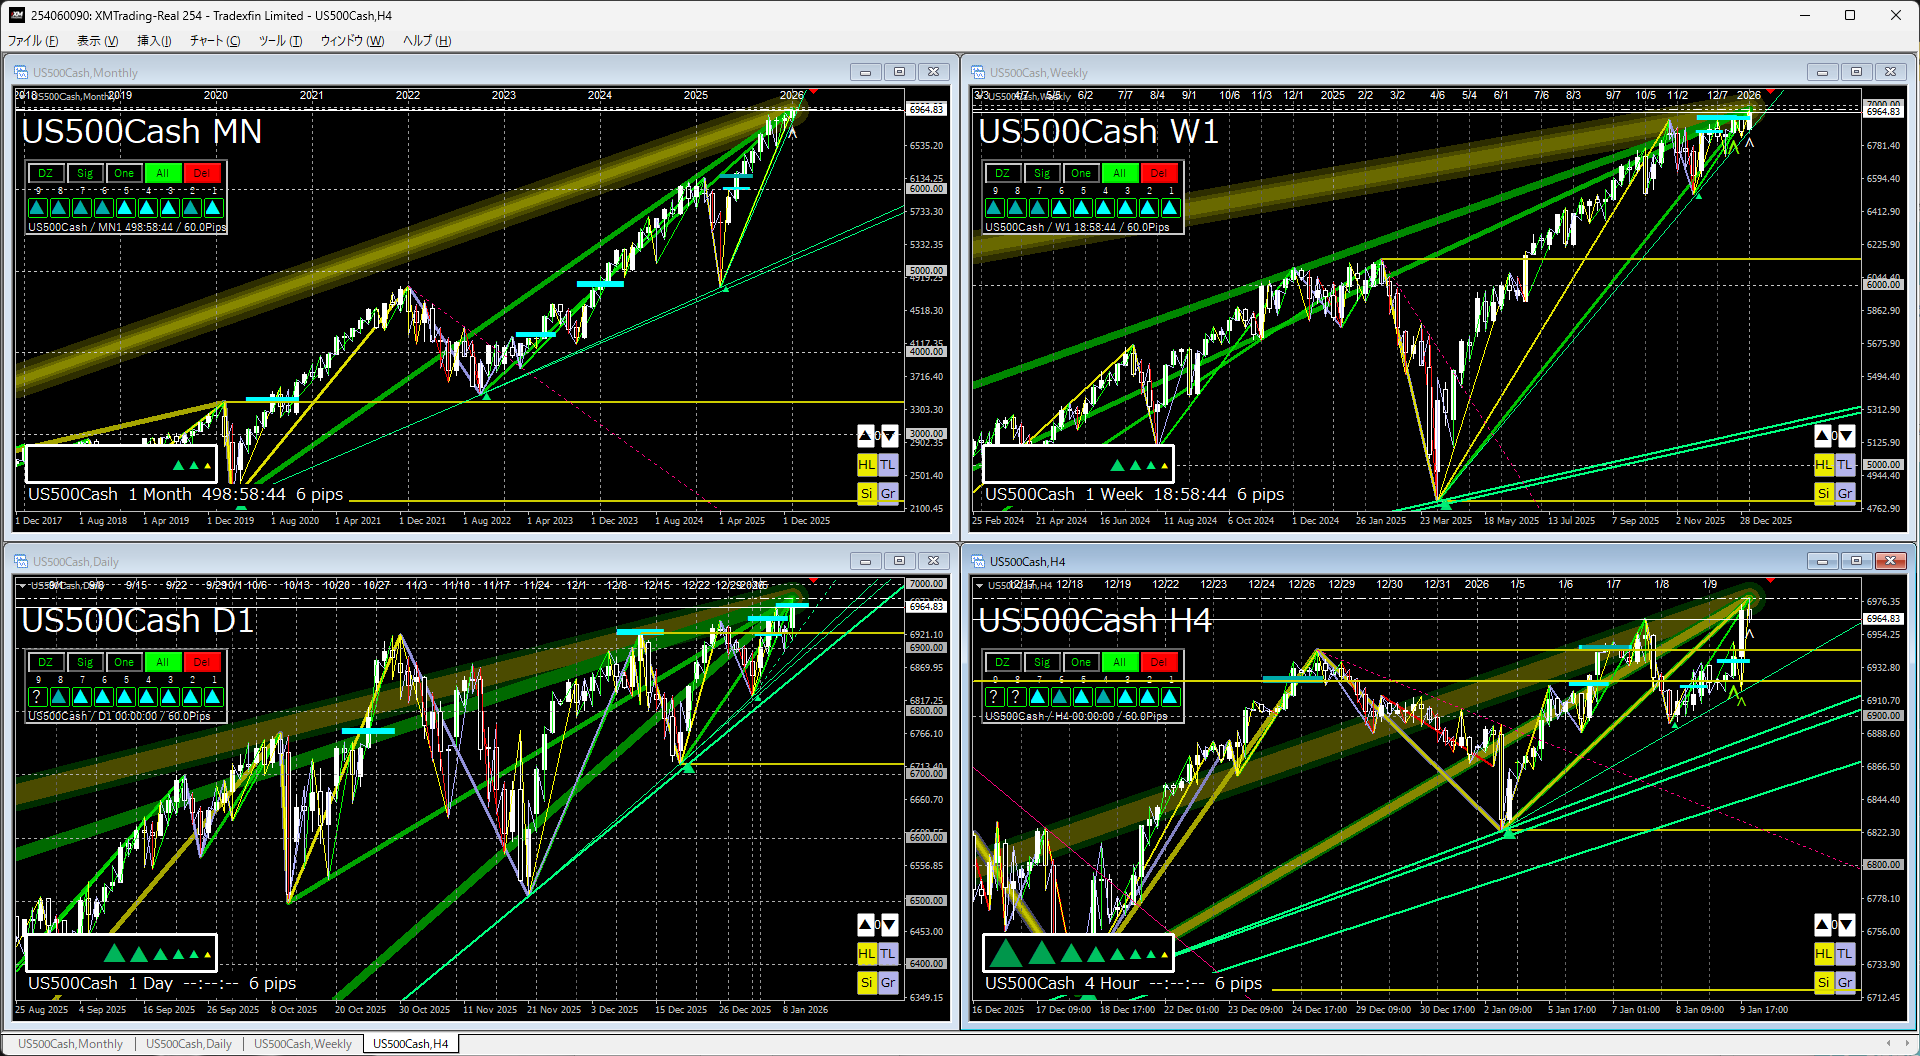
↓This week chart↓
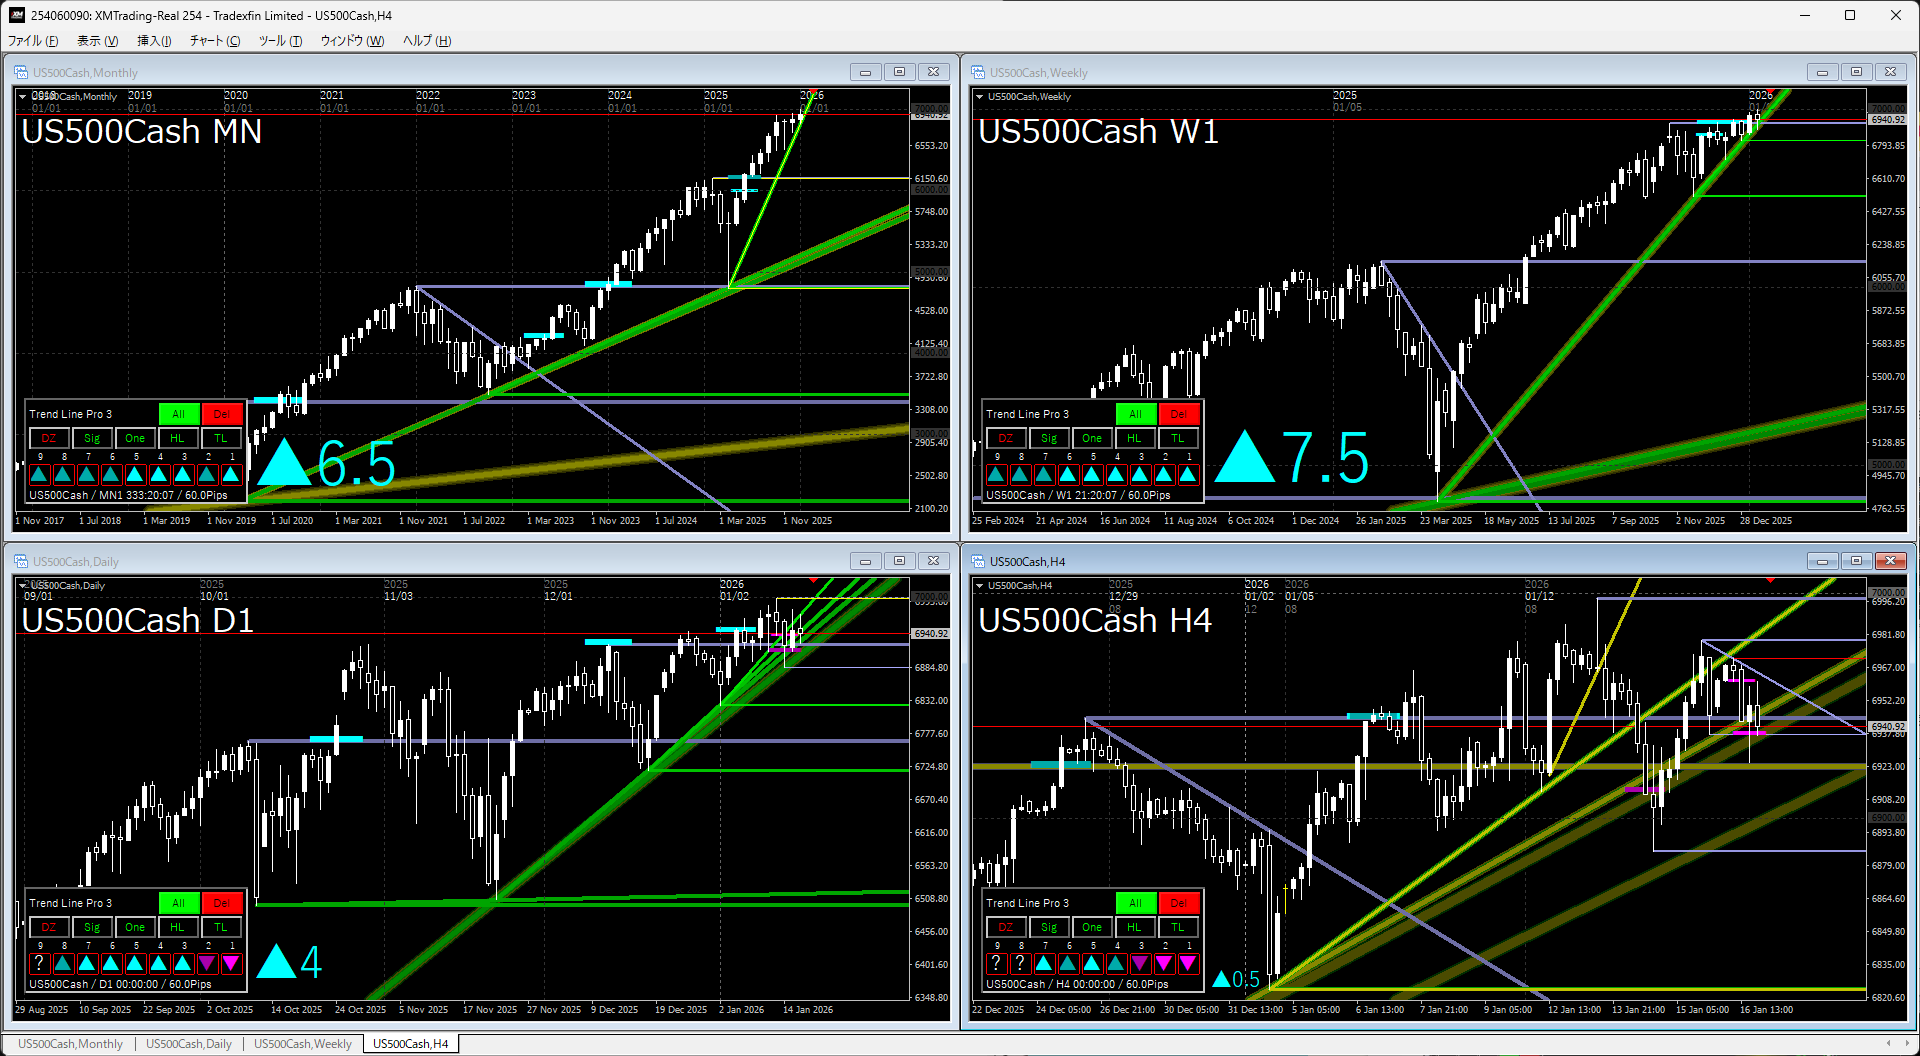
Monthly & WeeklyThere is no change in image since last week.
After a bounce from the trendline, the uptrend continues.
As noted for gold, many view currency value is decreasing, so the market generally tends to rise.
Daily & 4-hourLast week, we imagined a continued rise if nothing happened.
It’s almost flat, not really falling.
Nikkei 225
↓Last week's chart↓
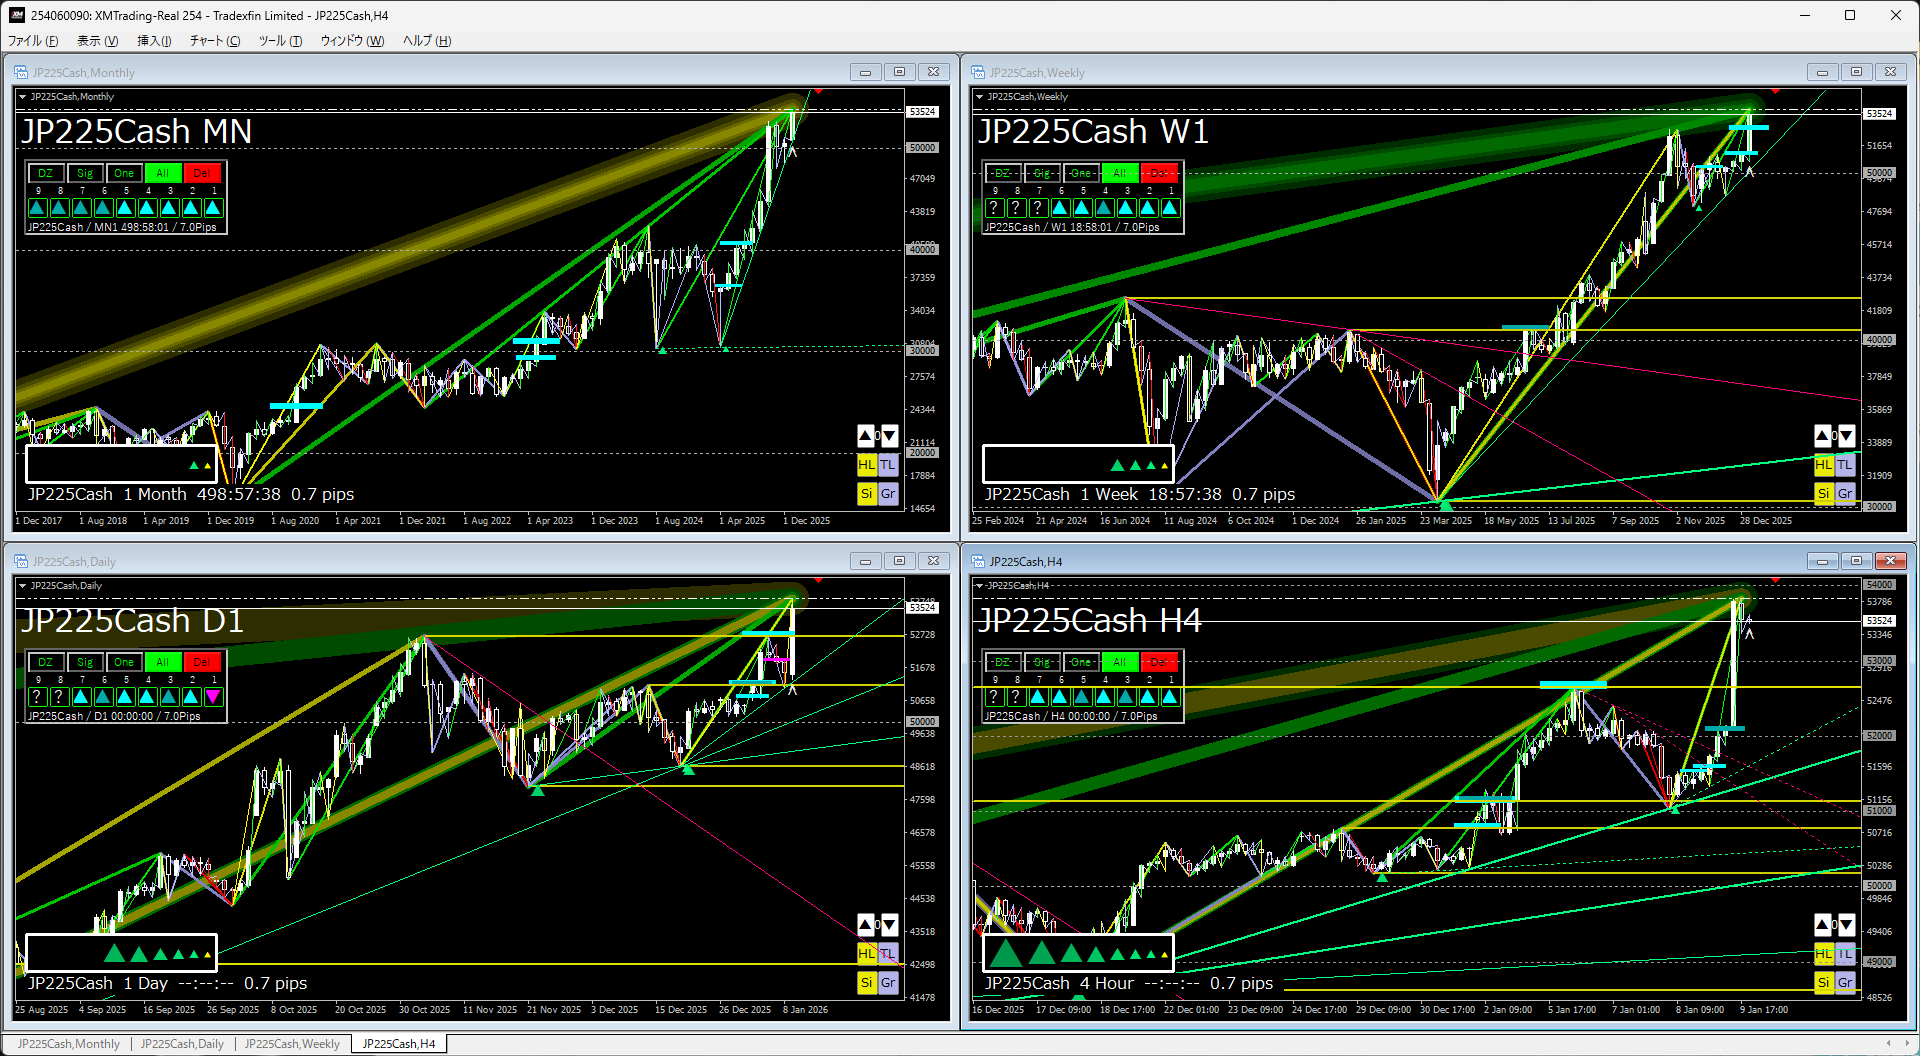
↓This week chart↓
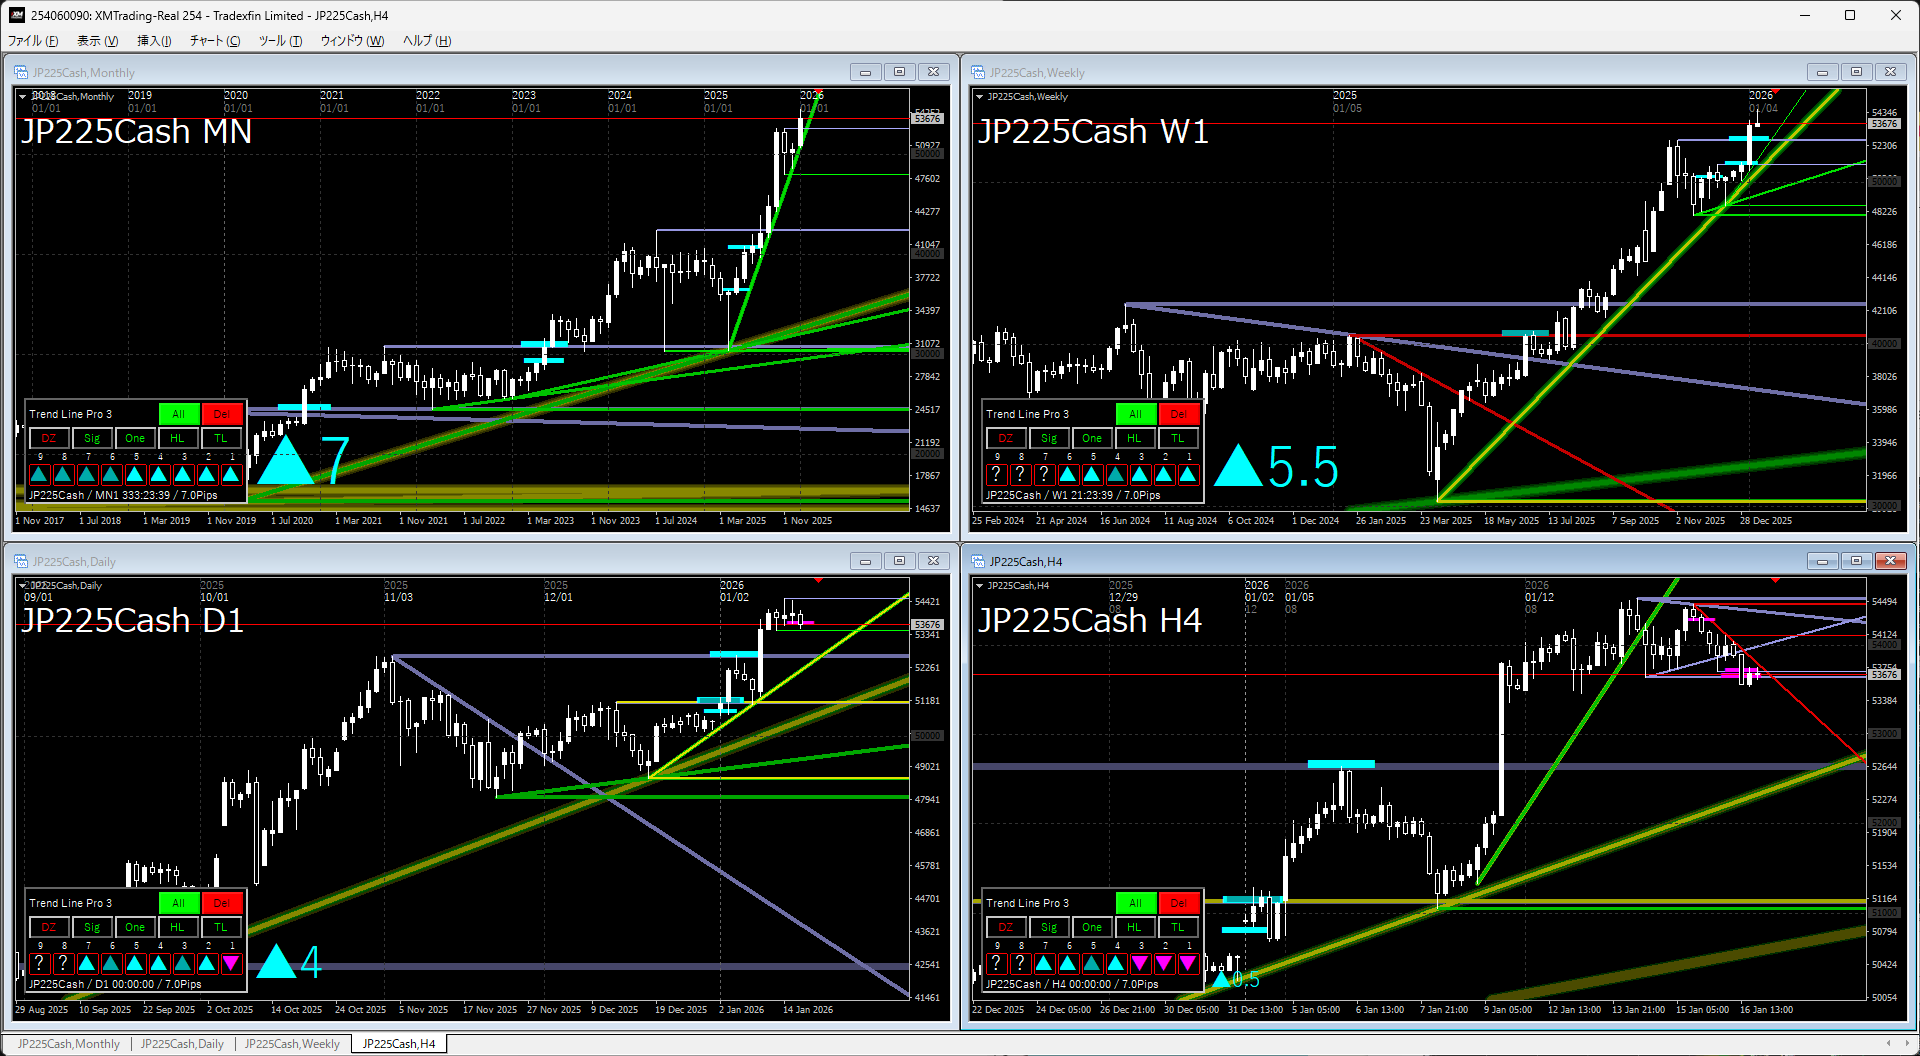
Monthly & WeeklyThere is no change in image since last week.
It is in a strong uptrend after a double bottom breakout.
The trendline looks clean, so if it breaks below, the pullback could be large.
Daily & 4-hourLast week, we imagined whether it would rise sharply or not.
The flow was basically a time-based consolidation and sideways movement, but even after the time-based consolidation ends, whether it goes up needs assessment.
This might be a temporary high, which should be watched.
The indicators in the attached image use two indicators below.
If you are interested, please take a look.
‘Trendline Pro 2’✖‘Dow Zagu Break Edge 9’
If you would like to continue reading this articlein the futureas wellplease press the buttonand let us know.
If you have any requests such as liking this kind of article, please feel free to tell us.