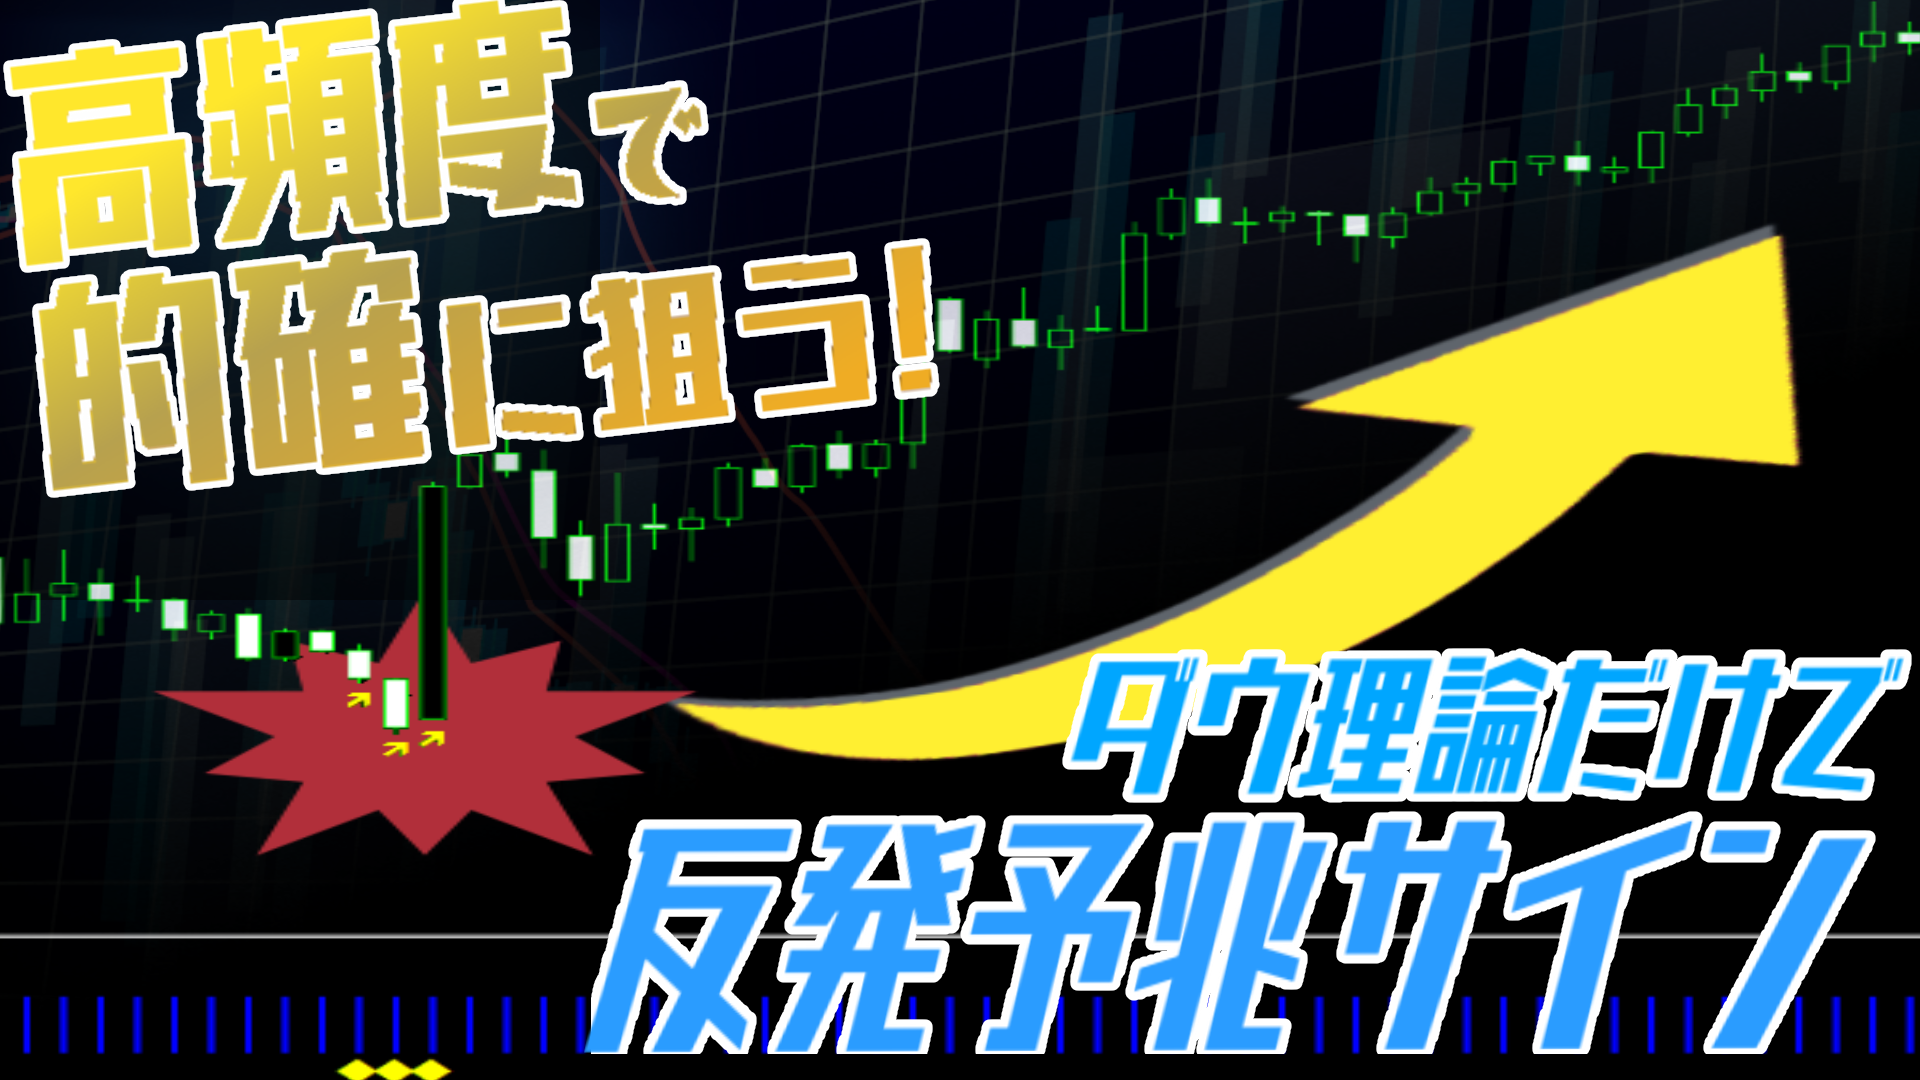
Astonishingly captures the ceiling!? A sign indicator【DowRebound】that accurately predicts a rebound (pullback) using Dow Theory
Everyone knows Dow Theory, capturing accurate rebounds (pullbacks)
“DowRebound”
Using the essence of the market to foresee rebounds (pullbacks) at important price levels.
Its edge cannot be realized by signals from oscillators and the like
A signal indicator that seemed possible but rarely seen!
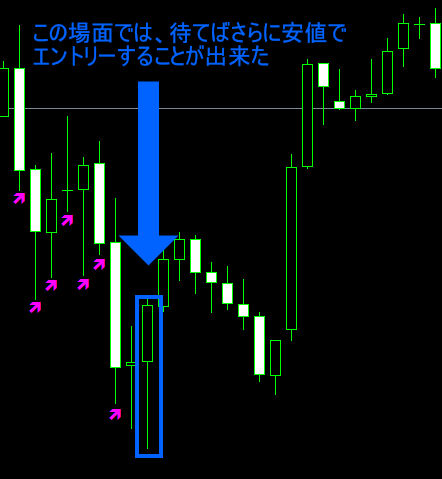
First, please take a look at this chart image.
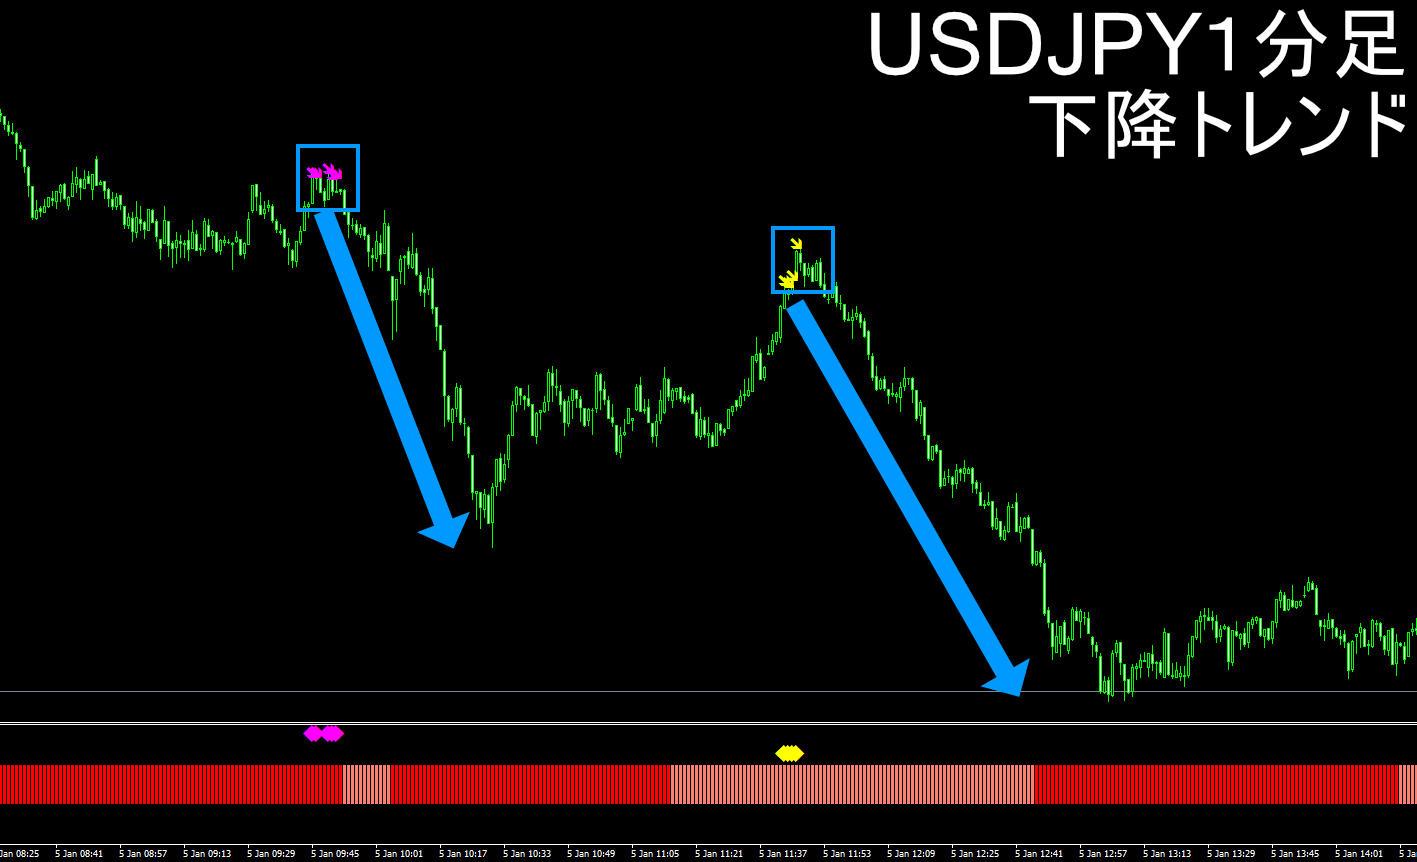
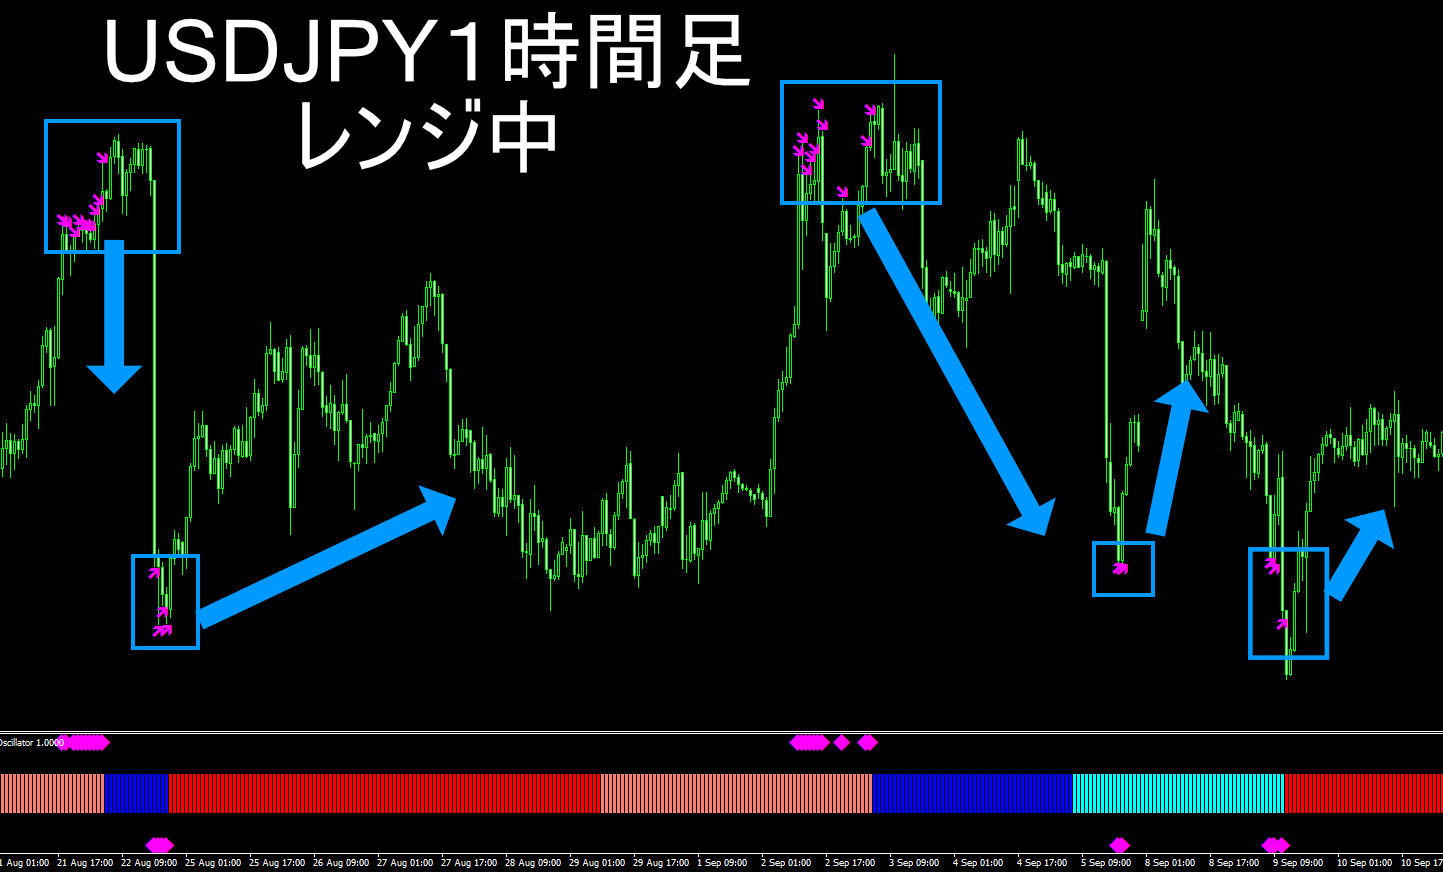
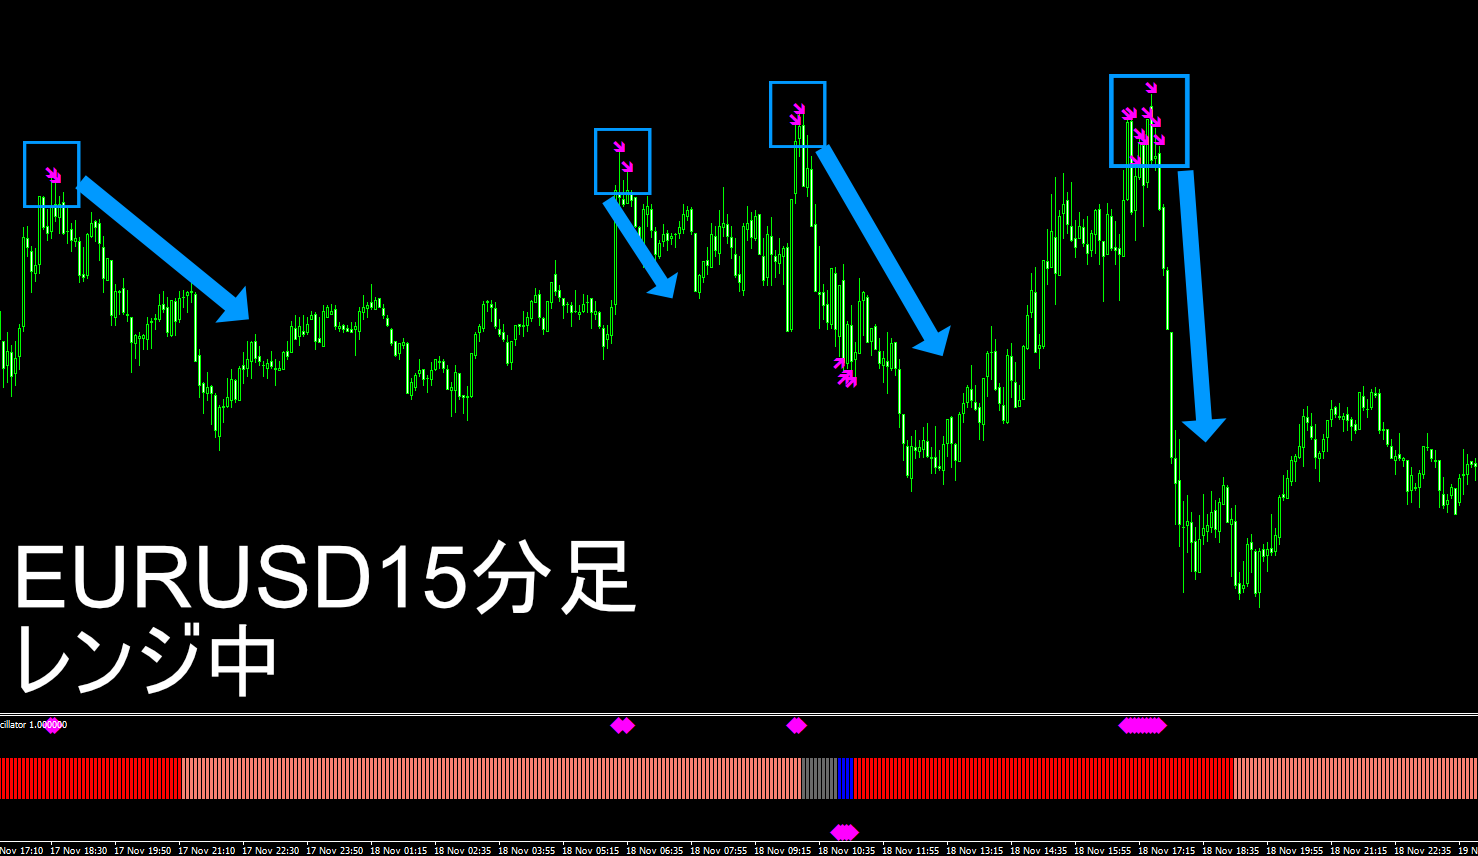
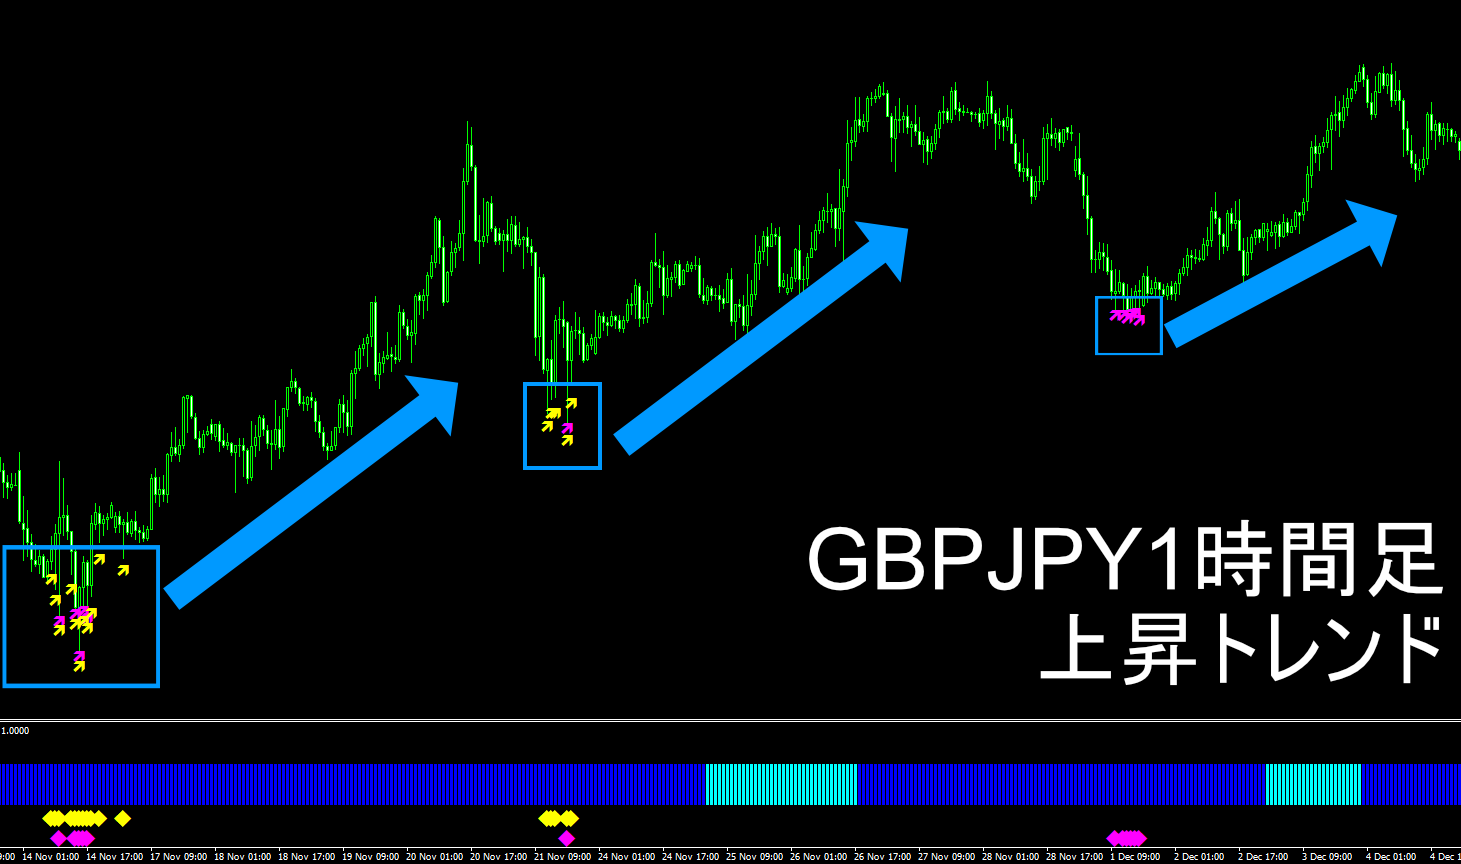
In ranging phases it captures the top, and in trending phases it captures pullbacks effectively, as you can see.
Of course, what is most worrisome with signal indicators is
No past repainting at all!
As shown in the image, the signal frequency is not low either.
It is a superb signal tool that cannot be realized with the oscillator logic used in common signal tools.
By the way, if you entered on the Dow/JPY four-hour chart exactly as the signal indicates…
Depending on the settlement rules, as of January 6, 2026, the profit would be
Amazingly around 3800 pips
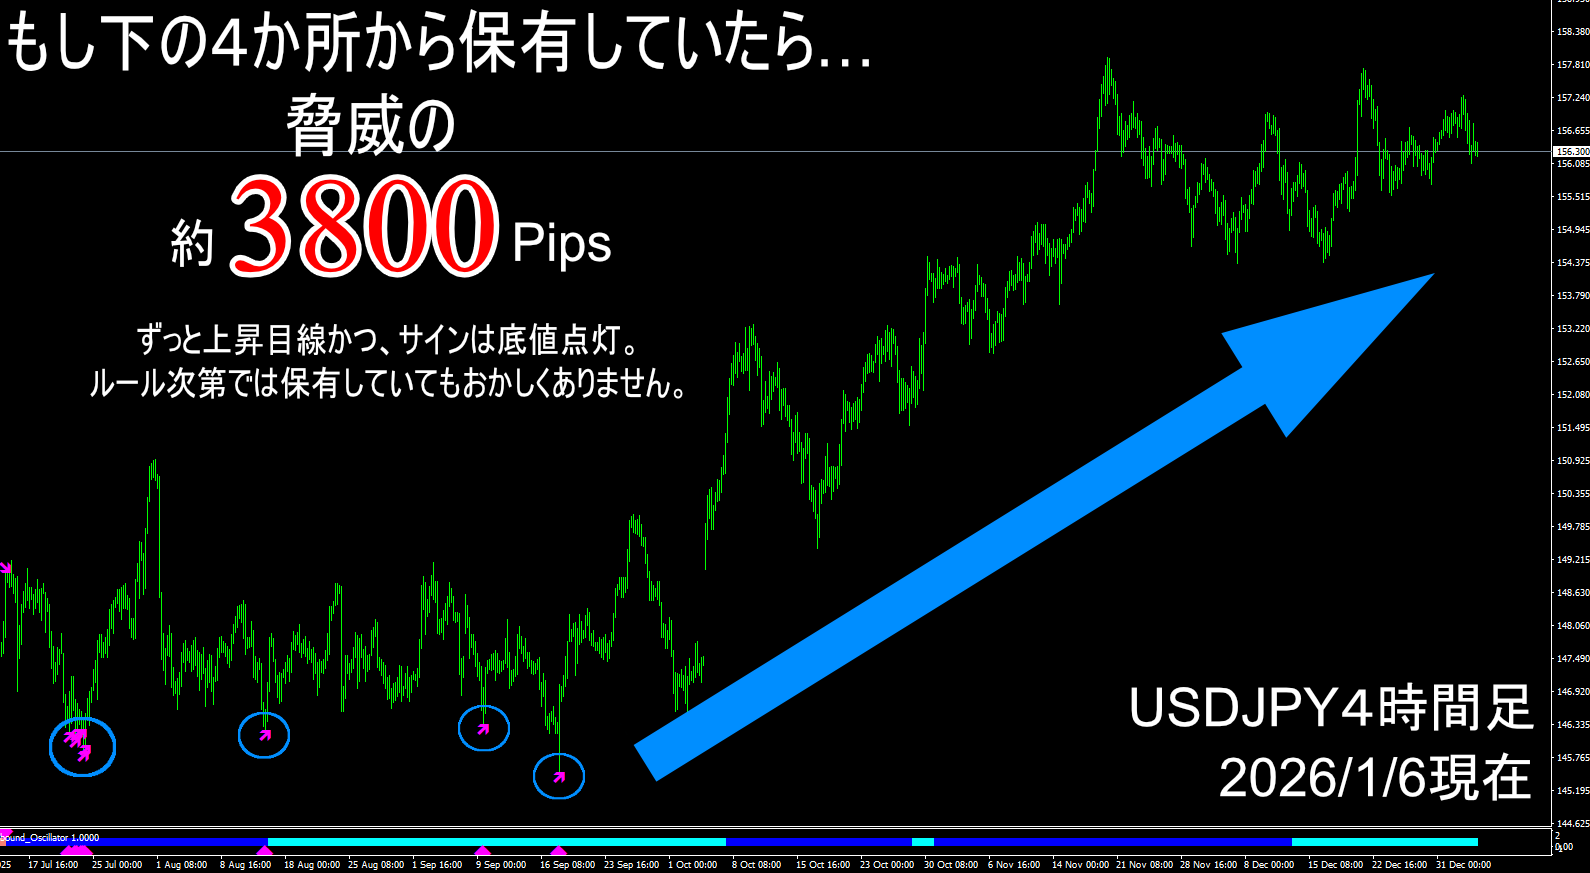
It may sound a bit jokey, but in the chart shown, the perspective is always bullish (upward), and moreover
Since all signals light up at the bottom price, the chance of a stop loss is almost zero.
Depending on the take-profit rule, it may be possible to hold.
Simple logic using Dow Theory, support/resistance, and crowd psychology
DowRebound uses Dow Theory to determine trends and ranges, and in that process targets important price levels (support/resistance) where orders may have piled up, i.e., locations with potential buy/sell orders.
Support/resistance is considered the most advantageous technical analysis as it is closely related to the market’s essence, crowd psychology, indicating where prices may no longer rise (or fall).
Oscillator-based signal tools are mostly lagging indicators that show signals after candles form (the price moved and the oscillator followed).
If no one is paying attention to that price, the rate may continue as is.
And many people find themselves stuck in a high price (low price) when entering in that direction.
Because DowRebound targets points that many participants are paying attention to, it is less susceptible to the above issues, and more often lights at bottom price points.
Also, since support/resistance is a leading indicator unlike oscillators, signals tend to light up before a rebound is confirmed, which is another hallmark of DowRebound.
Key points of DowRebound logic
“Using Dow Theory and support/resistance yields very high edge”
“Unlike other signals, it’s easy to target both ranges and trends”
“Signals light up before a rebound (early light), yet false signals are unlikely”
“Signals light up at bottom price points, making risk-reward favorable”
“Since it’s grounded in market essence, there’s little chance it will someday become unusable”
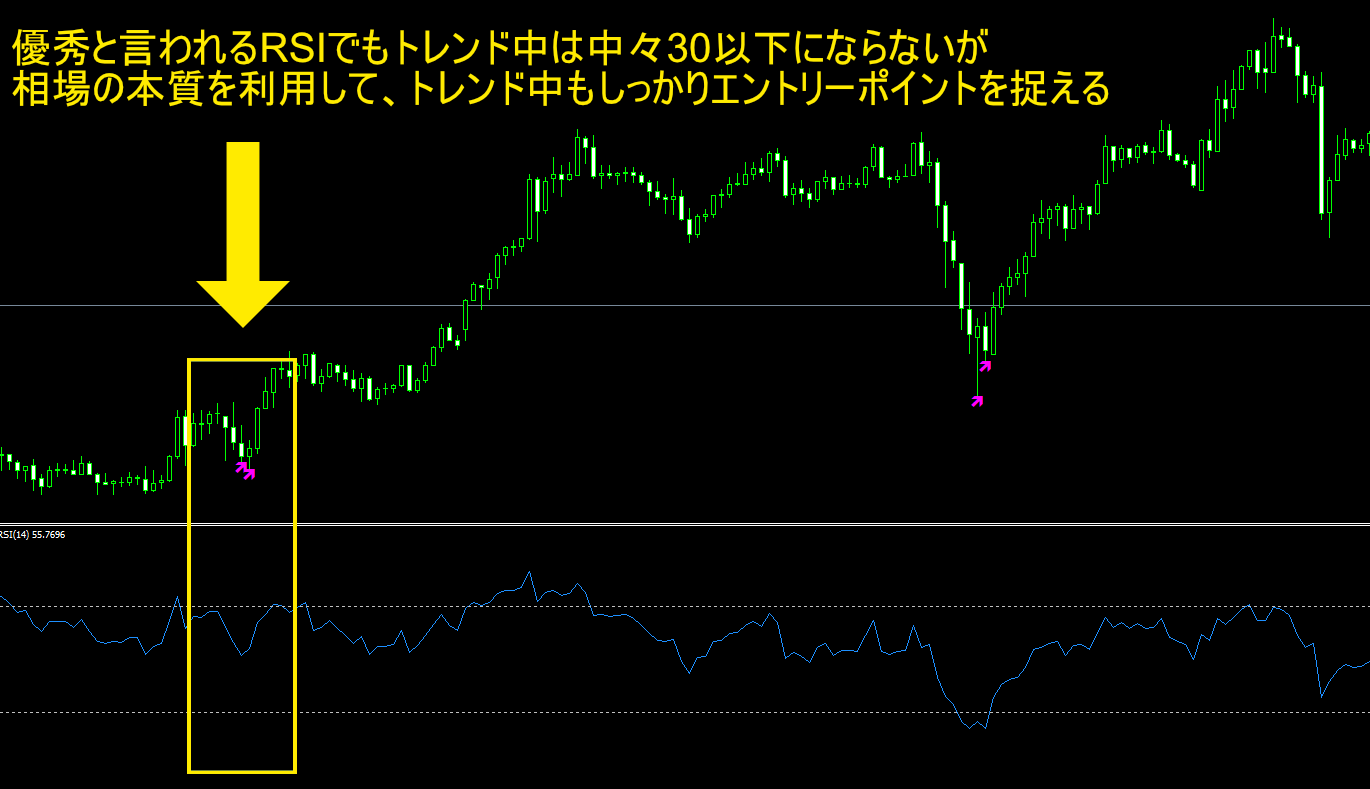
Oscillators light up signals when overbought/oversold regardless of market state, so even in uptrends you often see selling signals appear frequently as in the image below.
Also, during a trend, you may still get caught buying at a high or selling at a low.
However, since DowRebound is predicated on Dow Theory, during trends signals tend to light only for pullbacks or retracements in that direction.
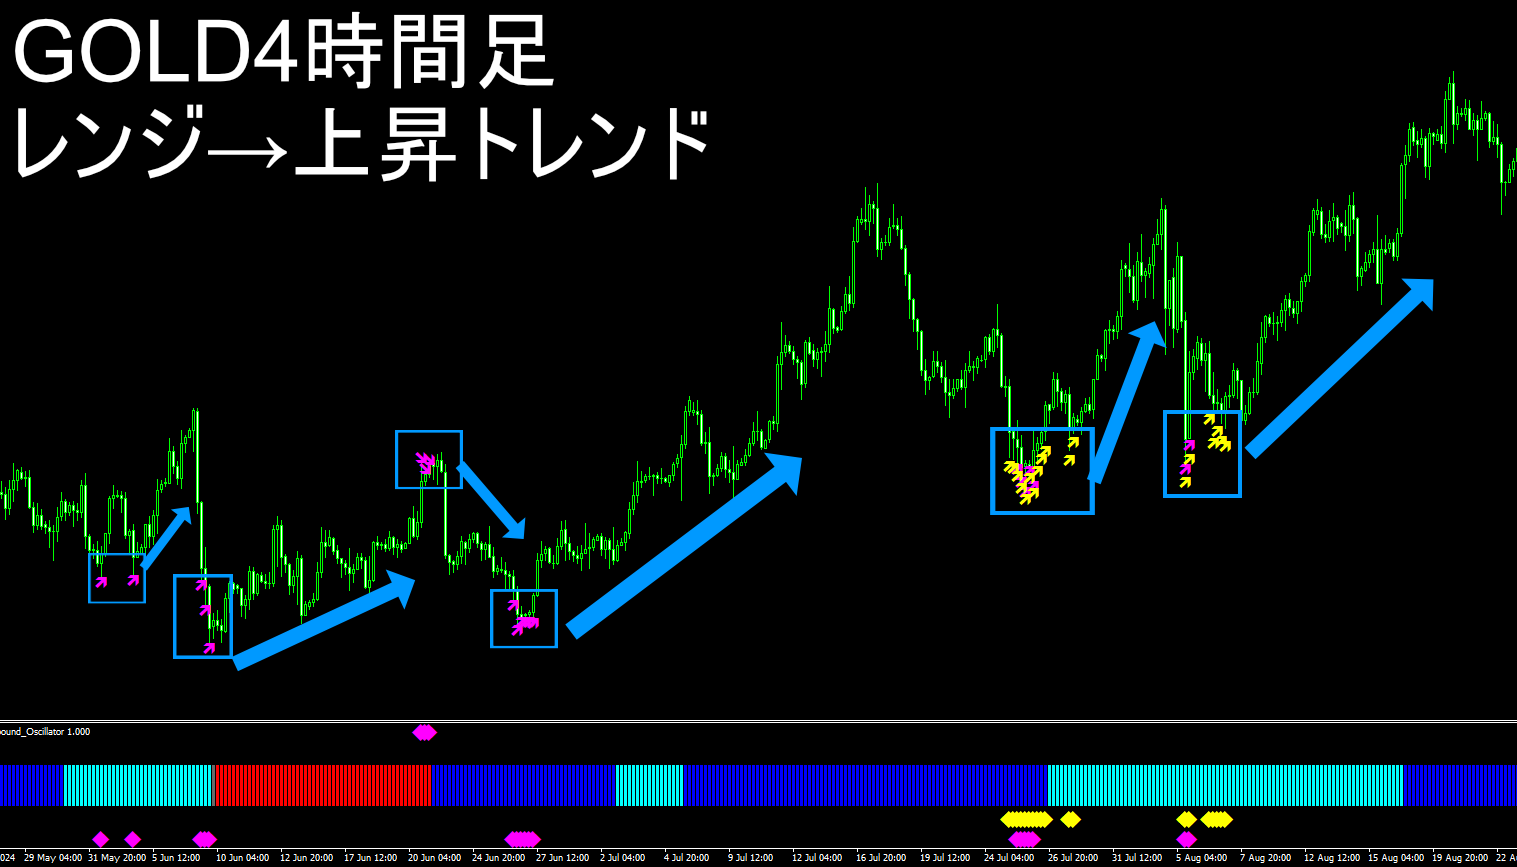
↓ Even in popular gold, it’s like this! ↓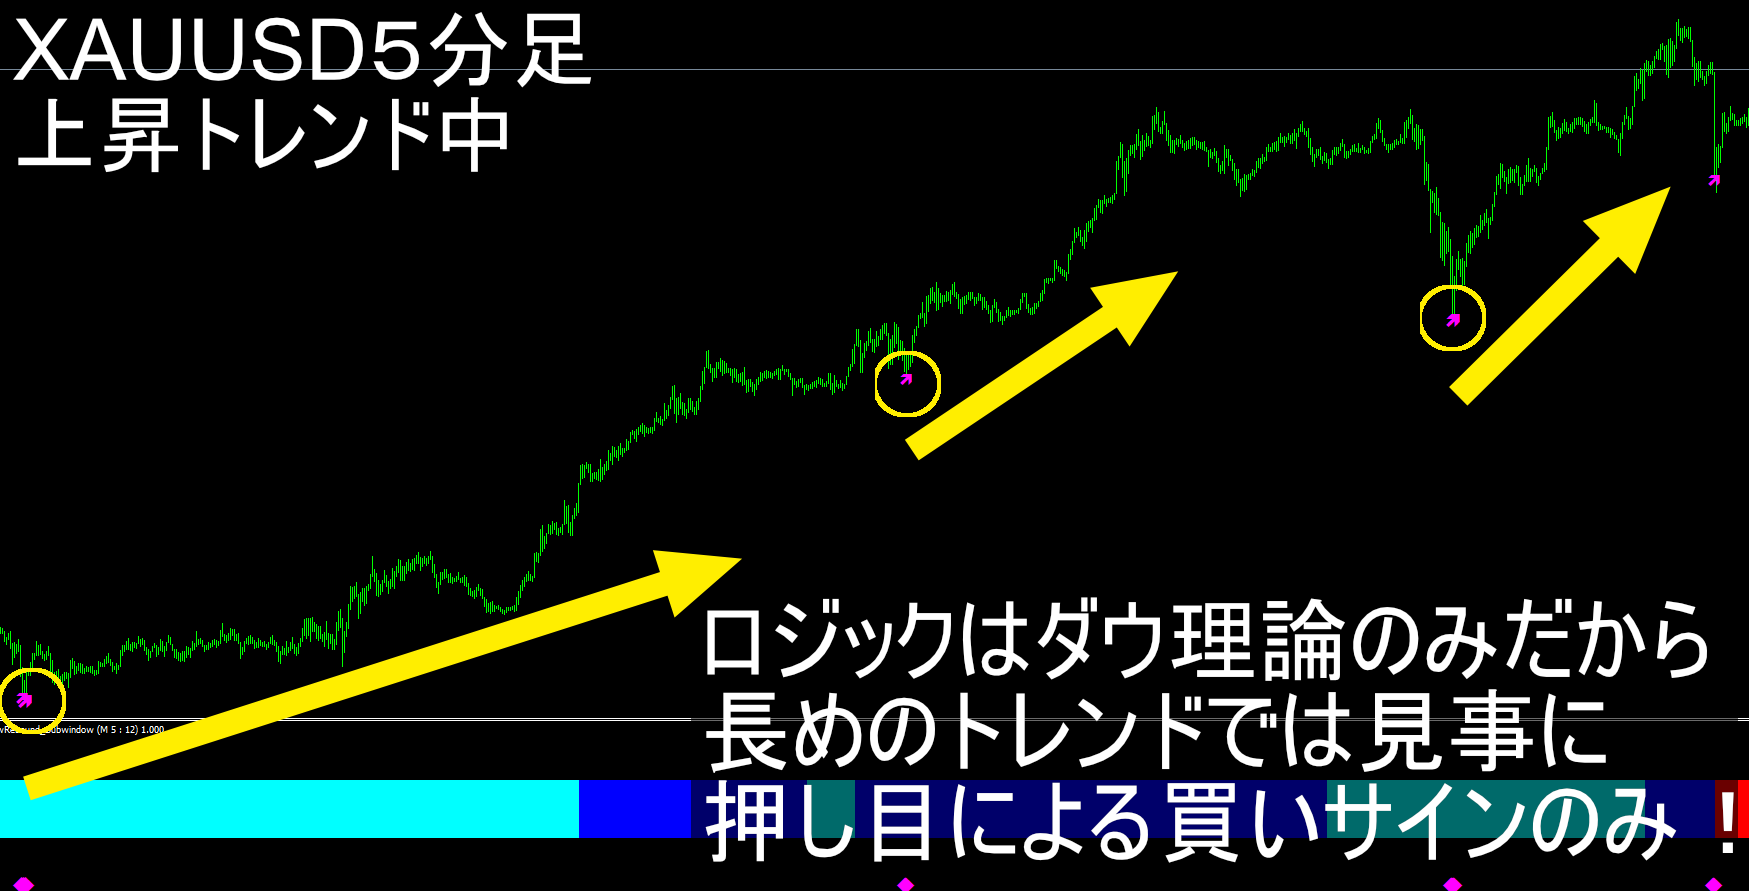
Two types of important price-level signals
DowRebound is based on Dow Theory and support/resistance logic, and there are two types of signals.
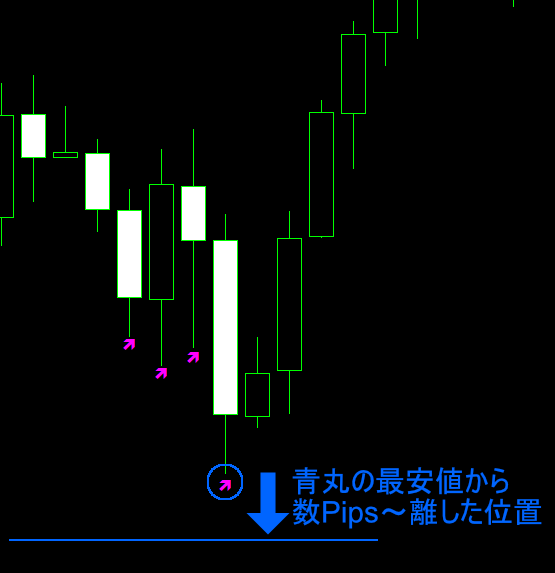
【1】Signal at price band where orders are expected to accumulate in the current buy/sell direction (pink arrows in product overview image)
【2】Signal at price band where orders are expected to accumulate in the opposite immediate buy/sell direction (yellow arrows in product overview image)
Using these two allows high signal lighting accuracy without greatly reducing frequency.
Also, 【2】 lights only when multiple supports/resistances align, acting as a filtering mechanism.
Note: this alignment determination refers to the point where the trend movement toward the direction of the current buy/sell accelerates (extreme high/low points).
Early signs of rebound via leading indicators
DowRebound lights signals early because the target rate is predefined, allowing early detection of a rebound (pullback).
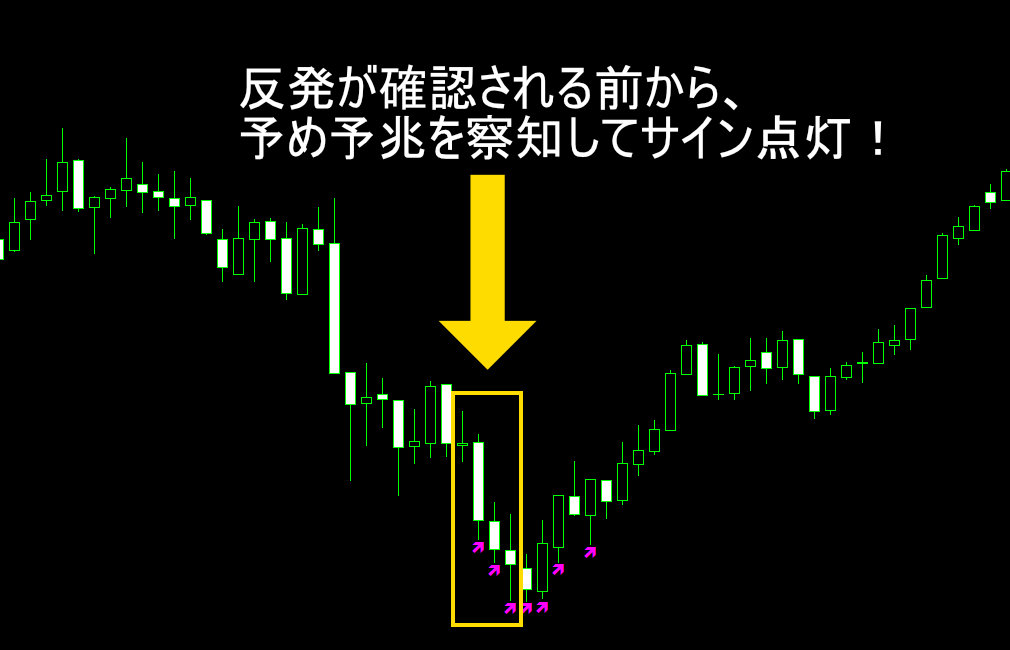
If a candle exists near the target rate, the signal may light consecutively, making pre-entry preparation easier and also serving as a filtering mechanism for other methods.
MTF filtering enabled by the advantageous logic
DowRebound can be set to all timeframes, including those smaller than the displayed chart.
Thanks to this edge and high accuracy, filtering using MTF signals is exceptionally effective.
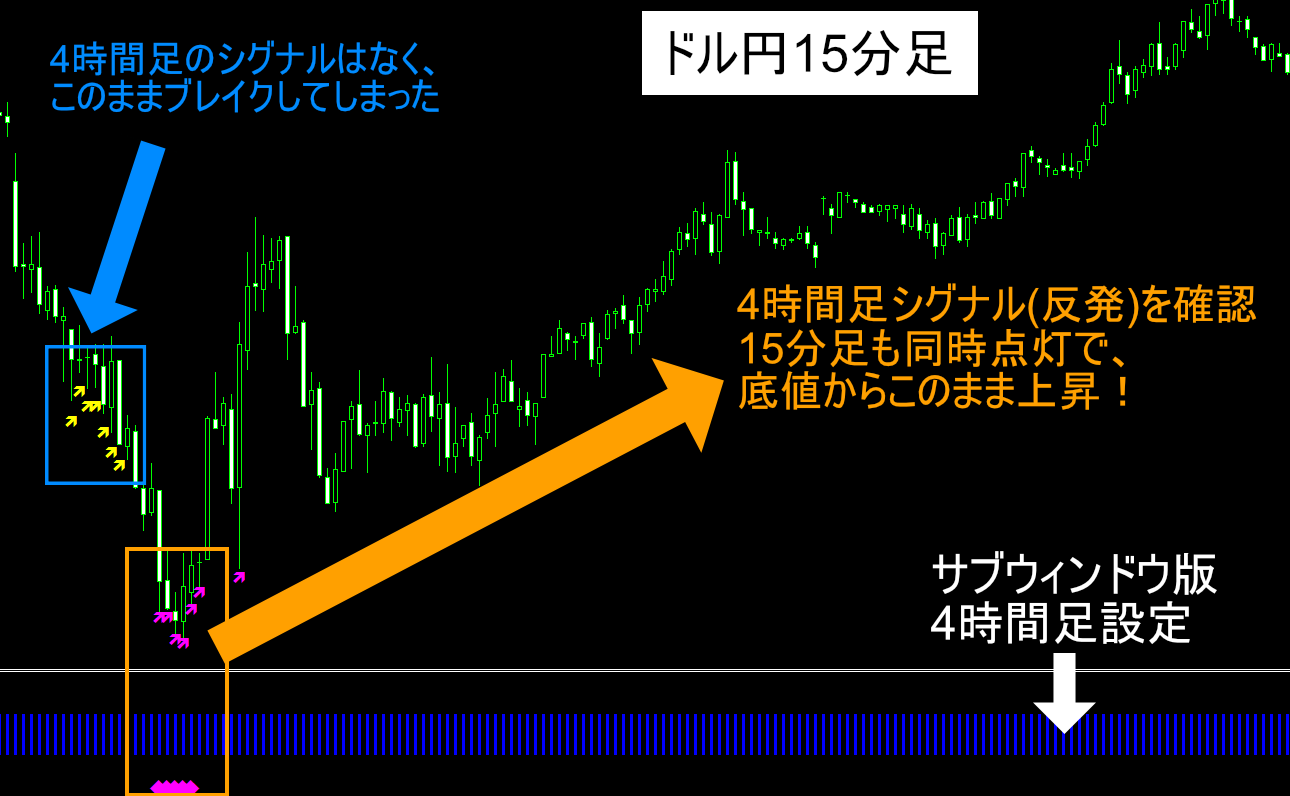
Also, because the targeted price band has orders piling up, even if MTF breaks, the displayed chart may temporarily rebound, which is a major appeal not achievable with oscillators.
This is another major advantage.
Oscillator-based filtering adds little value no matter how much you add. Yet DowRebound enables filtering with the market essence and support/resistance to realize genuine advantage.
If you already have a rough method but want a distinctive, advantageous filter, this product is highly recommended!
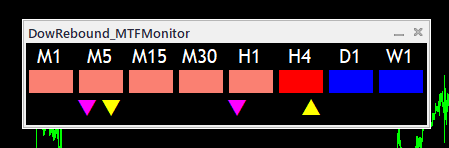
Included sub-window and real-time MTf monitoring to grasp market conditions
In addition to the main chart signaling indicator, DowRebound includes
・A sub-window version that shows market trend/range status
・A monitor version that shows eight timeframes of market trends/ranges
Both are included together!
Of course, both also implement rebound-predicting signals, so rest assured.
The monitor version can supervise eight timeframes simultaneously, excluding monthly data.
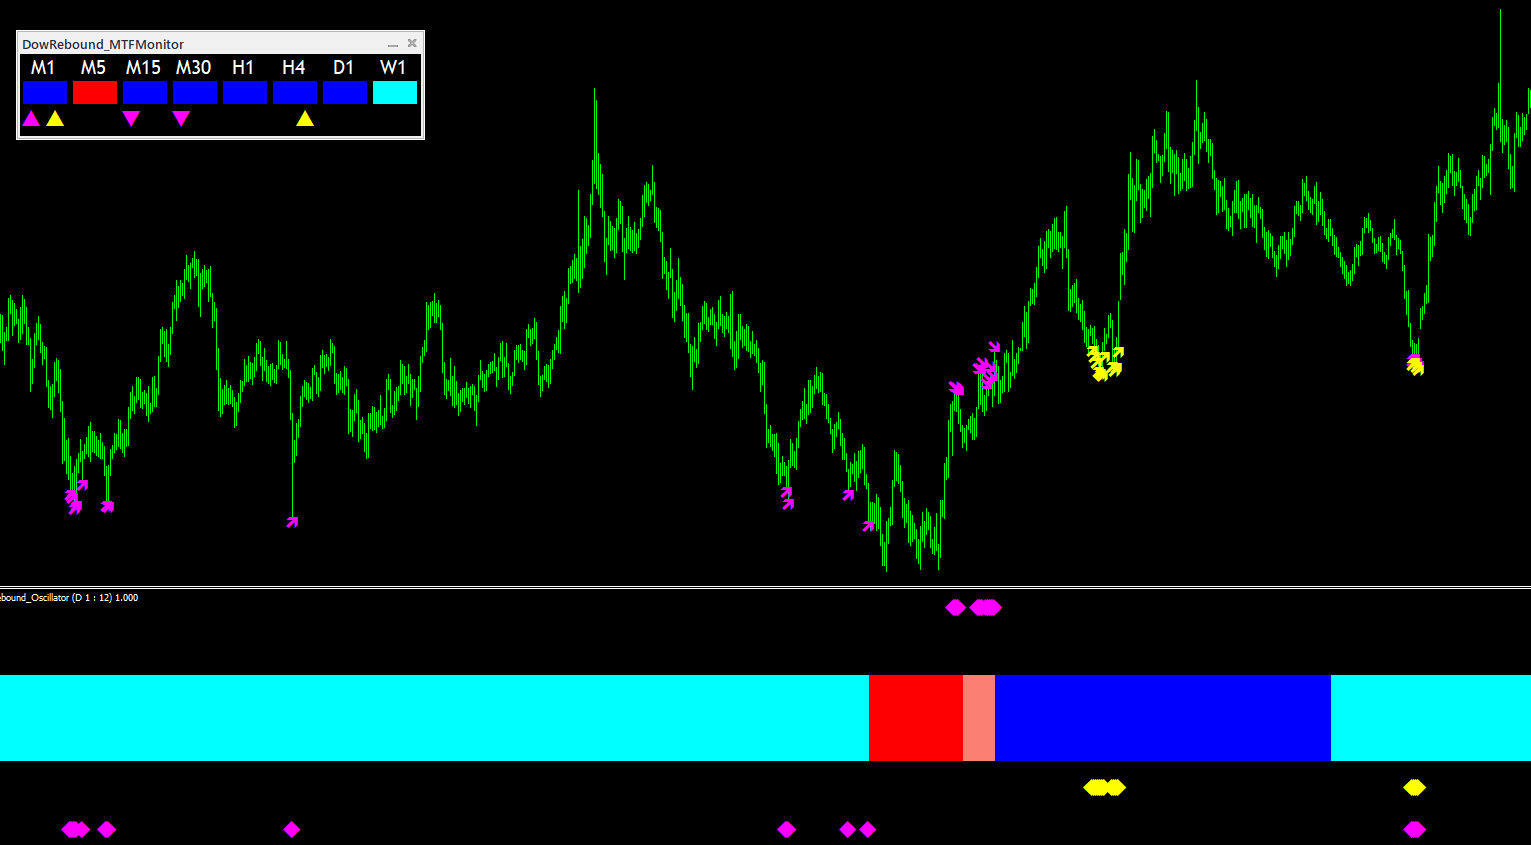
Grasp market trends and ranges
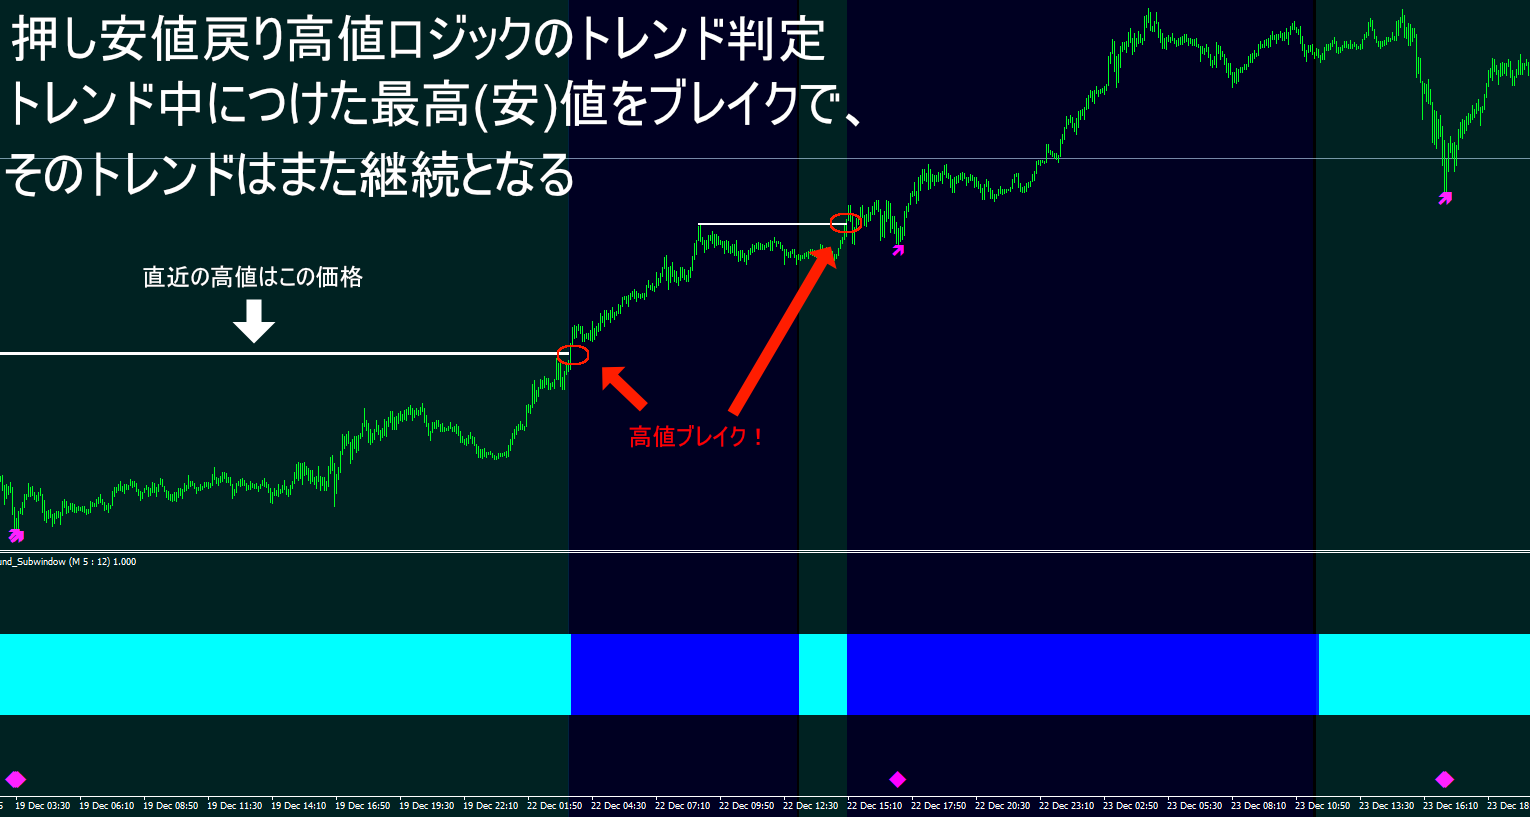
In addition to rebound signals on the main chart, you can confirm trend/range based on Dow Theory's pullback and retracement highs/lows, and it comprises four elements: buy-side trend, buy-side range, sell-side trend, sell-side range.
This is especially useful for the MTf monitor version, as you can quickly assess current rebound signals across eight timeframes. A very convenient tool for final situational awareness before entry. Please make good use of it.
Especially the MTf monitor version enables a quick, at-a-glance view of current rebound signals across eight timeframes, making it an extremely convenient tool for final situational awareness before entry. Please make good use of it.