

Utilization of "Visualization Indicators" (Part 233)
“Visualization Indicators” Usage(that233)
1. Evolution of “28 Currency Pair List Indicator”をさらに進化発展させインジケータ」を
“8CP Visualization Indicator”でAUDCHFdraw
“8CP Visualization Indicator”にはOceania版、London版、NewYork版、AnyCP版があります。今回は、Oceania版を使いました。
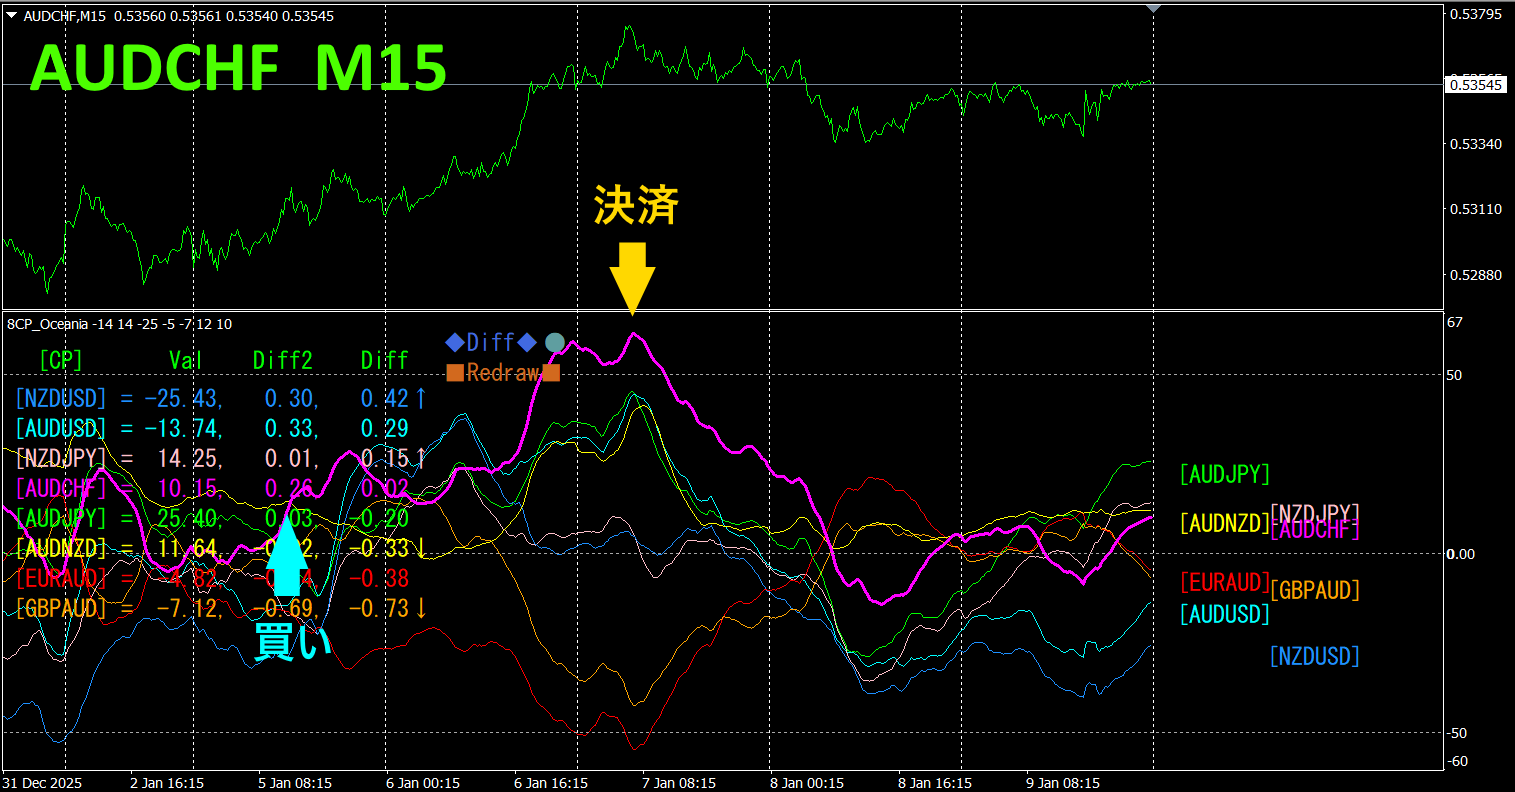
Top half is、AUDCHFの15分足チャートです。Bottom half shows、“8CP Visualization Indicator”によるものです、赤紫 color graph corresponds to AUD CHF.
On Monday、USDCHF graph appeared,、other graph groups rose above, so I will trade long。On Wednesday、reached a peak and closed。Profit was about60pisp.
Currency Strength/Weakness Graph
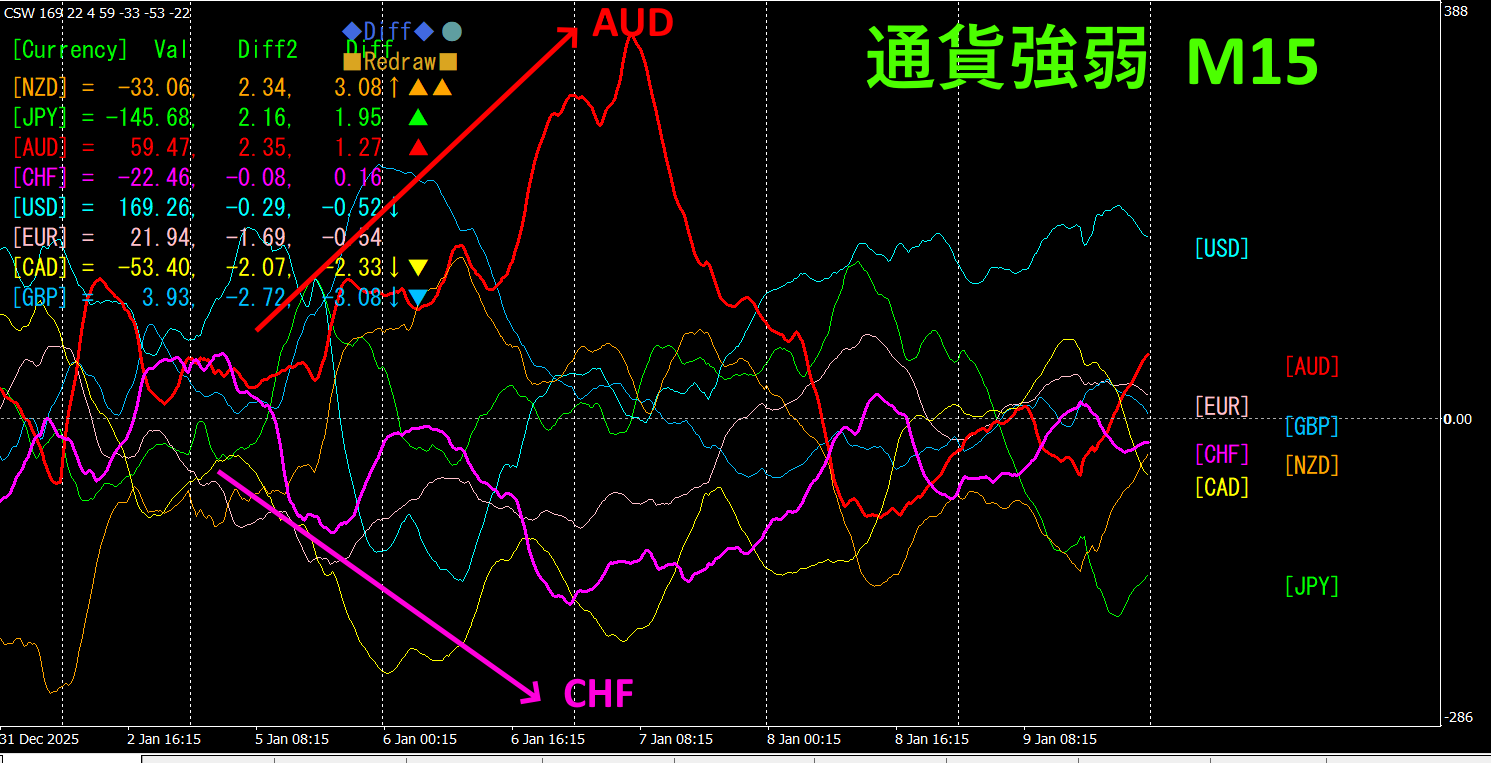
Looking at the 15-minute currency strength graph,A is strong, CHF is weak, and in the currency strength graph, AUD and USD show a remarkable inverse correlation.AUD and USD relationship is, CHF is spread with, focus on buying AUD/CHF.Keep positions while the vectors of AUD and USD expand.
In FX trading, pick currency pairs that are currently showing the strongest growth and inverse correlation,
“Target Currency Strength Inverse Correlation” is FX's rule of thumb.
If you are using “TrendLine-EX”, diagonal trendline break can automate entries and exits. Since you can leave it as is, easy trading is possible. “TrendLine-EX” can automatically short on a trendline break and auto-close on a breakdown, making it a semi-automatic EA.
2. Try Best SelectIndicator.
Below is the screenshot from 2026 January 7 01:49 (JST) .
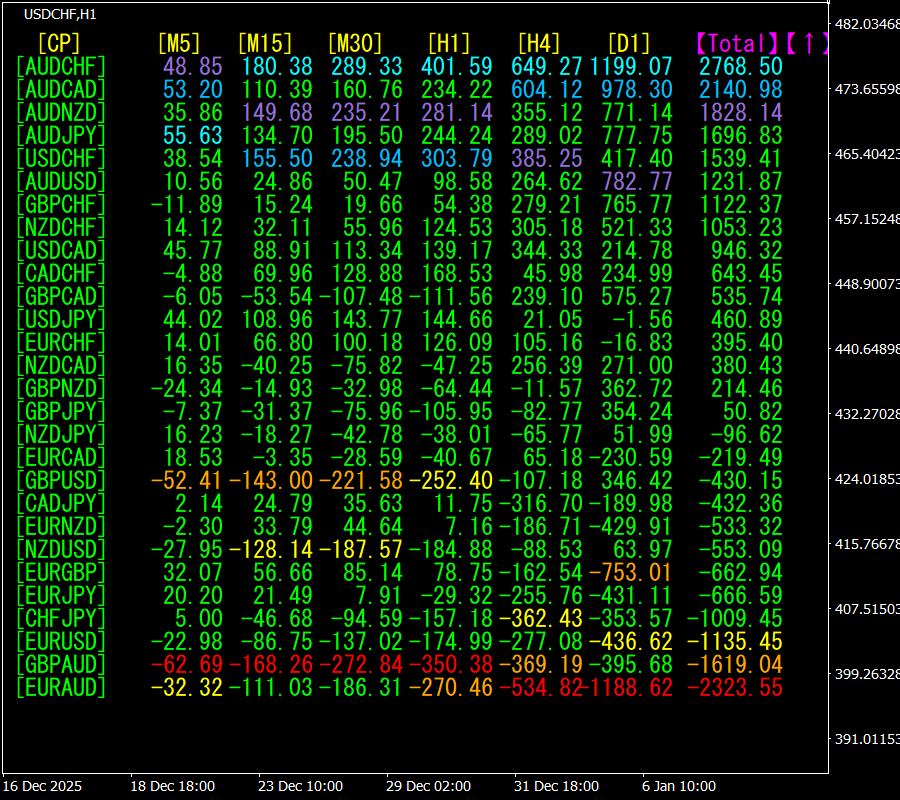
[Total] values are sorted in descending order.The top is AUD CHF, which appears as blue on all timeframes.
Total value is 2,768.50, a large positive figure. This suggests an uptrend in AUD/CHF.
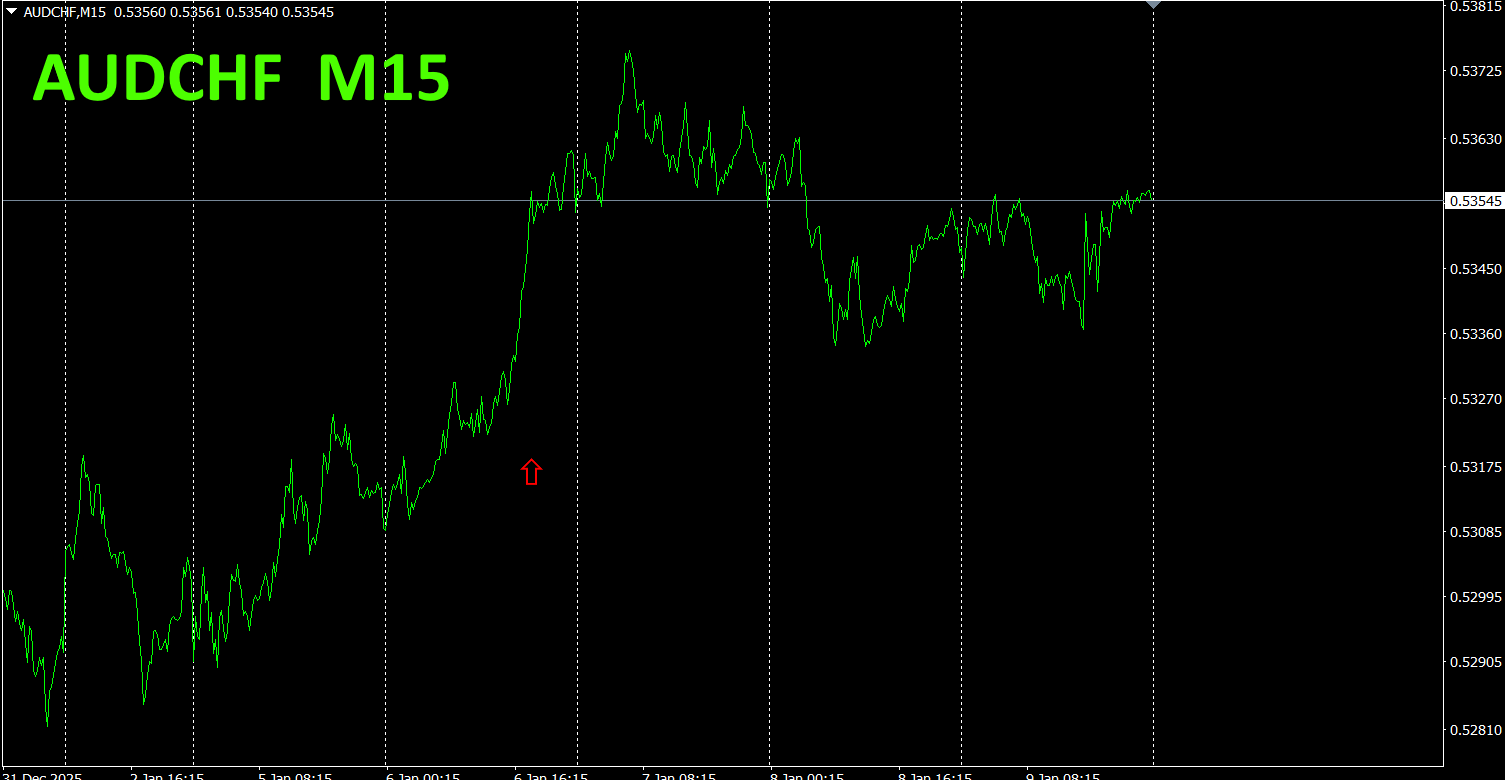
let's look at AUD/CHF chart.
Red arrows indicate where the screenshot was taken. It captures the rising portion.
“28 Currency Pairs Best Select Indicator” allows you to easily identify which of 28 currency pairs has the strongest trend. It also tells you whether to trade now using numerical values and colors. It is a powerful indicator to assess all currency pair movements at a glance.
“28 Currency Pair Best Select Indicator” ”

https://www.gogojungle.co.jp/tools/indicators/35128
3. Since May 2021, EURJPY movement has been tracked?
We have been tracking EURJPY since May 2021.
To view the overall trend, we draw about the last 3 weeks on a 30-minute chart.
Previously, we wrote the following。
Pink represents EUR, green represents JPY. EUR is slightly upward direction, JPY is slightly downward direction so EURJPY is expected to rise slightly.
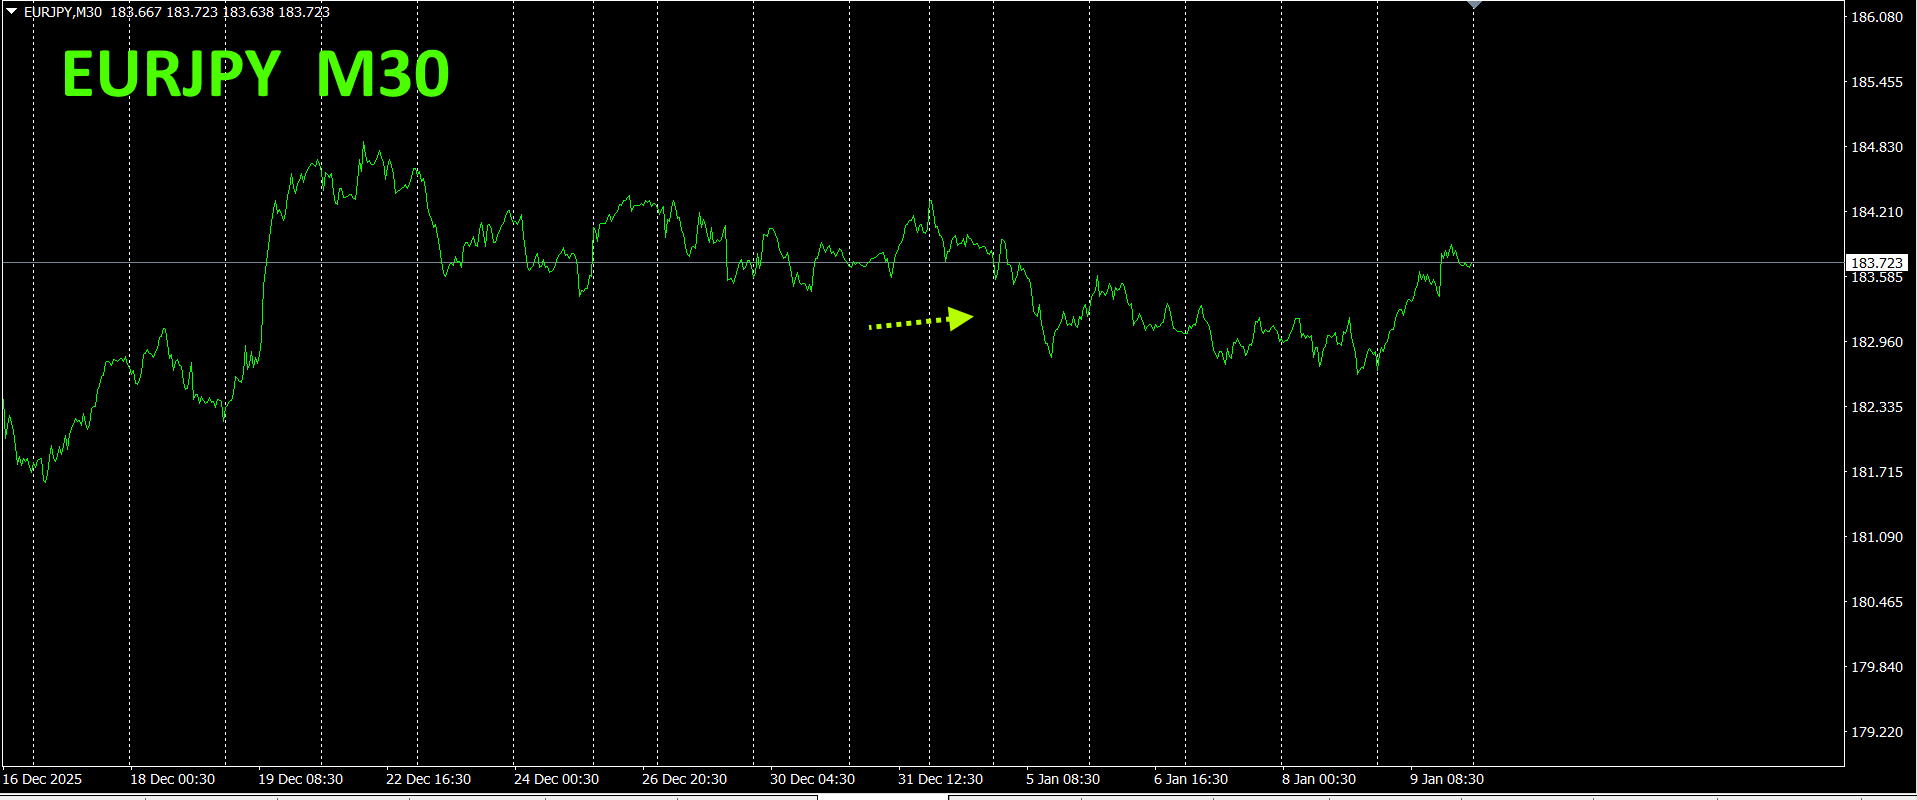
It moved slightly downward.。
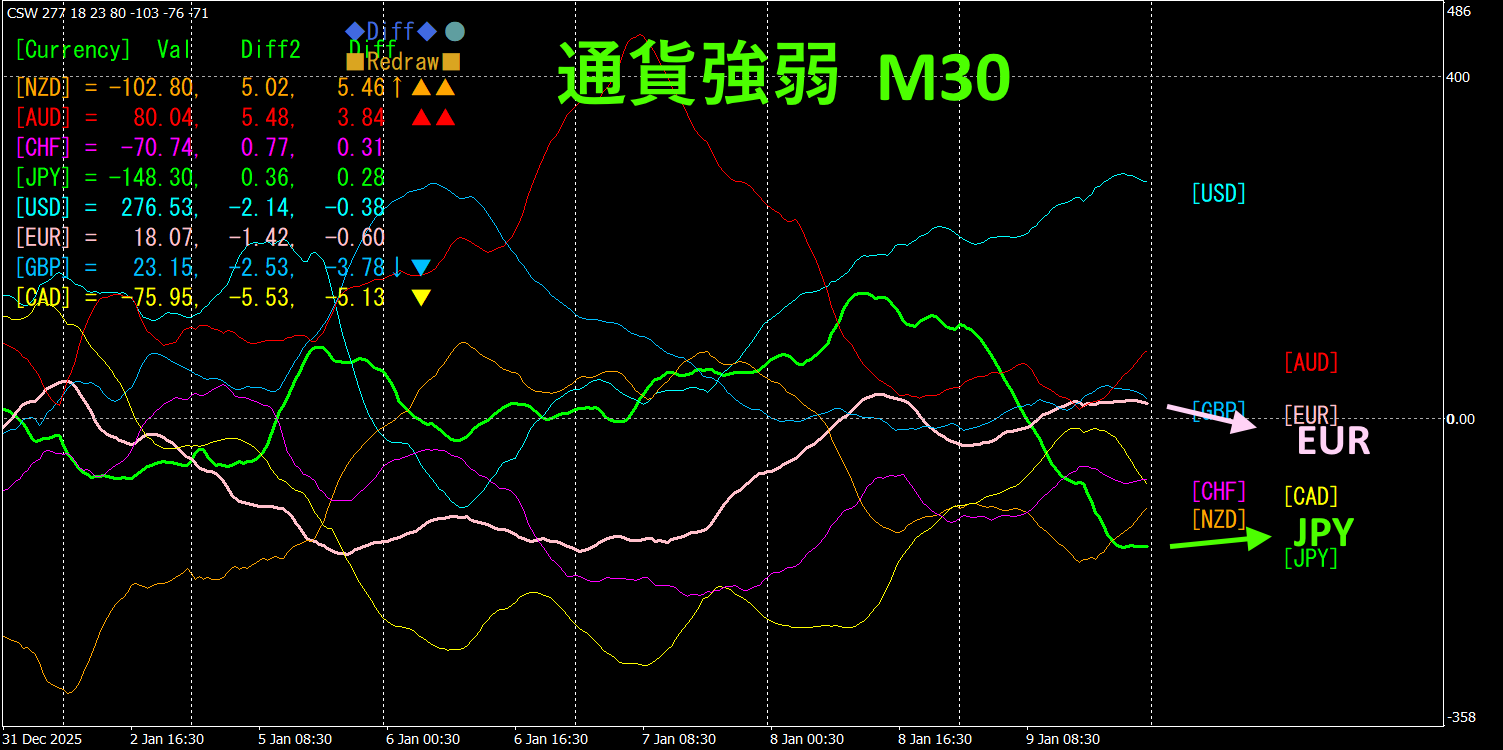
30-minute currency strength chart.
Pink EUR, green JPY. Both are mostly horizontal. If anything, JPY slightly higher, so EURJPY leans downward.
4. Try New Indicator Dual_MACD_Trend_Indicator.
New indicator “Dual_MACD_Trend_Indicator” is available below.
MT4 version:https://www.gogojungle.co.jp/tools/indicators/62199
MT5 version:https://www.gogojungle.co.jp/tools/indicators/62202
An indicator that clearly shows the direction of the trend with color. If the color of the color bar is Lime, it means buy; if Red, it means sell. Easy for beginners to use.If the bar color is green, it indicates an uptrend; if red, a downtrend; if no color, there is no trend.The color display allows you to grasp the trend state at a glance
Red in the sell zone and green in the buy zone are clearly separated, making trading easier at a glance.
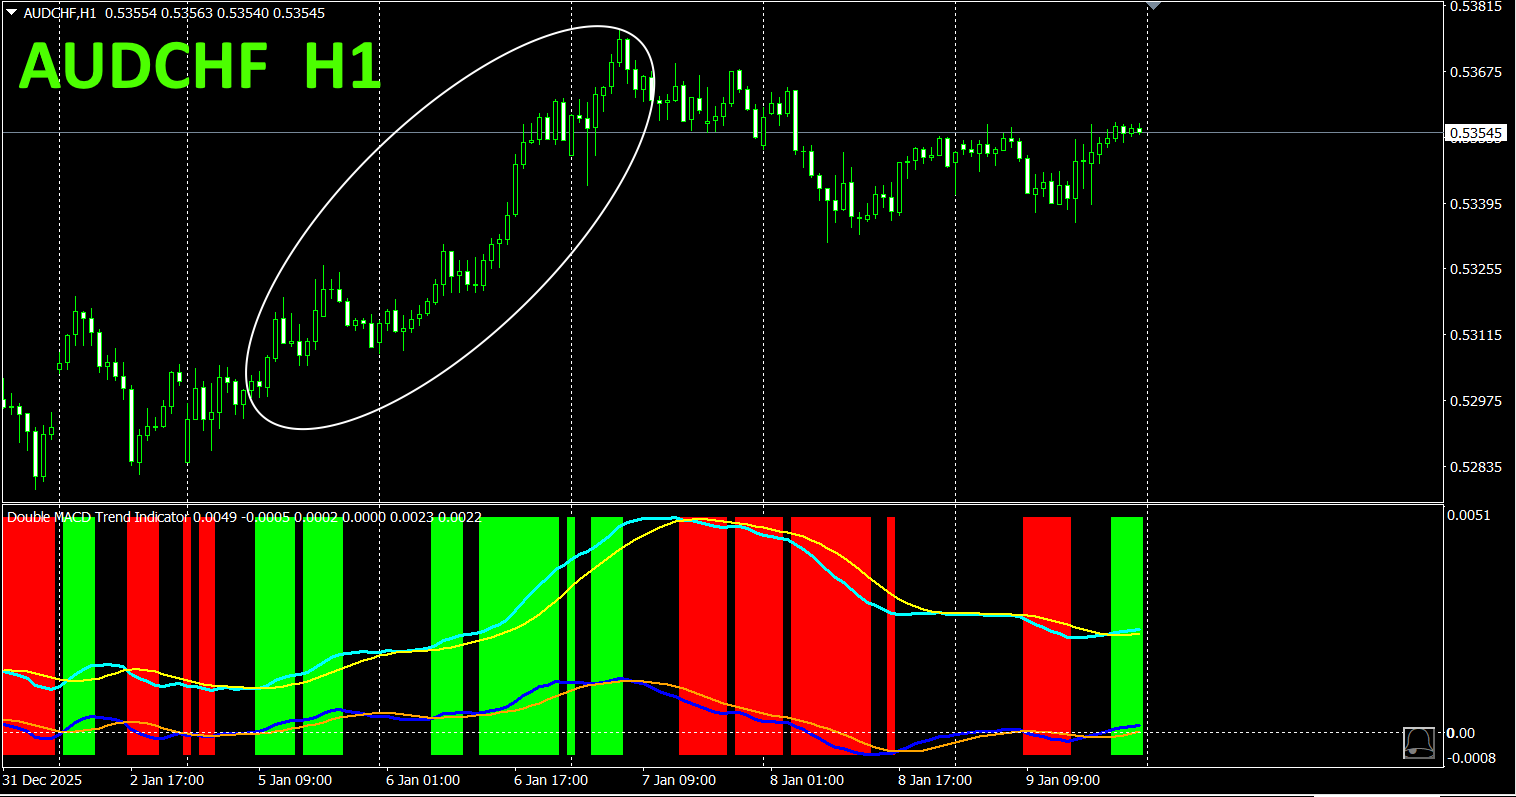
In “Dual_MACD_Trend_Indicator”, buy in the green zone, sell in the red zone, and do not trade otherwise.
Use “Dual_MACD_Trend_Indicator” and you will no longer hesitate about trading direction.
5. “Hyper-CSW”has been released

“Hyper-CSW” is a high-performance indicator that visualizes the strength/weakness of the eight major currencies at a glance. It records the strongest currency and score for the current timeframe, enabling accurate capture of trend persistence and turning points. Additionally, multiple timeframes (M15, H1, H4, D1, W1) currency strength rankings (top 4 currencies) with scores are supported in a multi-time analysis. With high-visibility color lines and a separate window display, it gives you the power to discern market trends. A powerful indicator for you
 . Details are available at
, the following link.
https://www.gogojungle.co.jp/tools/indicators/65082
“8CFD Visualization Indicator Any Version”
https://www.gogojungle.co.jp/tools/indicators/32288
“Toretore Indicator”https://www.gogojungle.co.jp/tools/indicators/50115
https://www.gogojungle.co.jp/tools/indicators/50115
“TrendLine-EX”
https://www.gogojungle.co.jp/tools/indicators/42257

“8 Currency Strength Visualization Indicator”” is available on the following pages” is available on the following pages。

MT4 version https://www.gogojungle.co.jp/tools/indicators/39150
MT5 version https://www.gogojungle.co.jp/tools/indicators/39159
【My listed products】


