2026/1/10 Dollar/Yen, Gold, SP500, and Nikkei 225 Environment

『Trendline Pro 2』✖『Dow the Zog Break Edge 9』
『Dow the Zog Break Edge』 has evolved from 5 to 9.
However, development and delivery are ahead of the product introduction page.
Development is progressing further, so please look forward to it.
By default, the setting is to display only the most recent one of the breakouts from 1 to 9.
You can switch easily with button operations.
▲Light blueis the upper breakout (darklight blueis the inverted triangular breakout)
▼Pinkis the lower breakout (darkpinkis the inverted triangular breakout)
■ Triangle consolidation (small white circle appears on the chart)
In the lower image, 『Trendline Pro 2』 is also displayed on the chart.
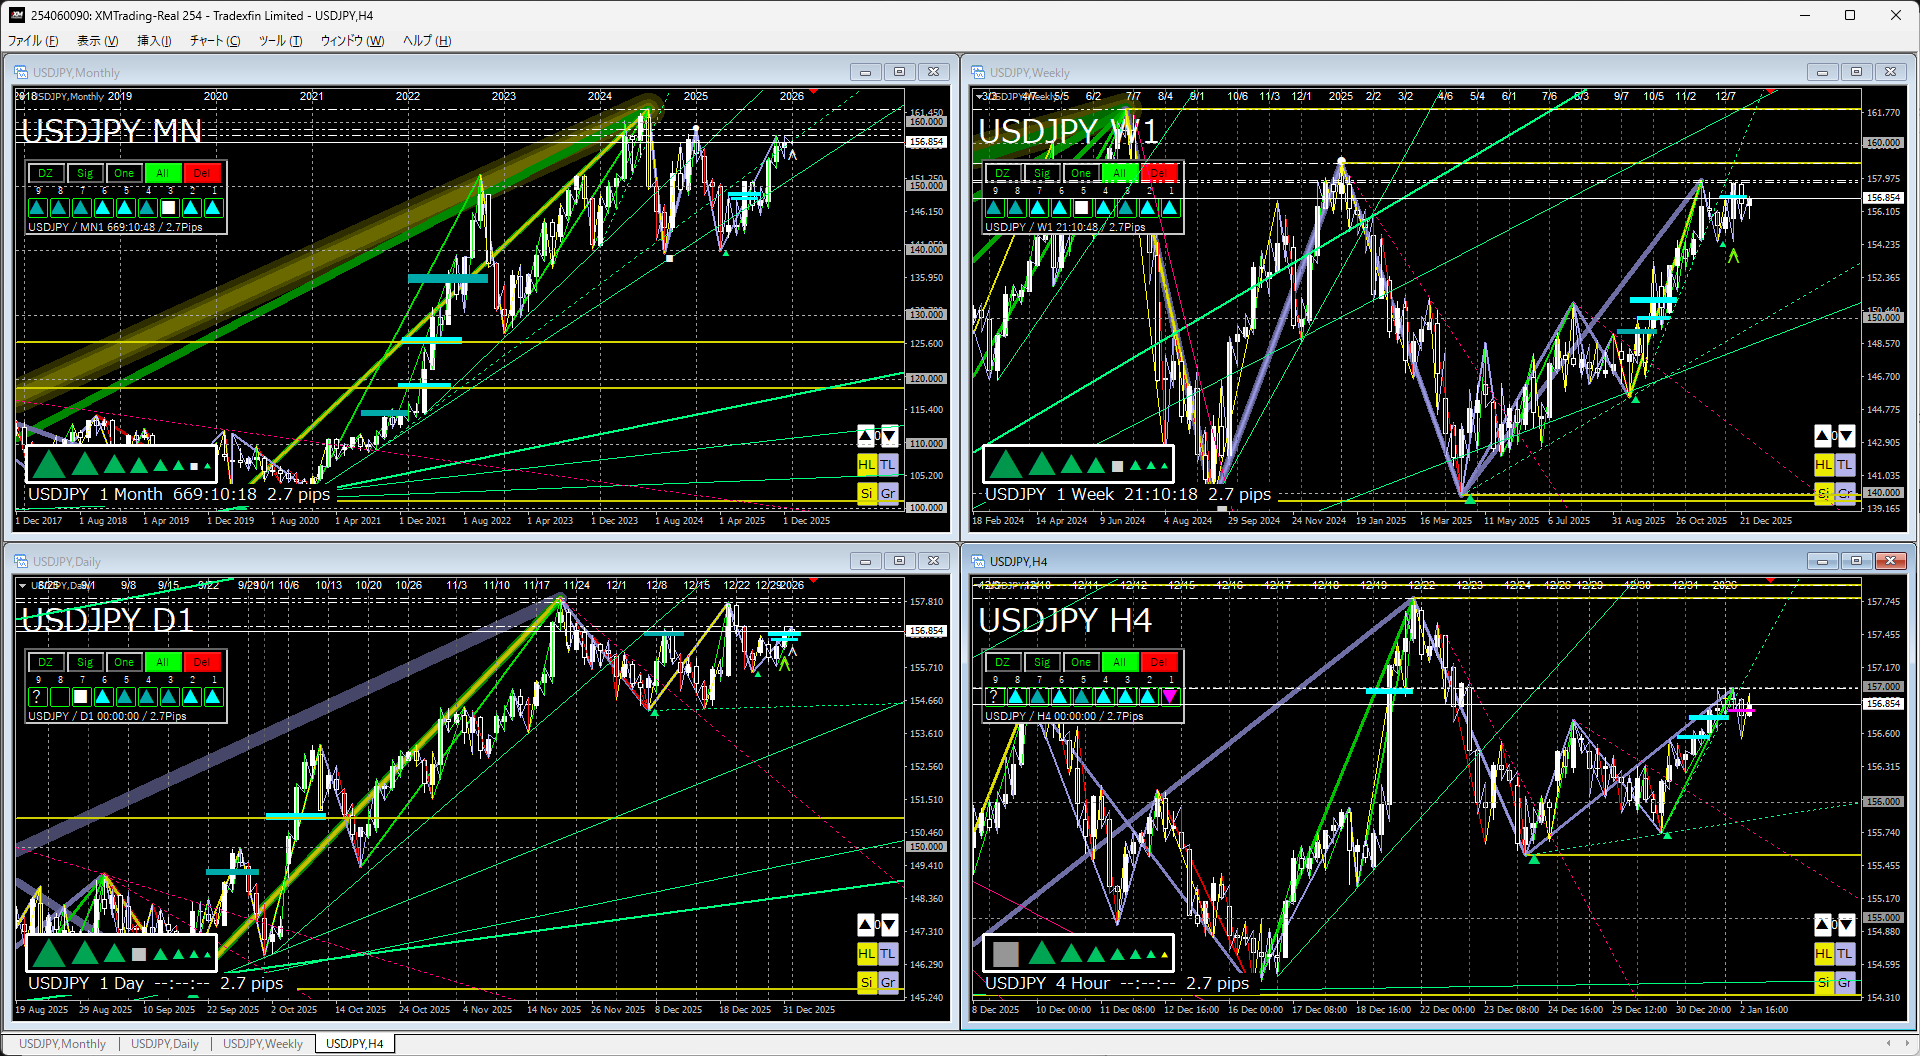
USD/JPY
↓Last week's chart↓
↓This week chart↓
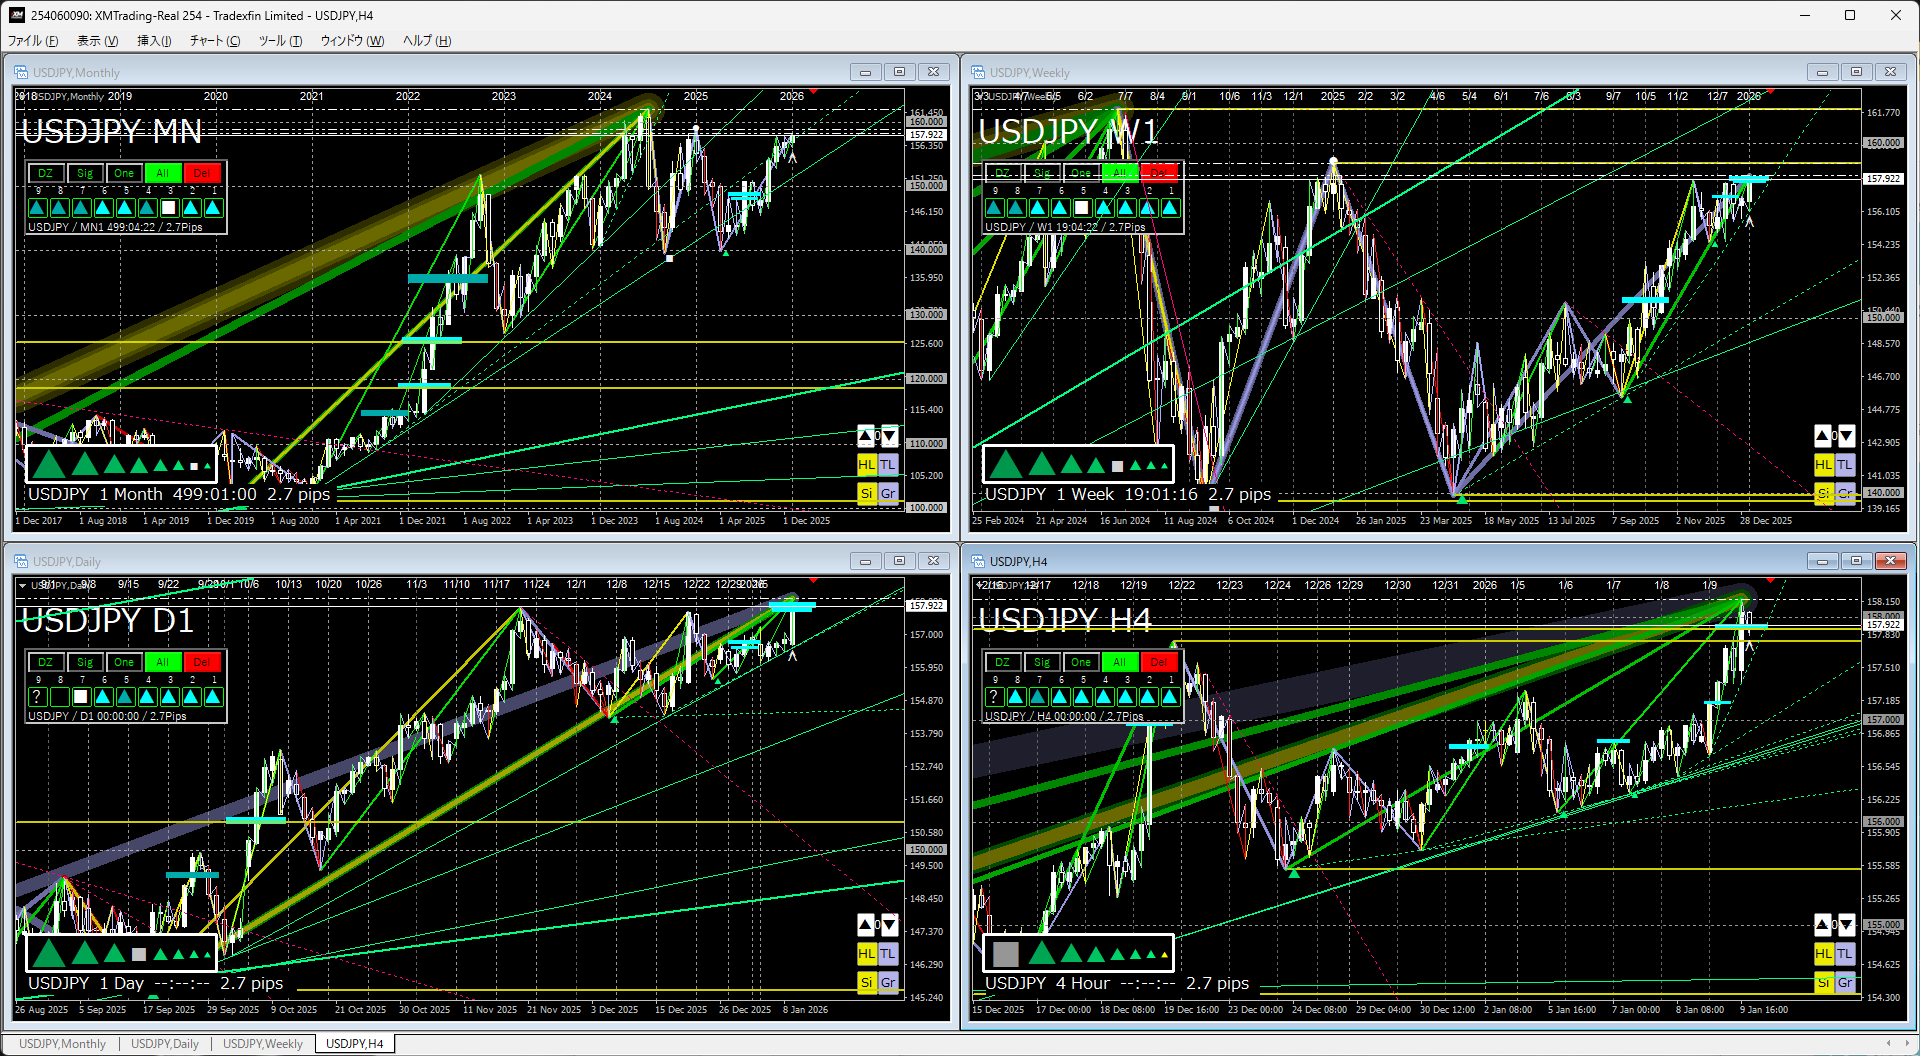
Monthly & WeeklyNo change in the image since last week.
The pattern is moving upward, currently a large triangle consolidation.
If the recent high breaks to the upside and the triangle breaks, the long-term Yen depreciation trend will strengthen rapidly.
Daily & 4-hourLast week, I pictured a pattern of attempting a breakout above the recent high.
Since it has already broken out, we can expect a move to test the next high.
Even if it breaks higher again, it would be prudent to be aware of a subsequent pullback.
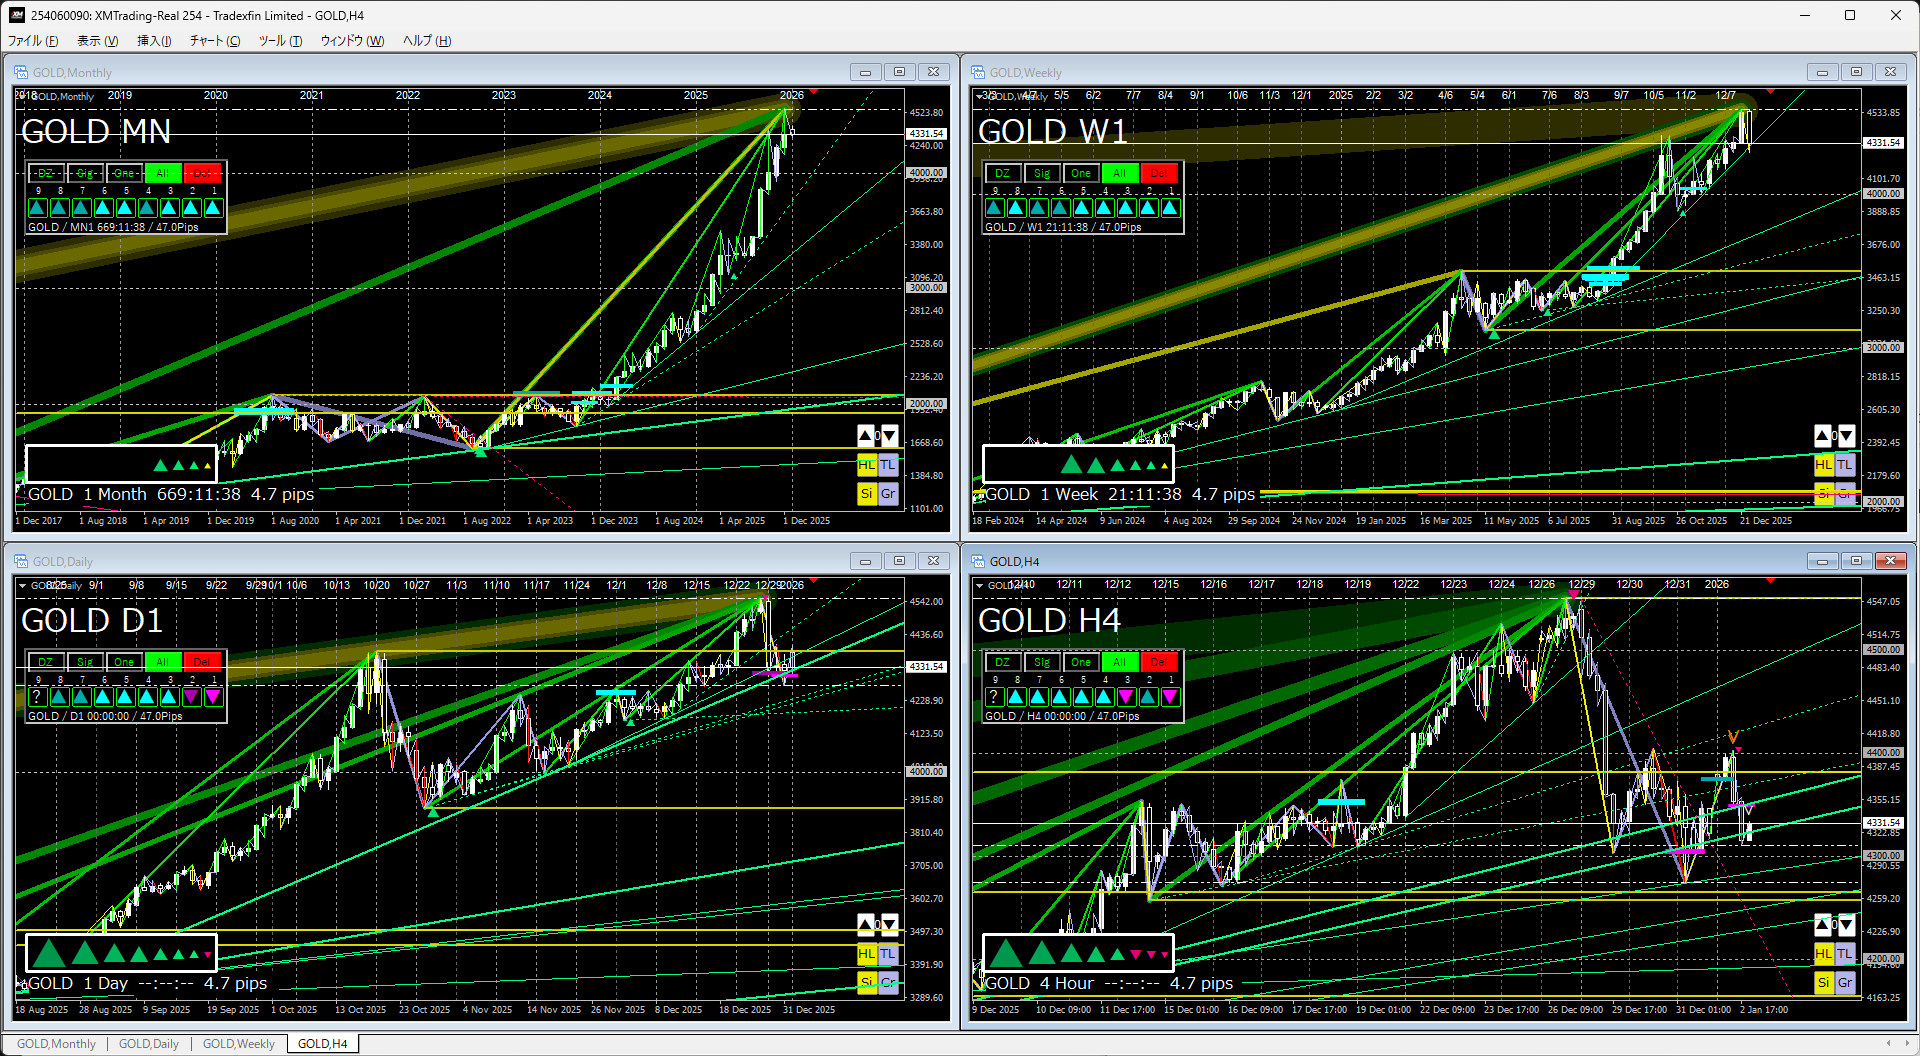
Gold
↓Last week's chart↓
↓This week chart↓
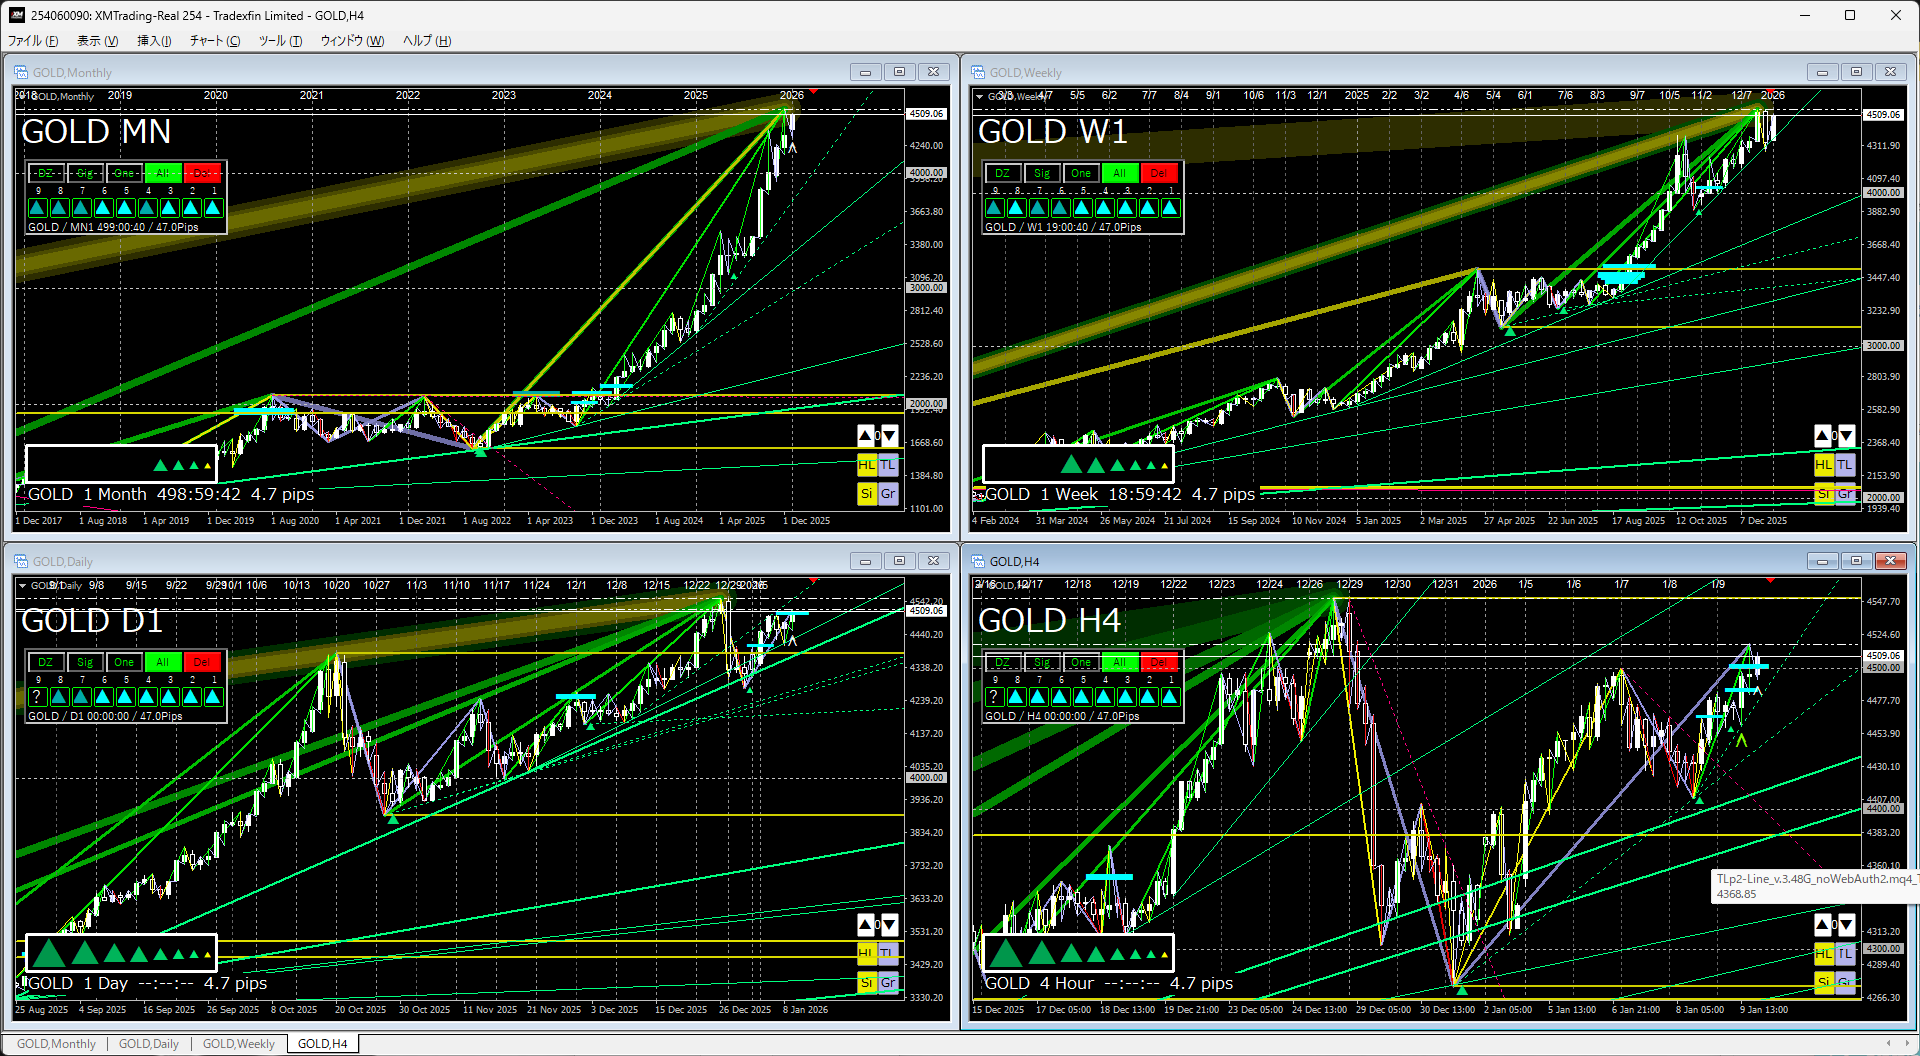
No change in the image since last week.
Gold remains a clear buy-offering trend.
This does not mean gold is rising; rather, currency value is generally perceived as declining.
There are few sellers, so waiting for a big drop and buying may not be appropriate.
Although CME margin hikes cooled overheating, it seems that has already been digested.
It seems wise to continue holding the accumulated gold.
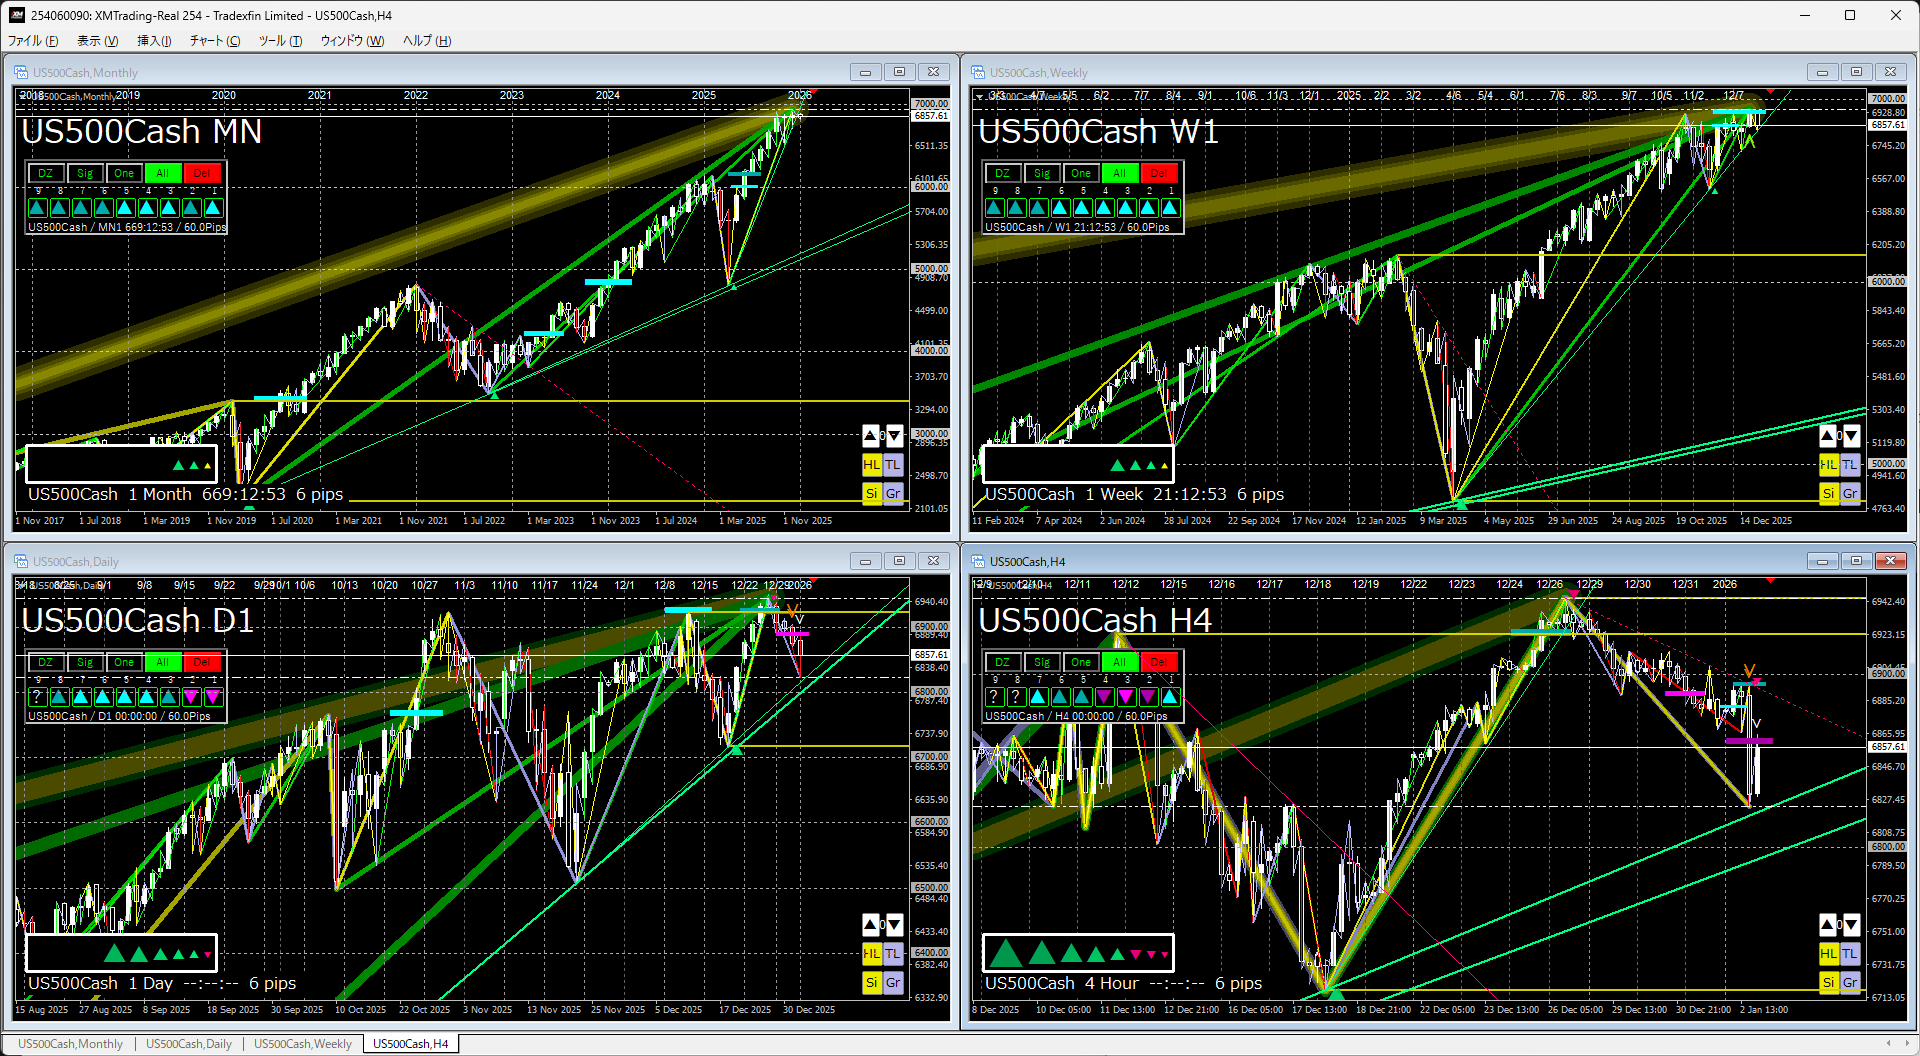
S&P 500
↓Last week's chart↓
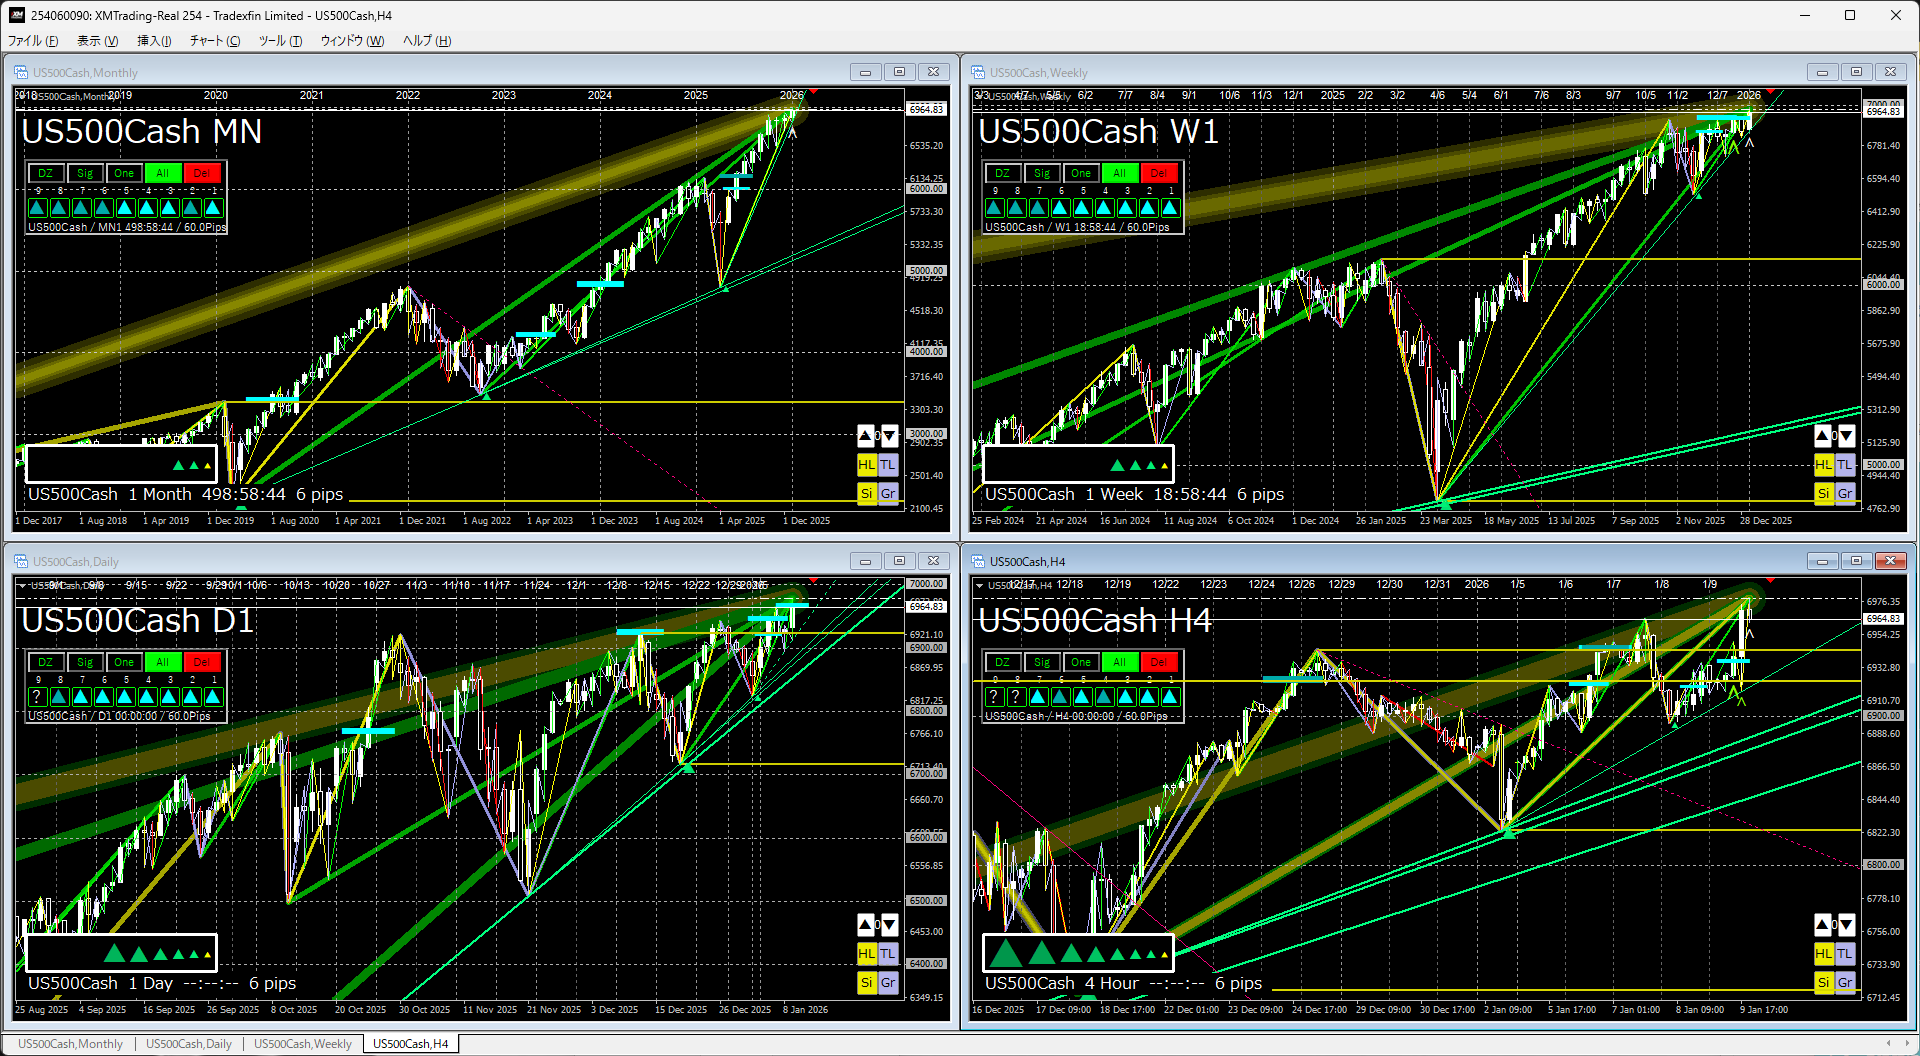
↓This week chart↓
Monthly & WeeklyNo change in the image since last week.
Rebounded after a trendline, continuing to rise.
There was a temporary lower breakout recently, but it shifted back to an upside breakout environment.
Daily & 4-hourLast week, I pictured a pattern where the rise would continue.
As the trendline remains strongly in focus, new highs are being set.
If nothing happens, this upward move is expected to continue.
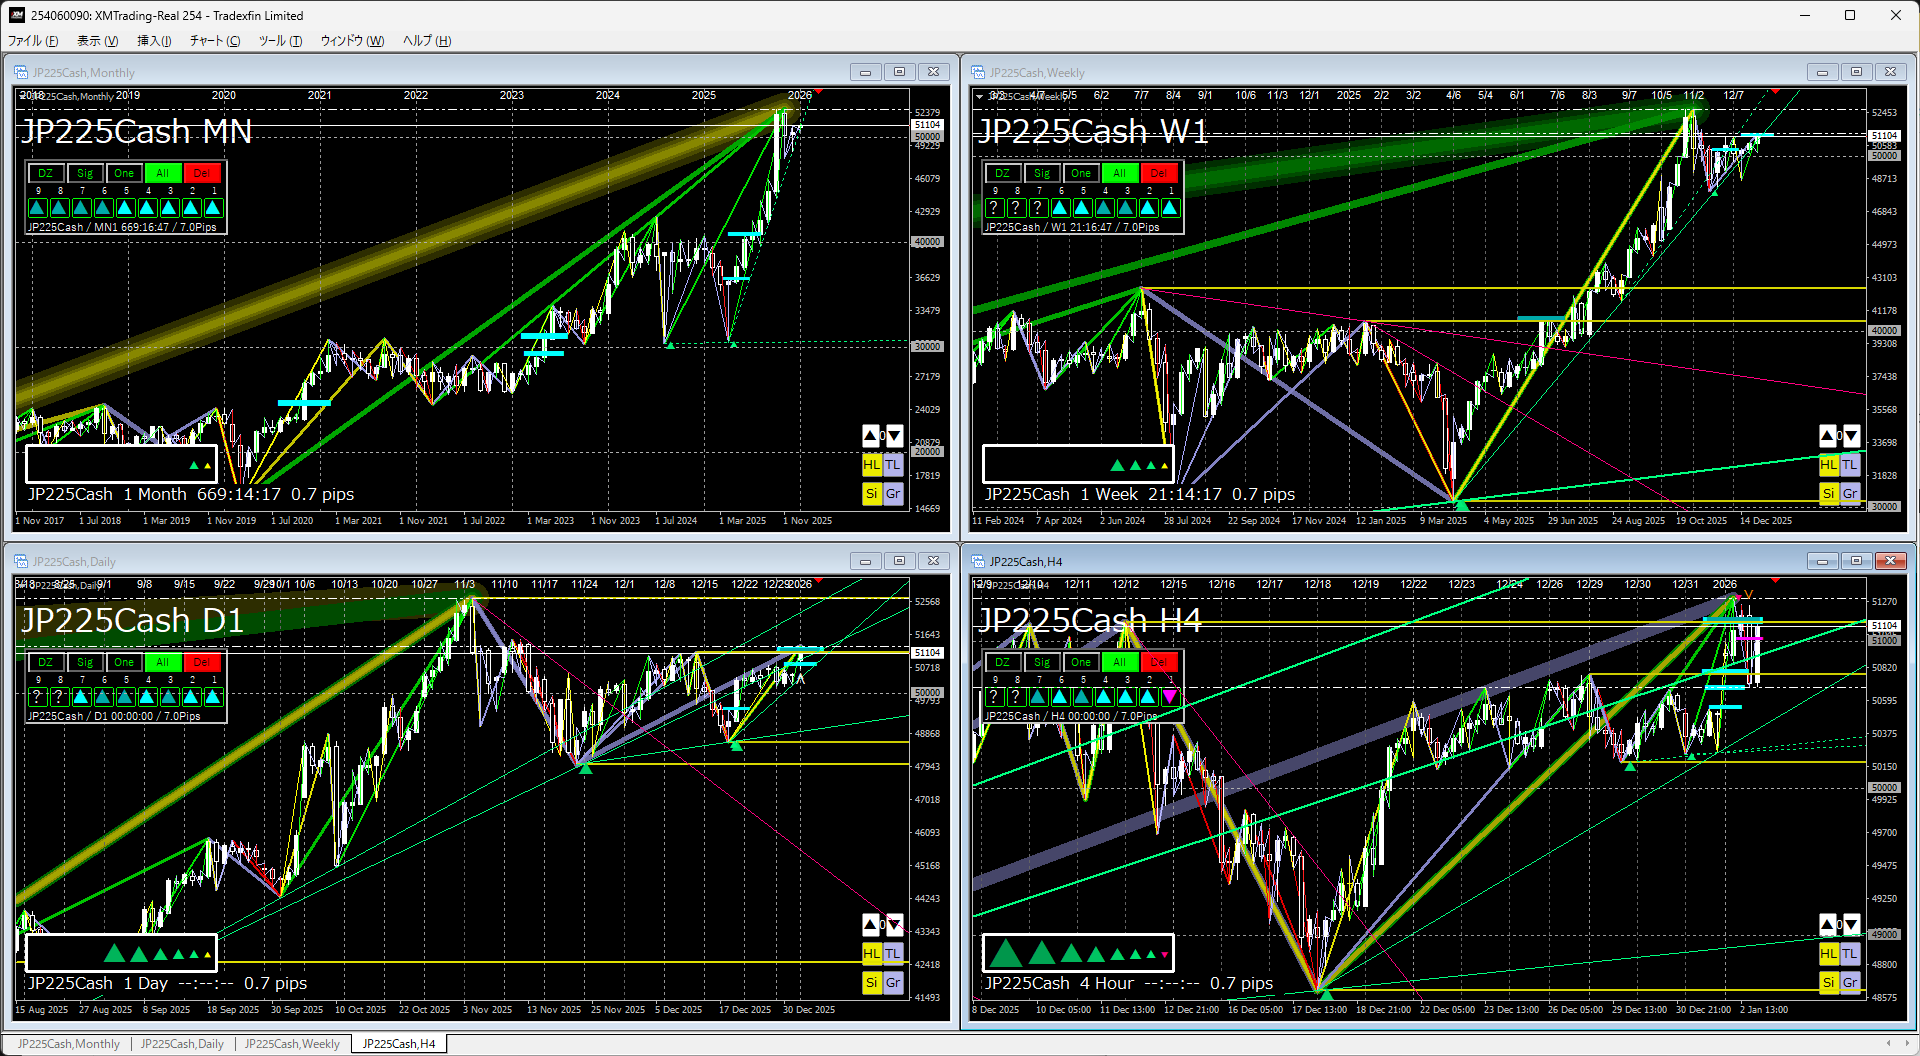
Nikkei 225
↓Last week's chart↓
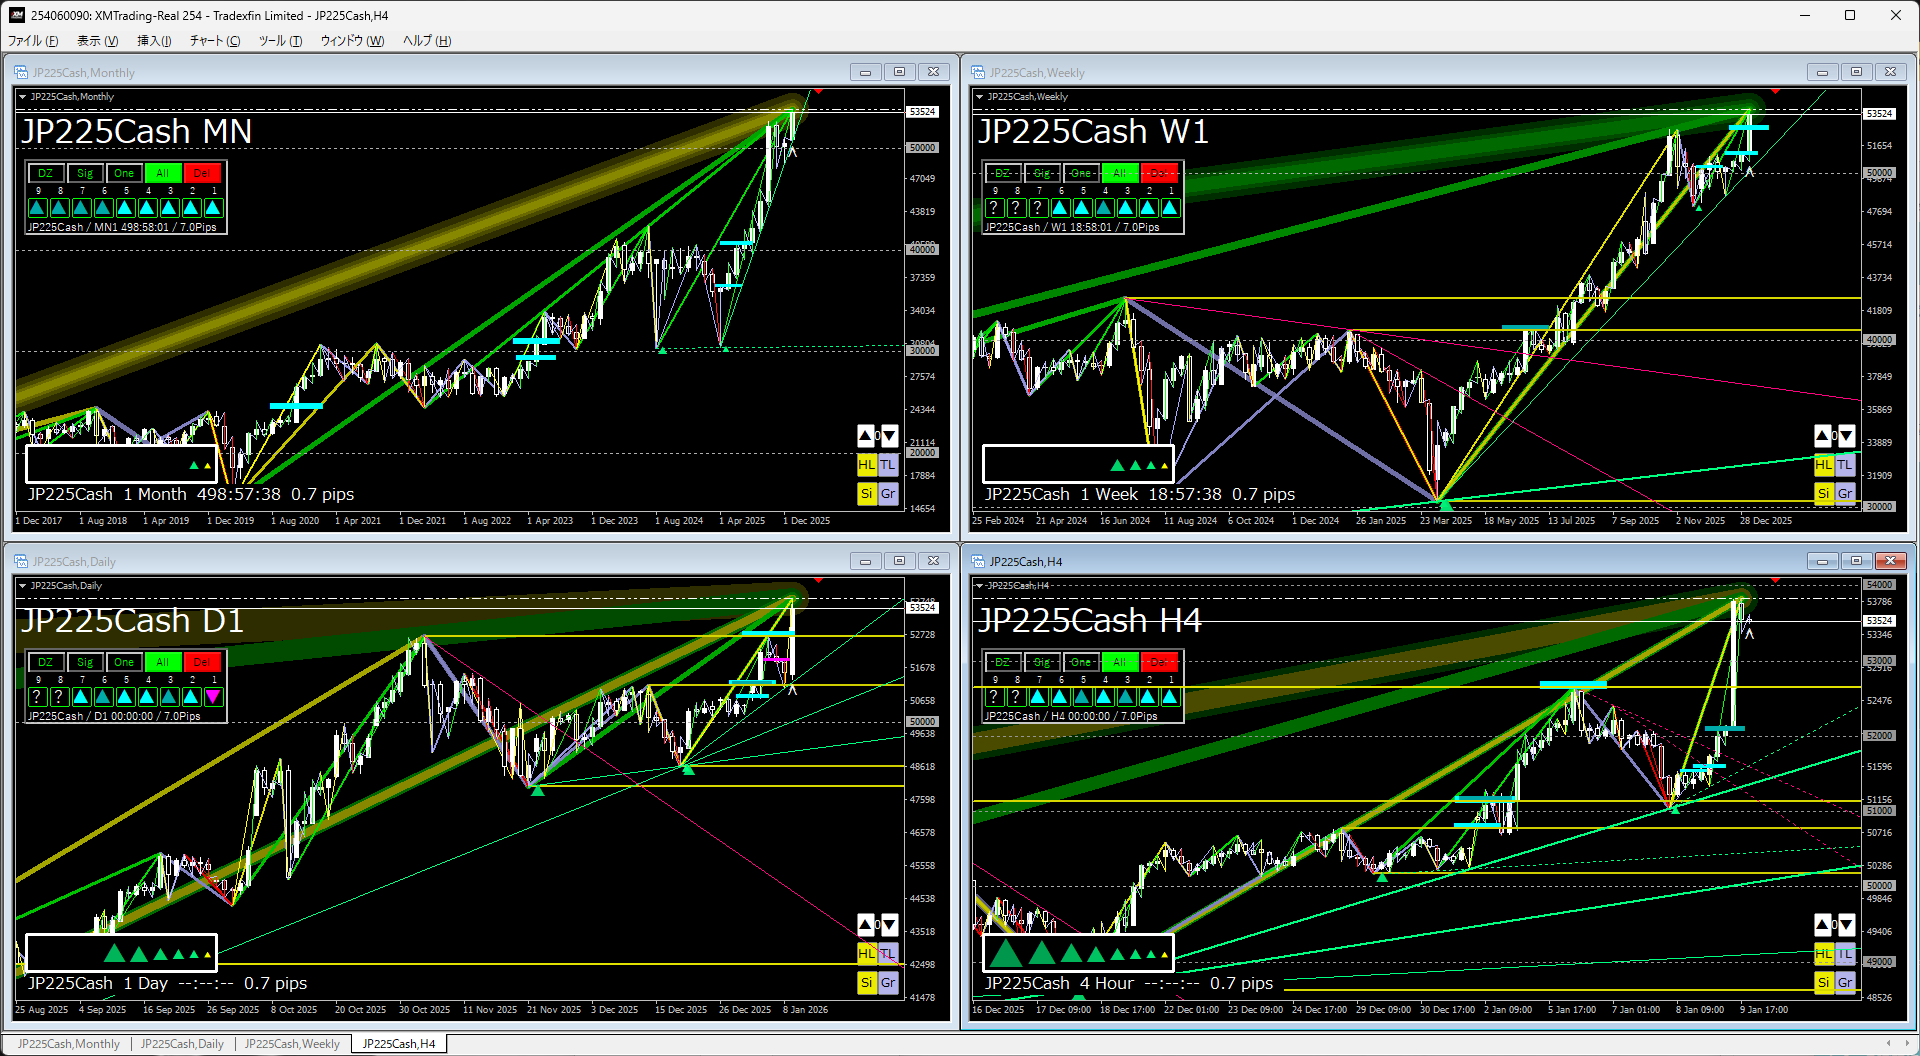
↓This week chart↓
Monthly & WeeklyNo change in the image since last week.
It is rising strongly with a double bottom breakout.
Lately, new highs have been achieved, showing strength.
Daily & 4-hourLast week, I pictured a pattern of testing the next high.
It has already broken higher, and the direction is clear.
However, since Japanese traders tend to mean-revert, it remains to be seen whether it will rise strongly from here.
The indicators in the attached image use the two indicators below.
If you're interested, please take a look.
『Trendline Pro 2』✖『Dow the Zog Break Edge 9』
If you would like to continue seeing this articlein the futureplease press the button.
If you have any requests such as liking this kind of article, feel free to let us know.