

Utilization of “Visualization Indicators” (Part 232)
「Visualization Indicator」 usage(that232)
1.「28 currency pair list indicator」 to be evolved into an indicator
“8CP Visualization Indicator” for USDCHFto be drawn
“8CP Visualization Indicator” has Oceania version, London version, NewYork version, AnyCP version. This time, we used the NewYork version.
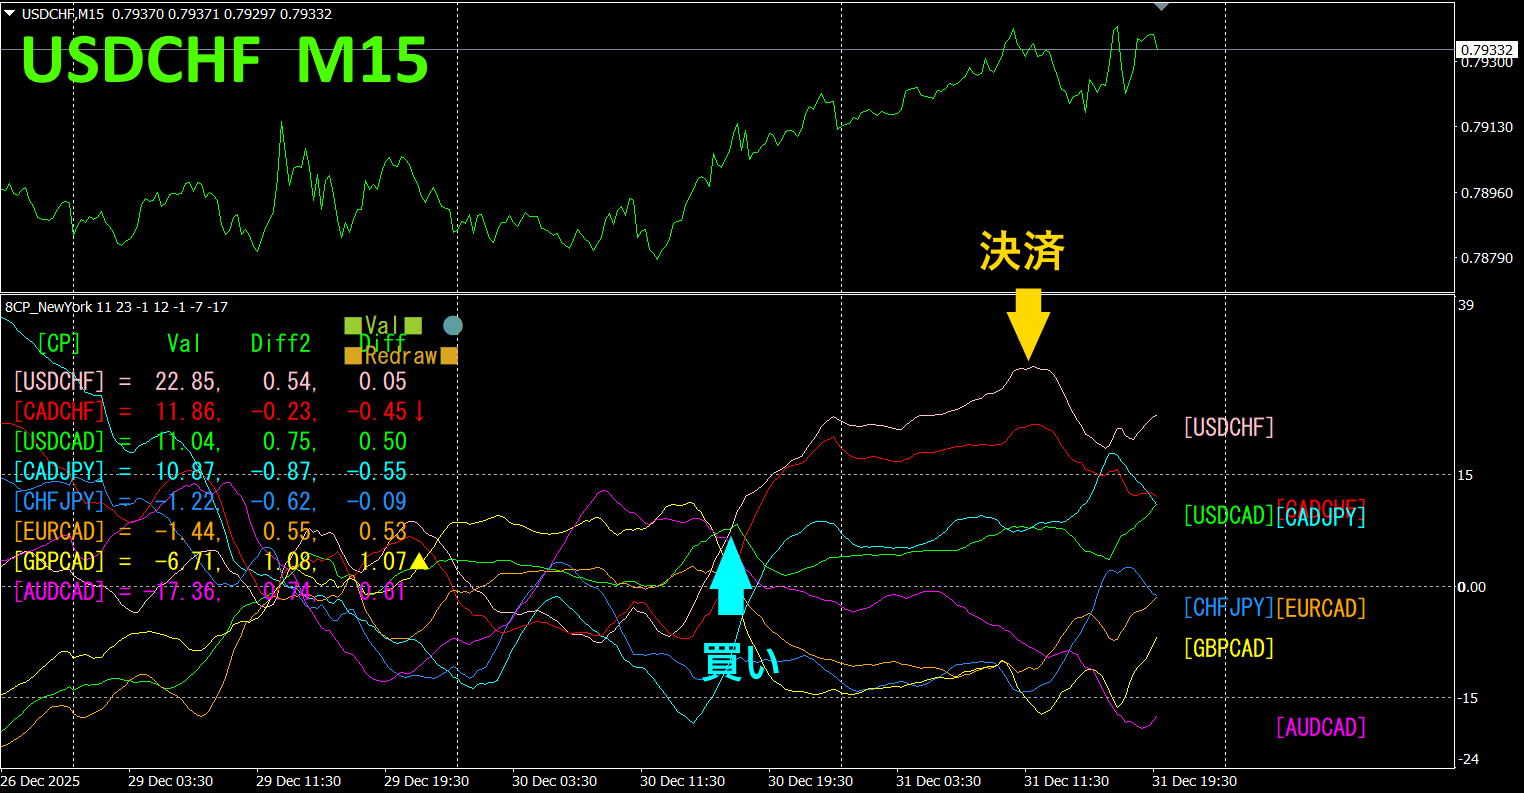
The upper half is a 15-minute chart of USDCHF. The lower half is from the”“8CP, and Visualization Indicator pink line corresponds to USDCHF.
Year-end with little movement, on Tuesday USDCHF graph broke above other charts, so we will trade long the next day. The peak was reached the following day, so we close the position. Profit was about 30 pips.
Currency Strength/Weakness Graph
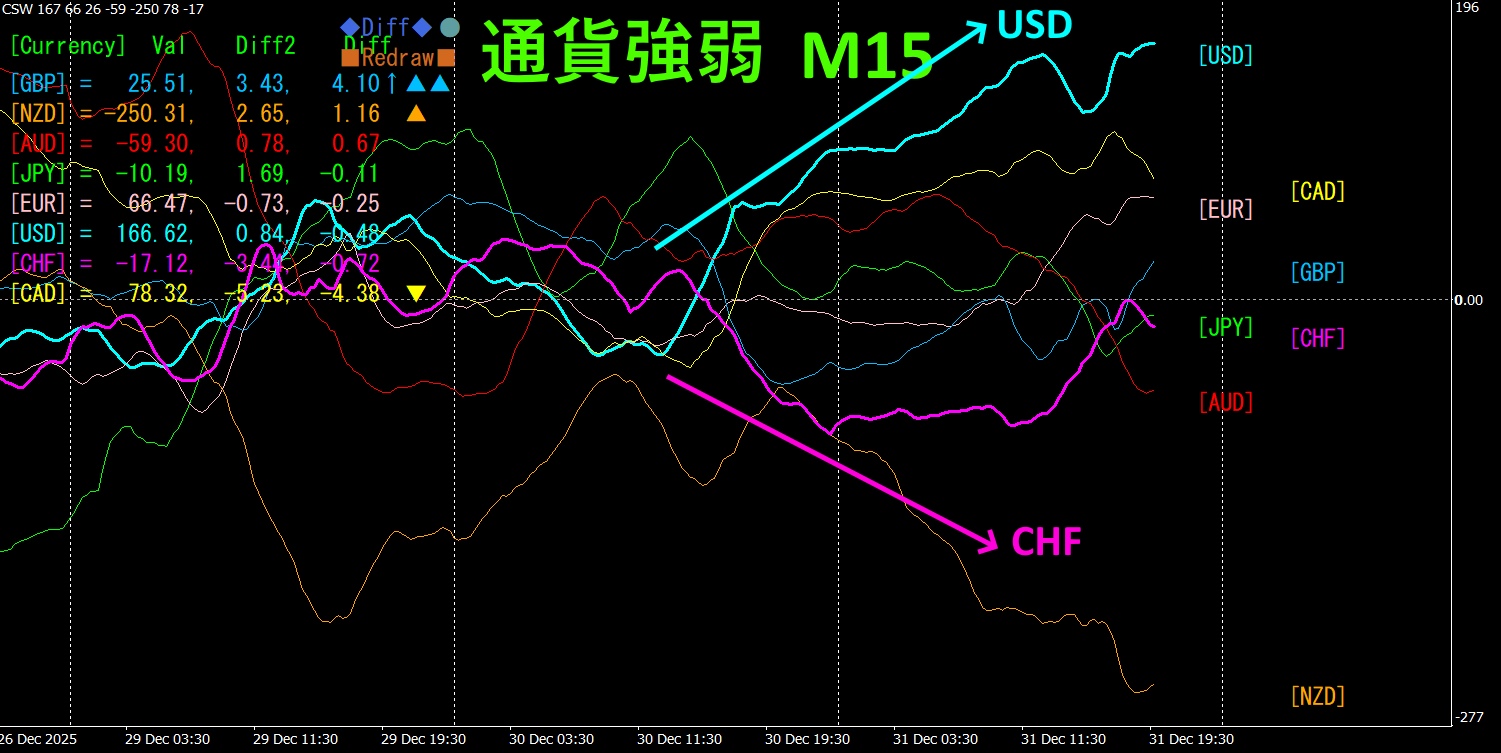
Looking at the 15-minute currency strength graph, USD is strong, CHF is weak, and on the currency strength graph CHF and USD show a clear inverse correlation. The relationship between CHF and USD is such that< USD, CHF and USD widen, so focus on USDCHF for a buy trade. Since the inverse correlation chart is clean, as long as the vectors of CHF and USD expand, simply hold the position.
In FX, pick the strongest growing currency pair with inverse correlation and trade it, and results will follow.
“Hit currency strength inverse correlation!” is a rule of FX.
Using “TrendLine-EX” allows entry and exit to be automated with diagonal trendline breakouts. It can be left running as is for easy trades. “TrendLine-EX” is a semi-automatic EA that can short when the trendline breaks below and automatically close when it breaks above.
2. Try Best Select Indicator
Below is the 2025 12 29 12:49( JST ) screenshot.
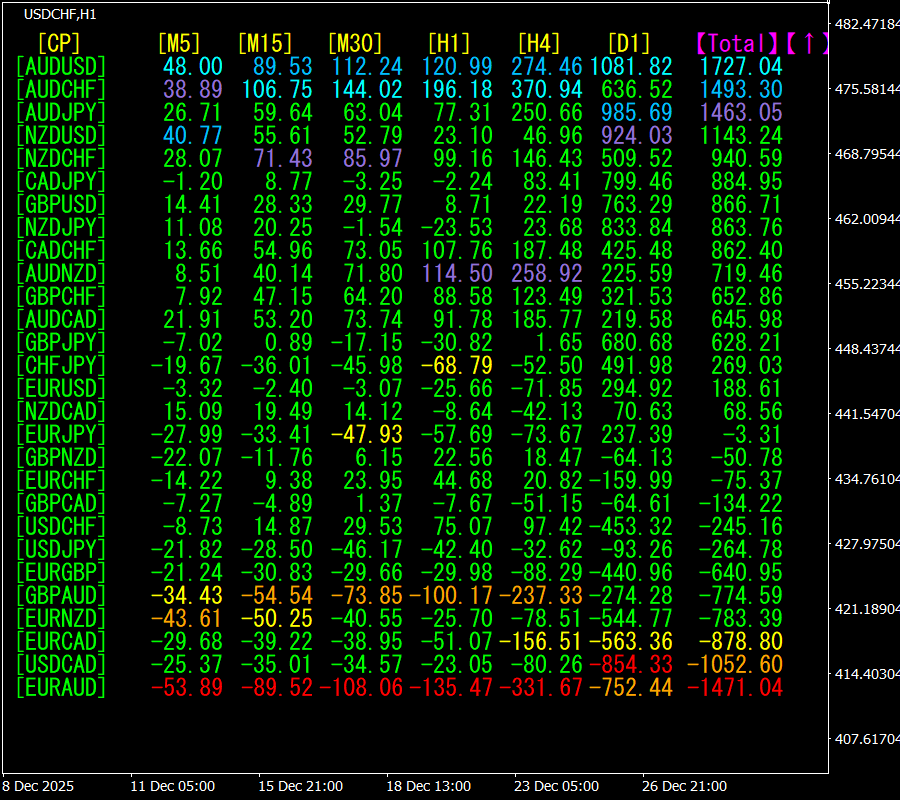
[Total] is sorted in descending order by value. The top AUD USD is shown in blue on all timeframes.
The Total value is 1727.04, indicating a positive figure. This suggests an upward trend for AUD USD.
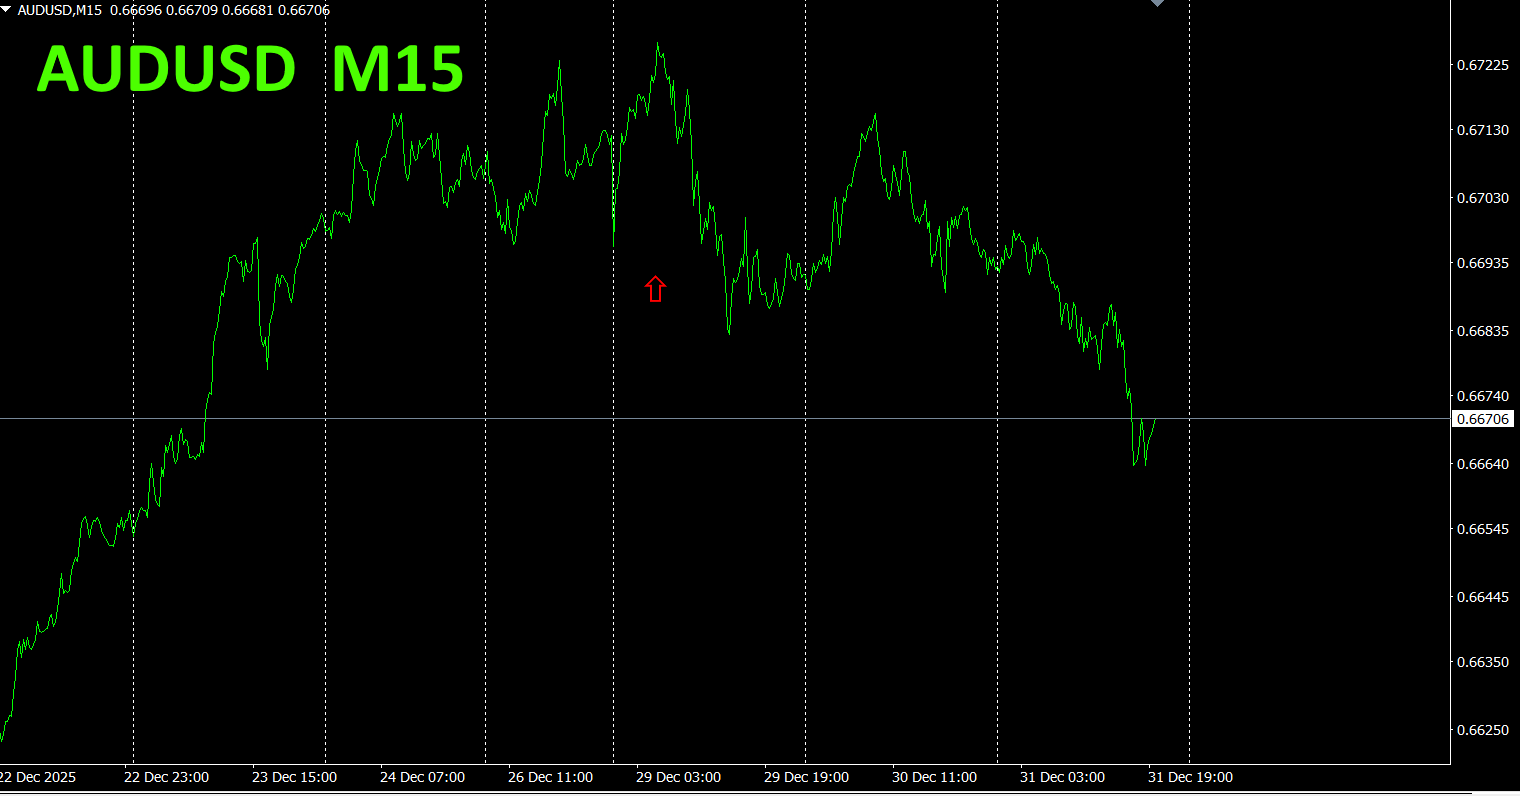
Now, look at the AUD USD chart.
The red arrows mark where the screenshot was taken. It captures the rising section.
“28 Currency Pairs Best Select Indicator” enables quickly identifying which currency among 28 pairs is showing the strongest trend. It also indicates via numbers and colors whether you should trade now. It is an excellent indicator to judge all currency pair movements at a glance.
“28 Currency Pairs Best Select Indicator””

https://www.gogojungle.co.jp/tools/indicators/35128
3. 2021 year 5 month to date, how did EURJPY move??
We have been tracking EURJPY since May 2021.
To view the overall trend, we plot roughly the last 3 weeks on a 30-minute chart.
Previously, we wrote the following.
Pink is EUR, green is JPY. EUR has a slight downward direction, JPY slightly upward. In the future, EURJPY is expected to move slightly downward.
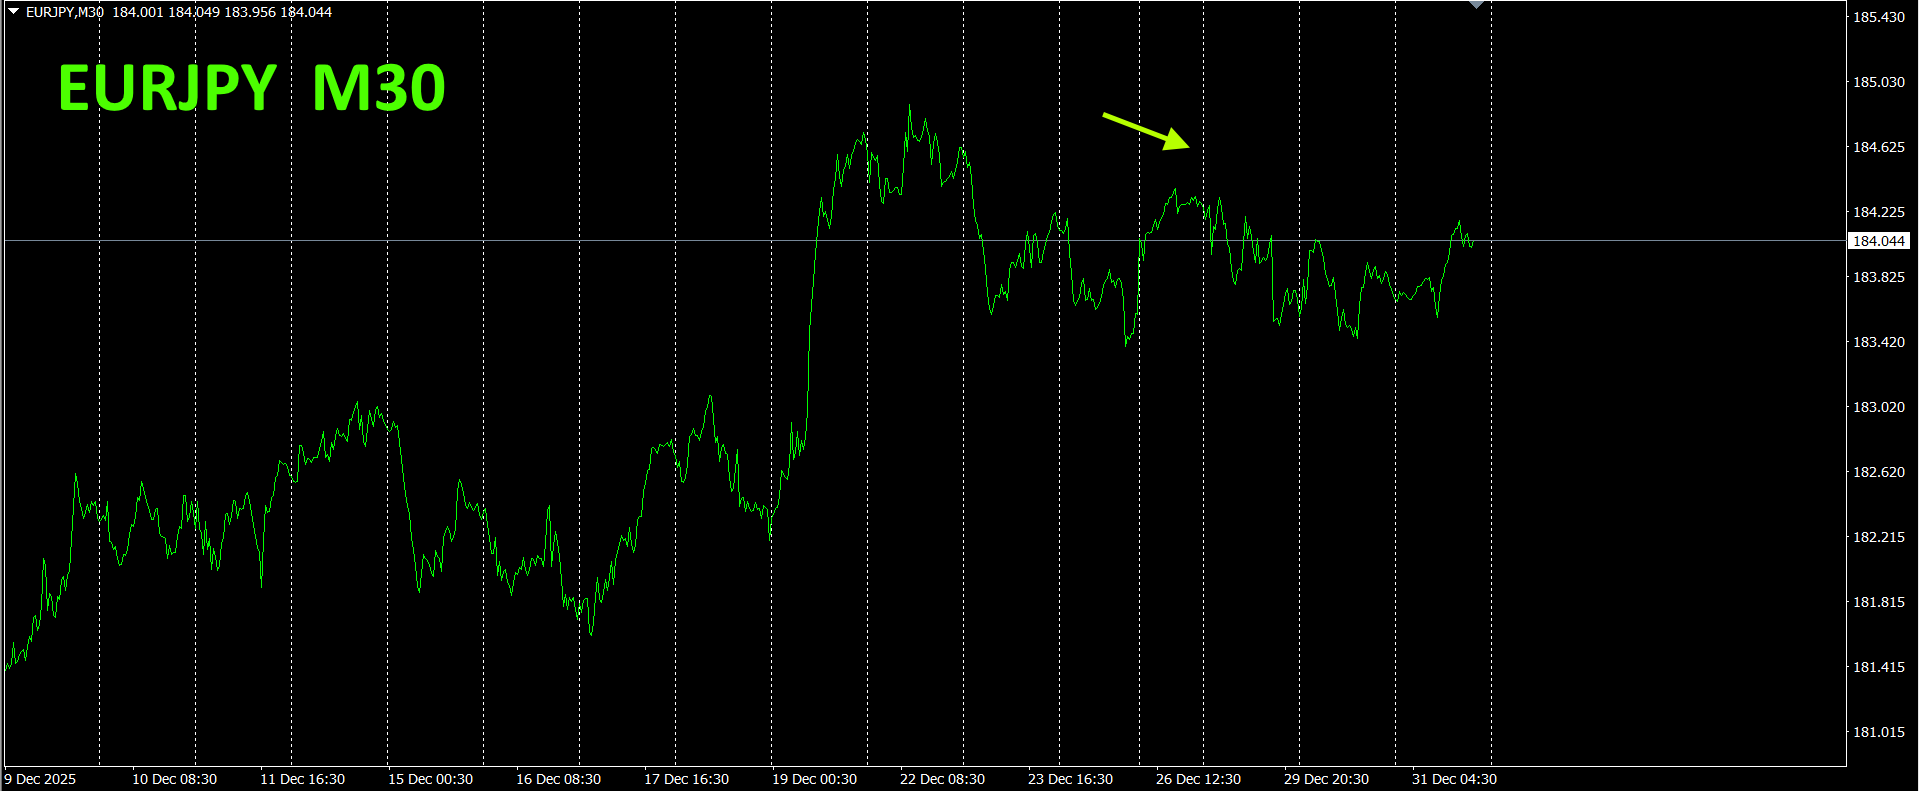
As predicted, it has been moving slightly downward.
30-minute currency strength chart. Pink is EUR, green is JPY.
EUR is moving slightly upward, JPY slightly downward, so EURJPY is expected to move upward slightly.
4. Try new indicator Dual_MACD_Trend_Indicator The new indicator are as follows.
version:https://www.gogojungle.co.jp/tools/indicators/62199
version:https://www.gogojungle.co.jp/tools/indicators/62202
MT5This indicator clearly indicates trend direction with color; if the color bars are Lime, it is a buy; Red, it is a sell; if no color, there is no trend. The color display makes it easy to grasp the trend at a glance.
In Dual_MACD_Trend_Indicator, a green zone means buy, a red zone means sell, and otherwise no trade. Simply follow this rule to remove indecision about trade direction.
5. Hyper-CSW has been released
“Hyper-CSW” is a high-performance indicator that visualizes the strength and weakness of the eight major currencies at a glance. It records the strongest currency and score over the past 10 bars for the current timeframe, enabling precise identification of trend persistence and turning points. It supports multi-timeframe analysis showing currency strength rankings (top 4 currencies) on multiple timeframes such as M15, H1, H4, D1, W1 with scores. With highly visible color lines and a separate window display, it empowers you to determine market direction. For details, see the following link.
.

https://www.gogojungle.co.jp/tools/indicators/65082
※Recommended indicators
“8CFD Visualization Indicator Any version”
https://www.gogojungle.co.jp/tools/indicators/32288
“Toretore Indicator”
https://www.gogojungle.co.jp/tools/indicators/50115
“TrendLine-EX”

https://www.gogojungle.co.jp/tools/indicators/42257
“8C Currency Strength Visualization Indicator” is described on the following pages。

MT4 version https://www.gogojungle.co.jp/tools/indicators/39150
MT5 version https://www.gogojungle.co.jp/tools/indicators/39159
【My products for sale】


