2026/1/3 Dollar-Yen, Gold, SP500, and Nikkei 225 Environment

『Trendline Pro 2』✖『Dow the Zig・Break Edge 9』
Happy New Year
We look forward to your continued support this year as well
『Dow the Zig・Break Edge』 has evolved from 5 to 9.
Development has progressed ahead of the product introduction page, but it has already been provided.
Additionally, development is ongoing, so please look forward to it.
By default, it is set to display only the most recent one of the 1–9 Breaks.
It can be easily switched with button operations.
▲Light Blueis the upper break (darkerLight Blueis the inverted triangle break)
▼Pinkis the lower break (darkerPinkis the inverted triangle break)
■ Triangulation (small white circles appear on the chart)
In the image below,『Trendline Pro 2』is also displayed on the chart.
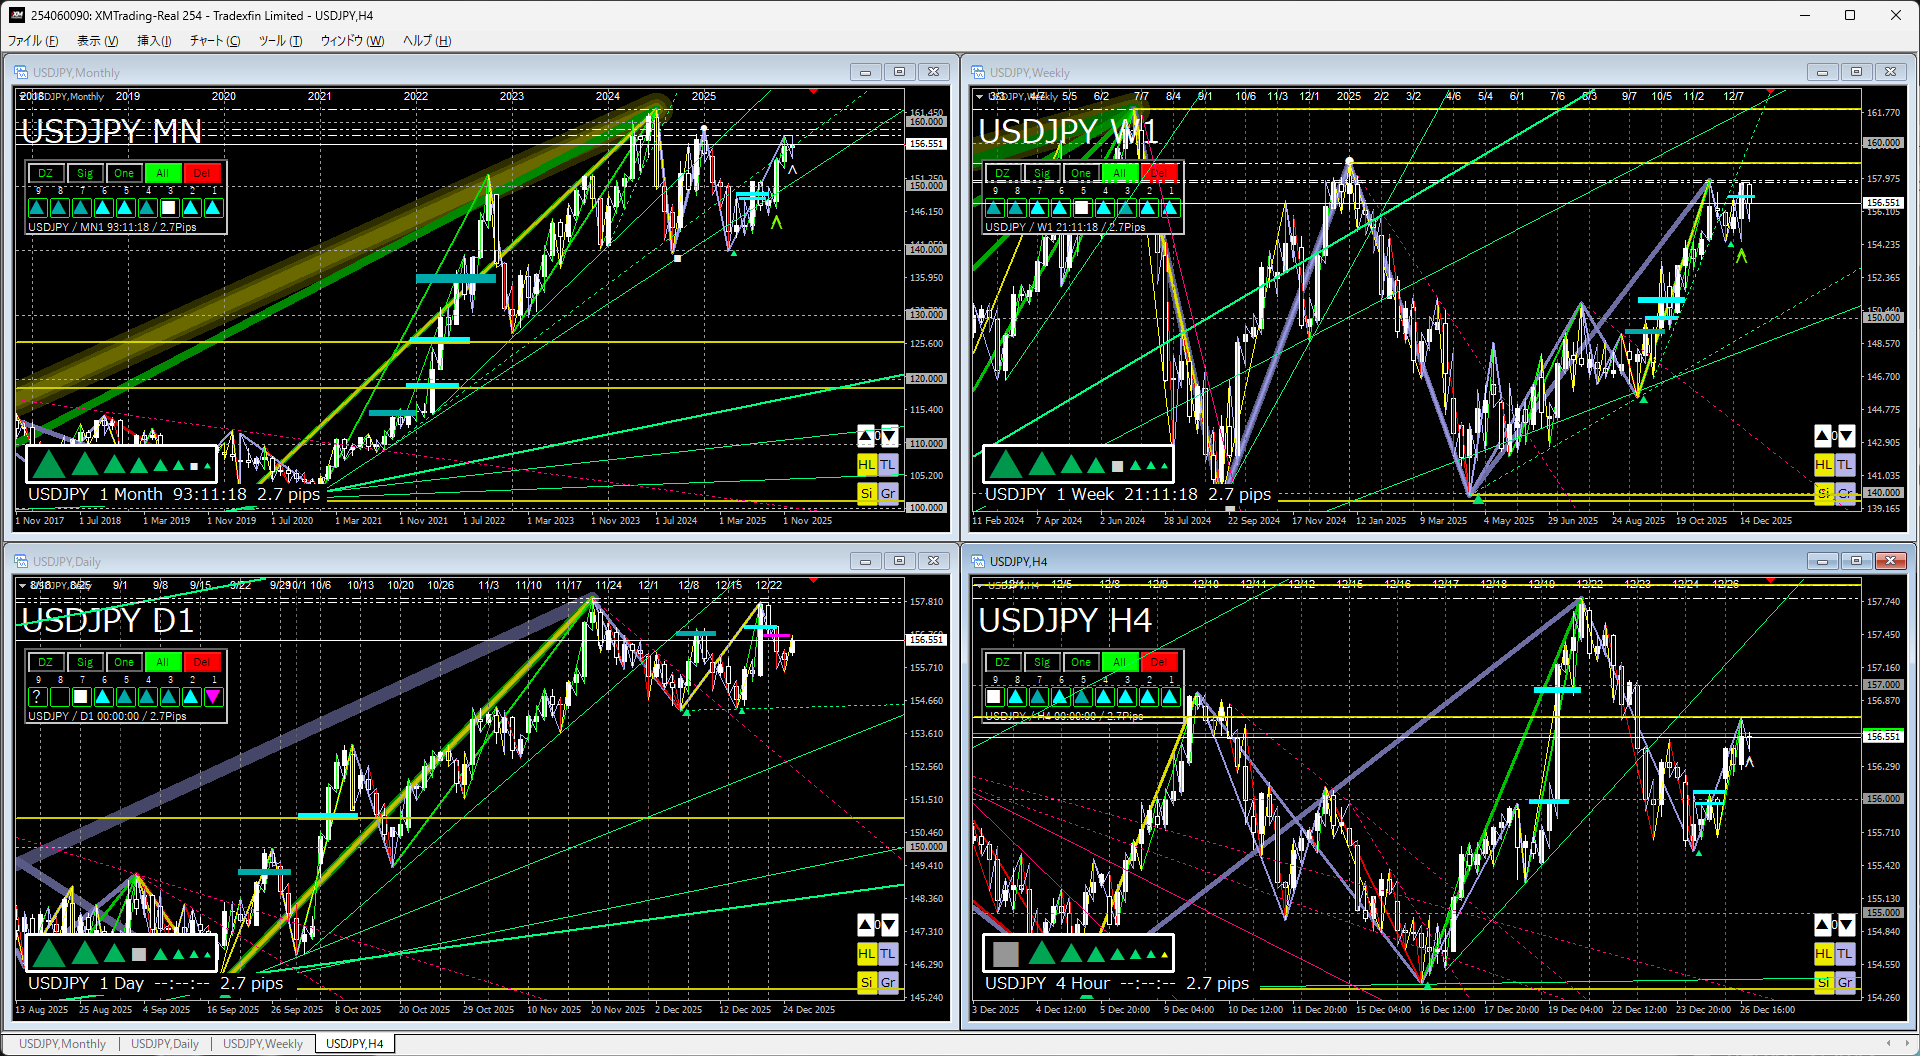
USD/JPY
↓Last week's chart↓
↓This week'schart↓
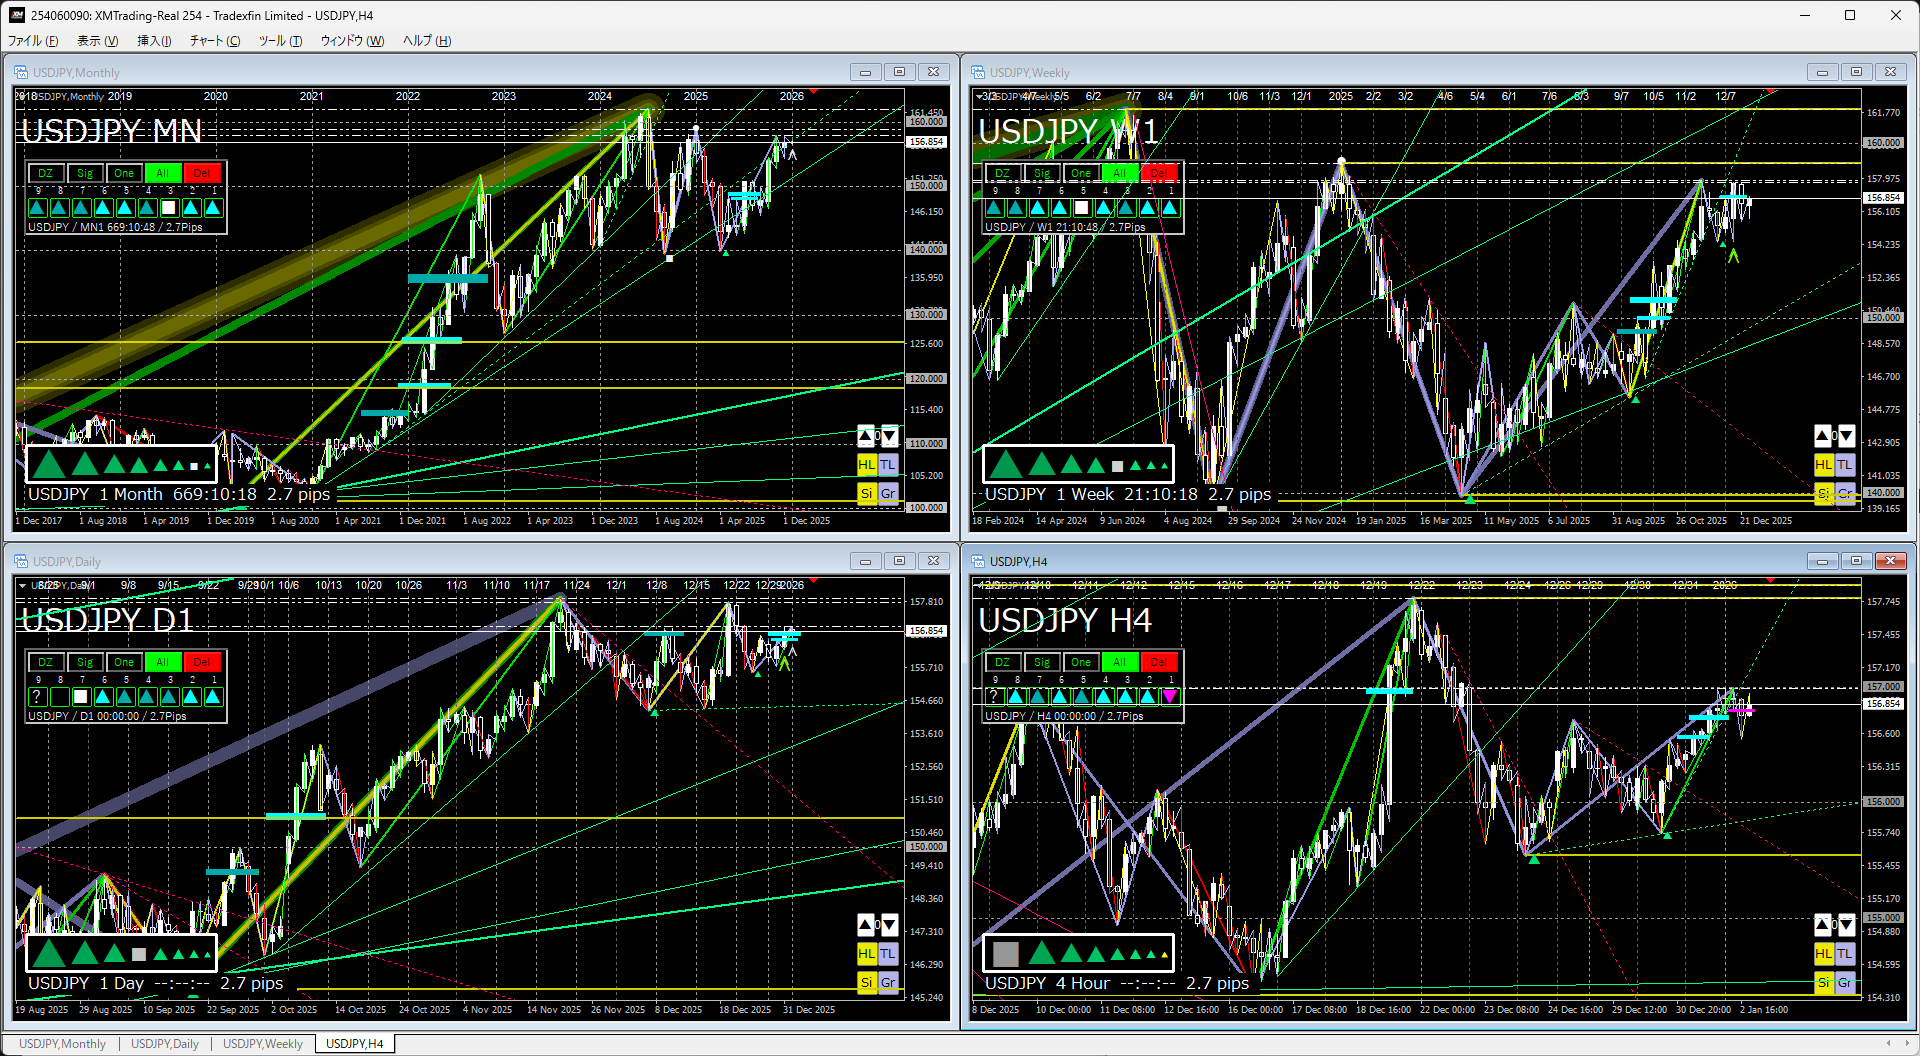
Monthly & WeeklyLooking at it, there is an ongoing move testing higher, currently a large triangle consolidation.
If it breaks above the most recent high and the triangle is broken, the long-term downtrend toward the yen will strengthen sharply.
Daily & 4HLooking, it fell back at resistance of the recent high and is again attempting higher levels.
Next week, it is expected to attempt a breakout above the recent high.
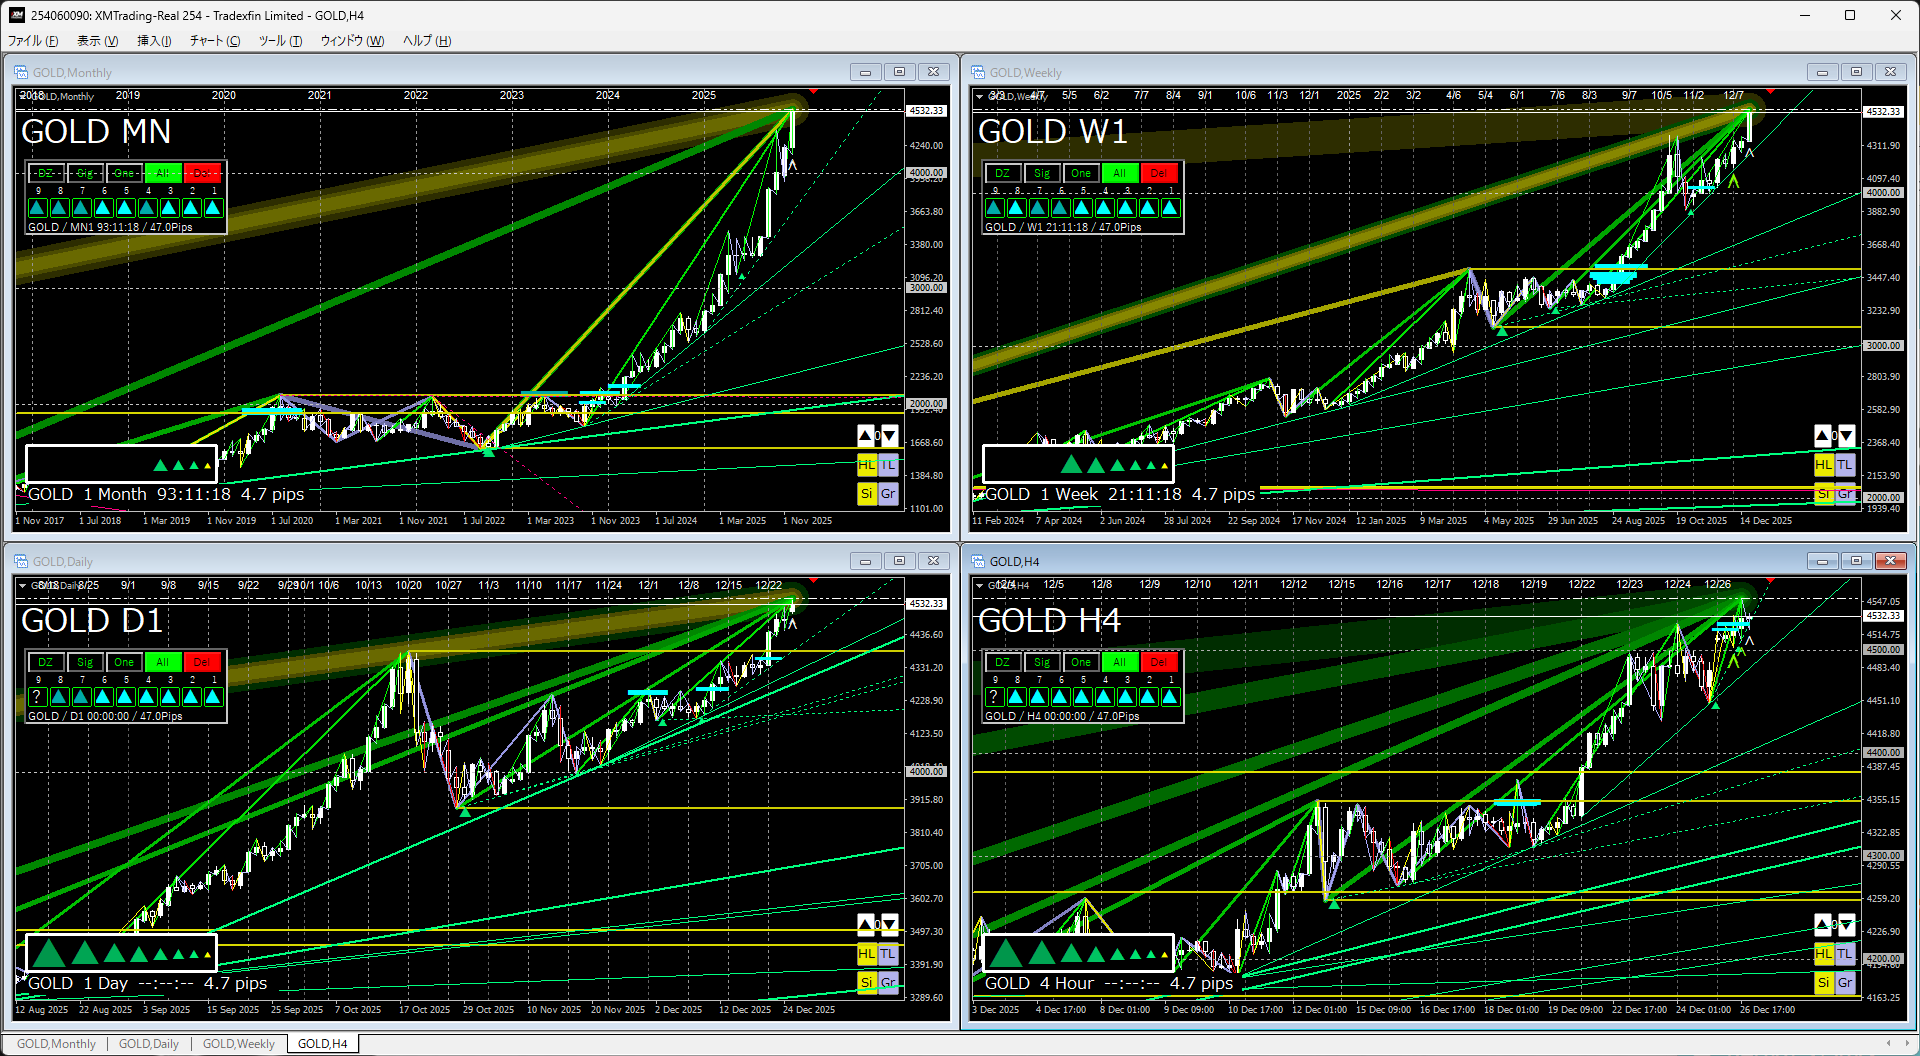
Gold
↓Last week's chart↓
↓This week'schart↓
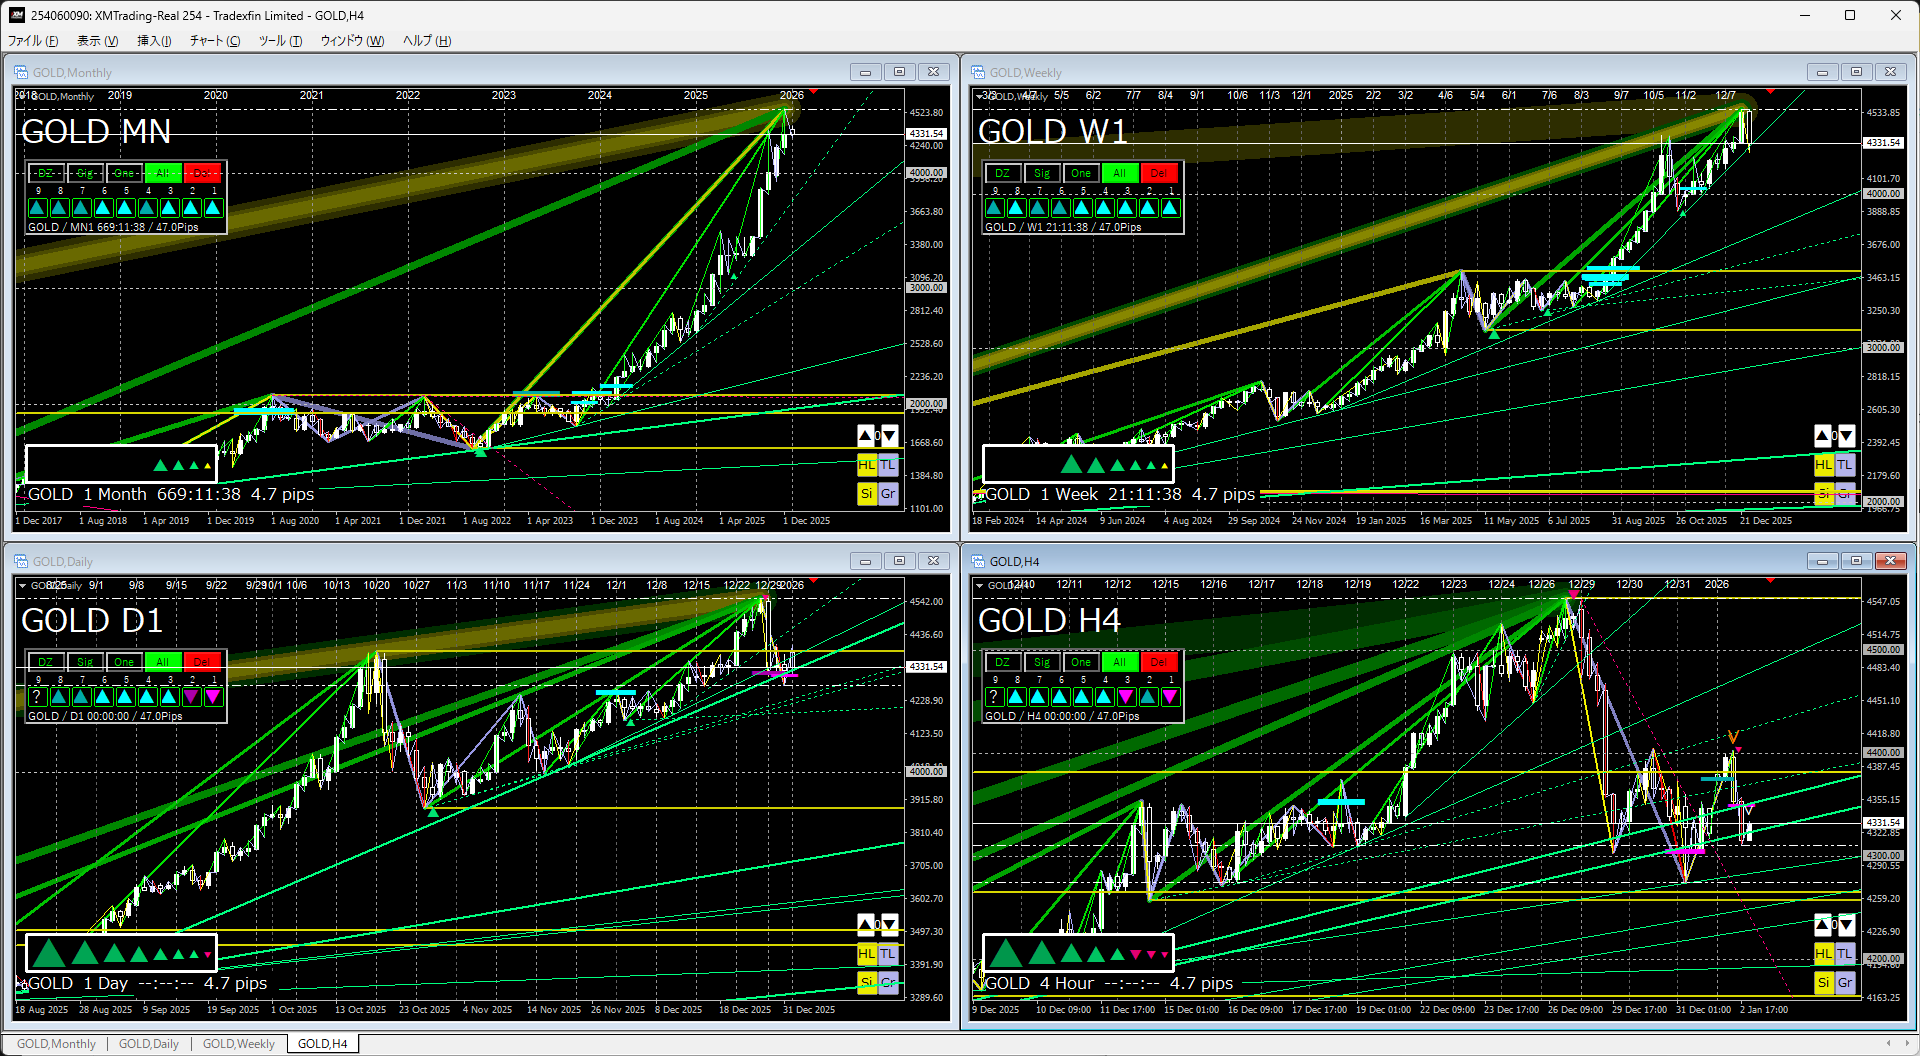
Gold remains in a buying-dominant trend.
This does not mean gold is rising, but that currency value is generally considered to be falling.
With no sellers, waiting for a sharp drop to buy is unlikely to be appropriate.
Perhaps due to unexpectedly strong moves, CME margin increases have caused adjustments.
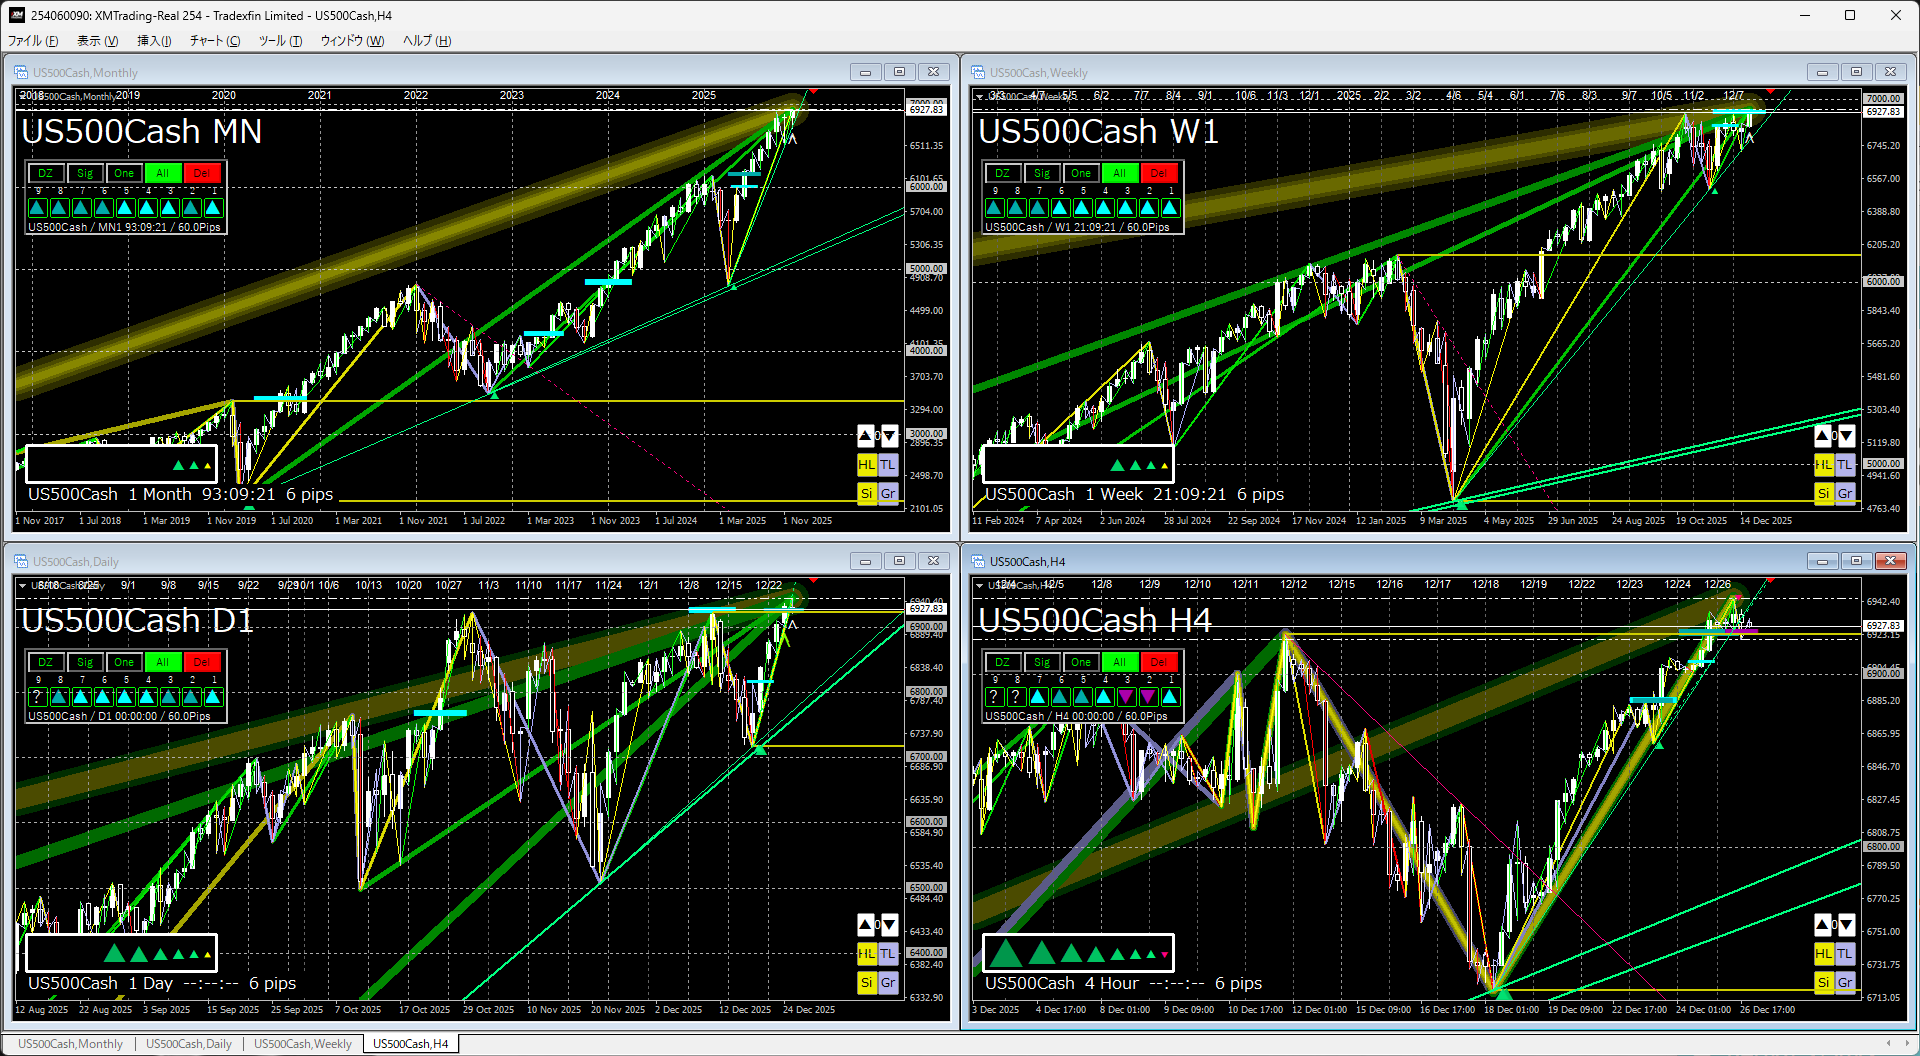
S&P 500
↓Last week's chart↓
↓This week'schart↓
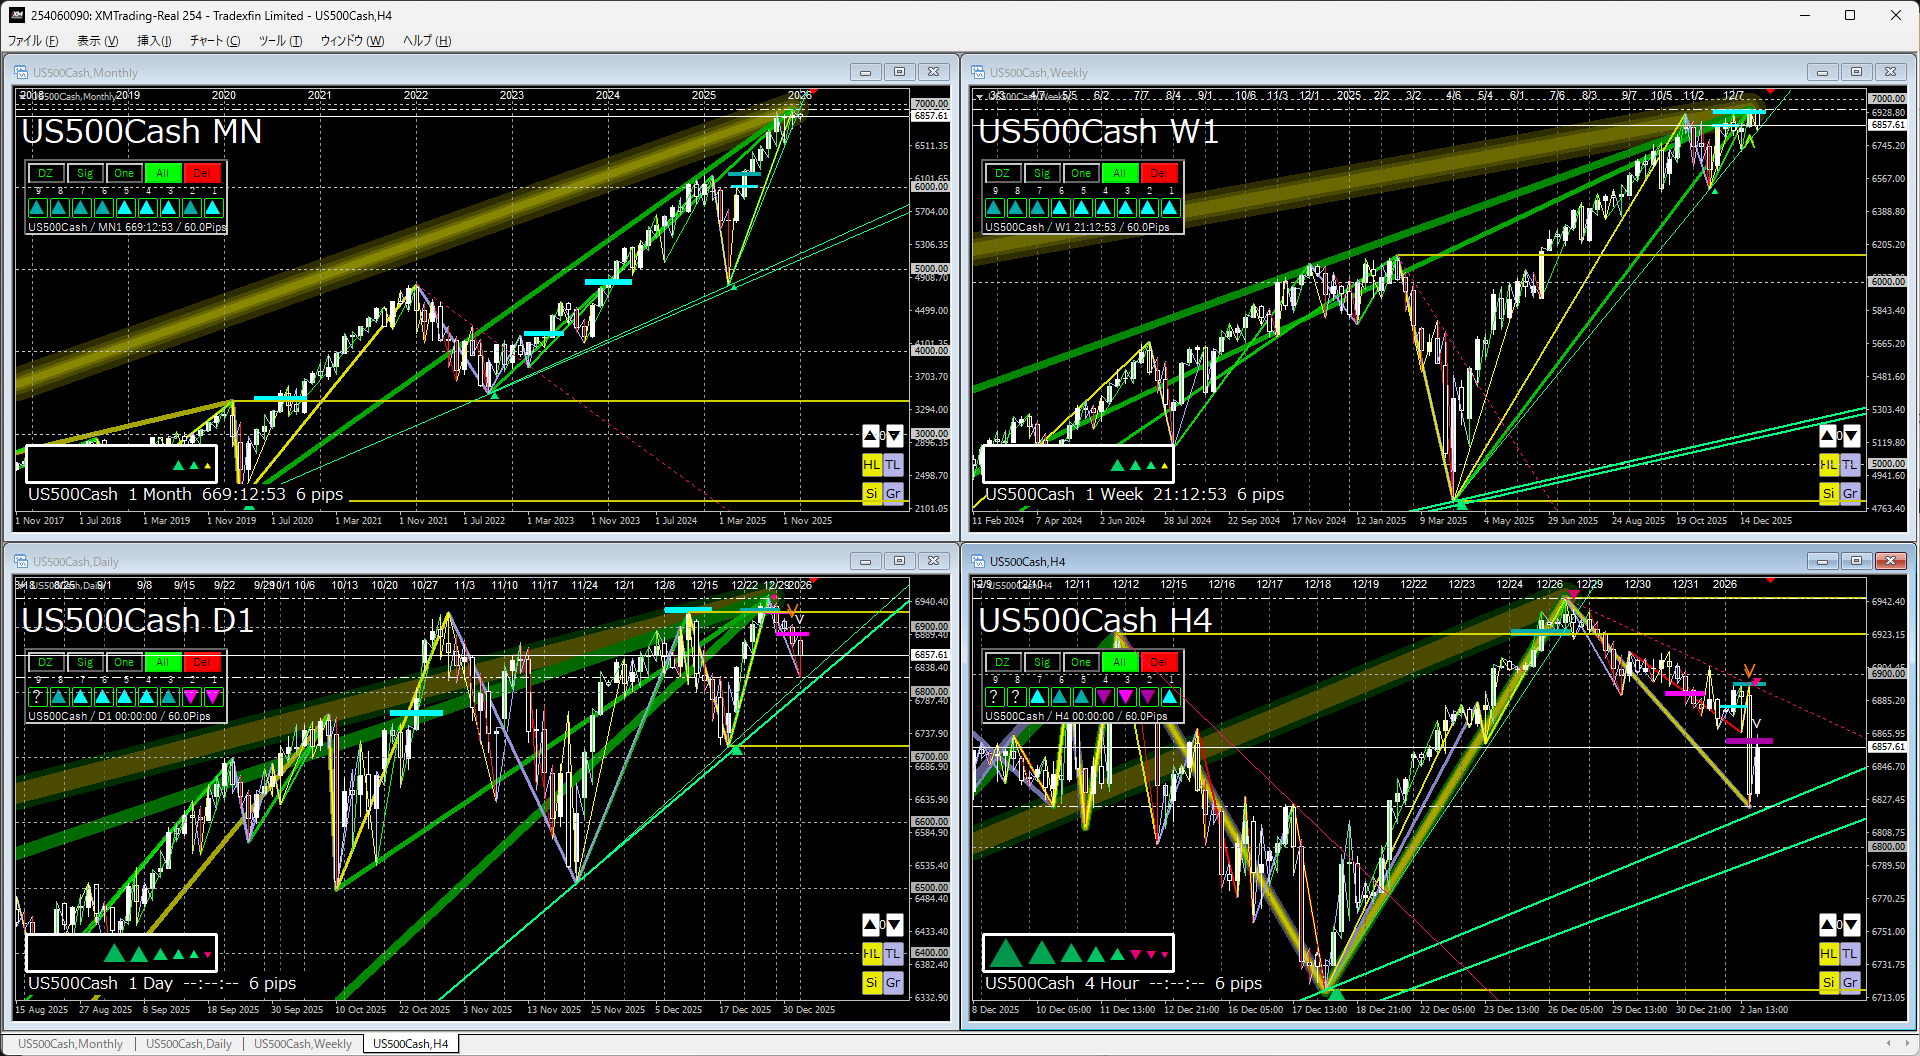
Monthly & WeeklyLooking, there is continued upside after a rebound from the trendline.
There was a brief lower break, but the environment shifted back to an upside breakout.
Daily & 4HLooking, it is supported by the trendline, continuing to make new highs and then pulling back.
The U.S. tends to follow through strongly, so unless something happens, the upside movement is expected to continue.
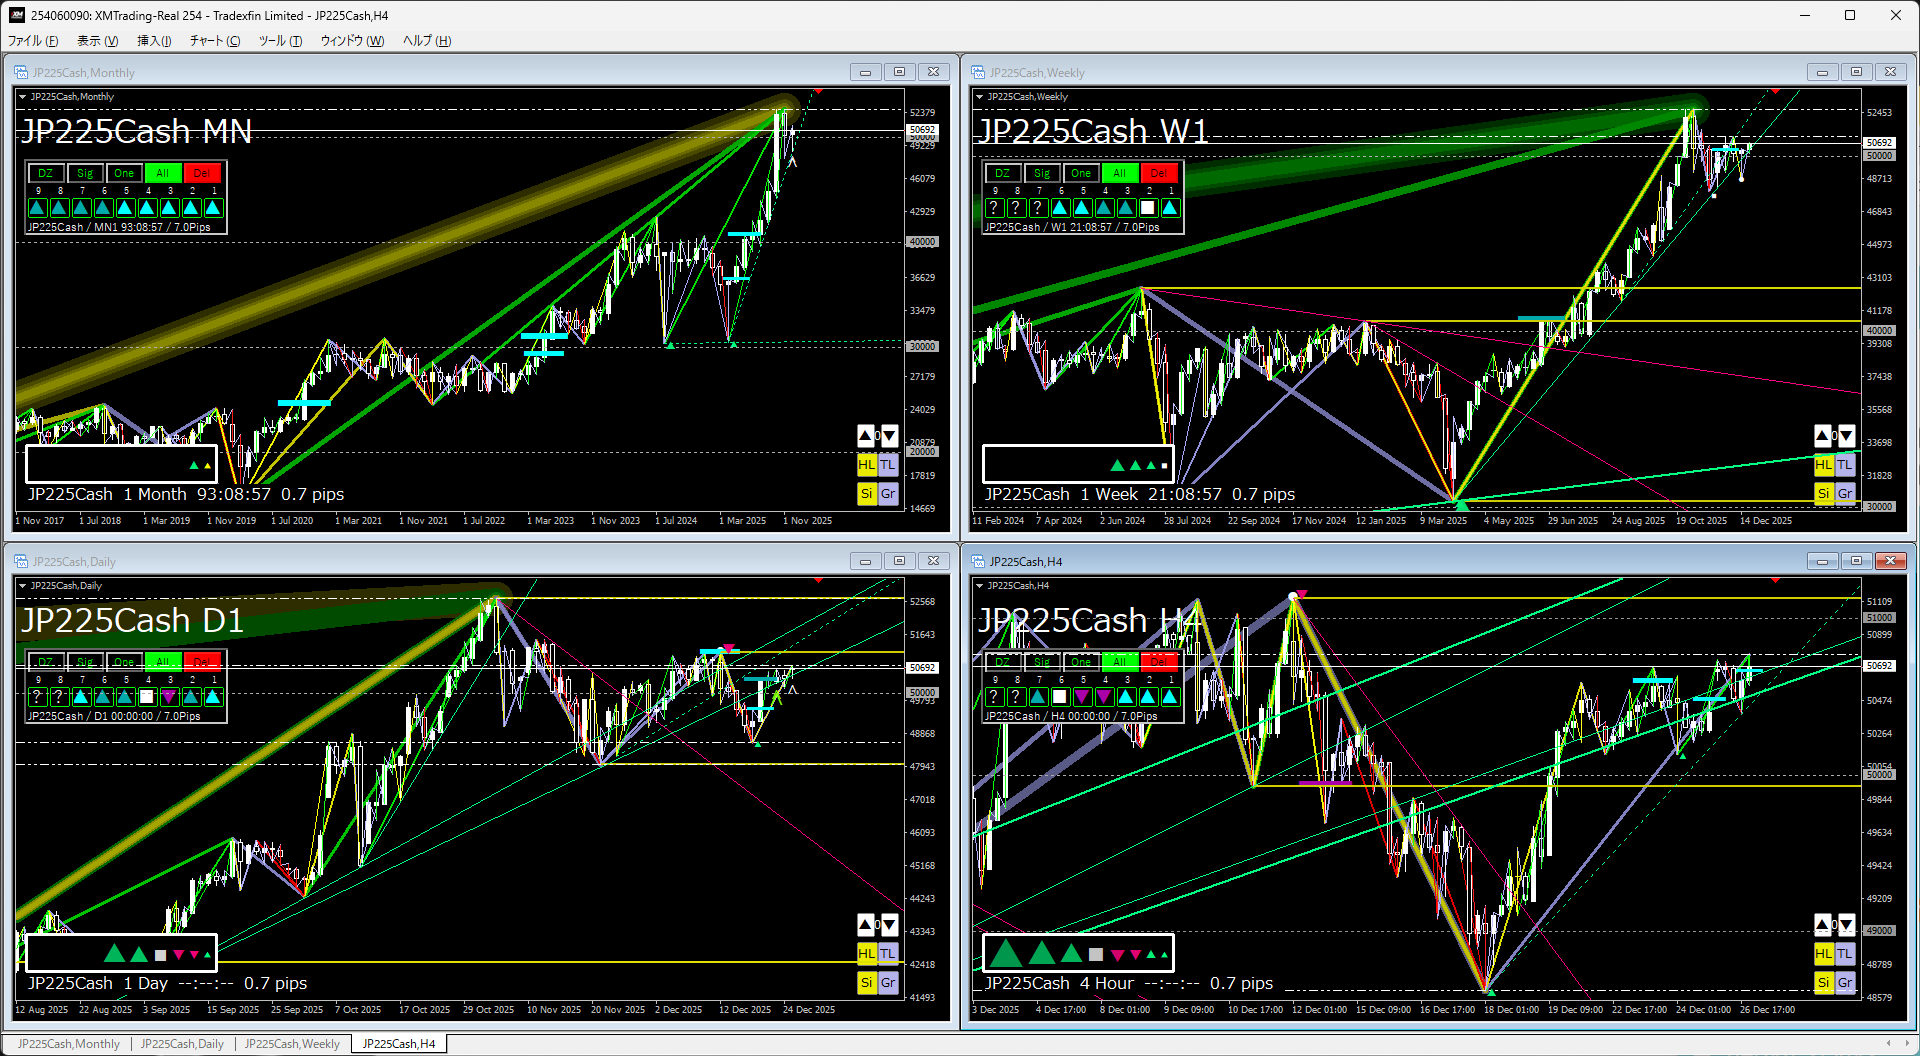
Nikkei 225
↓Last week's chart↓
↓This week'schart↓
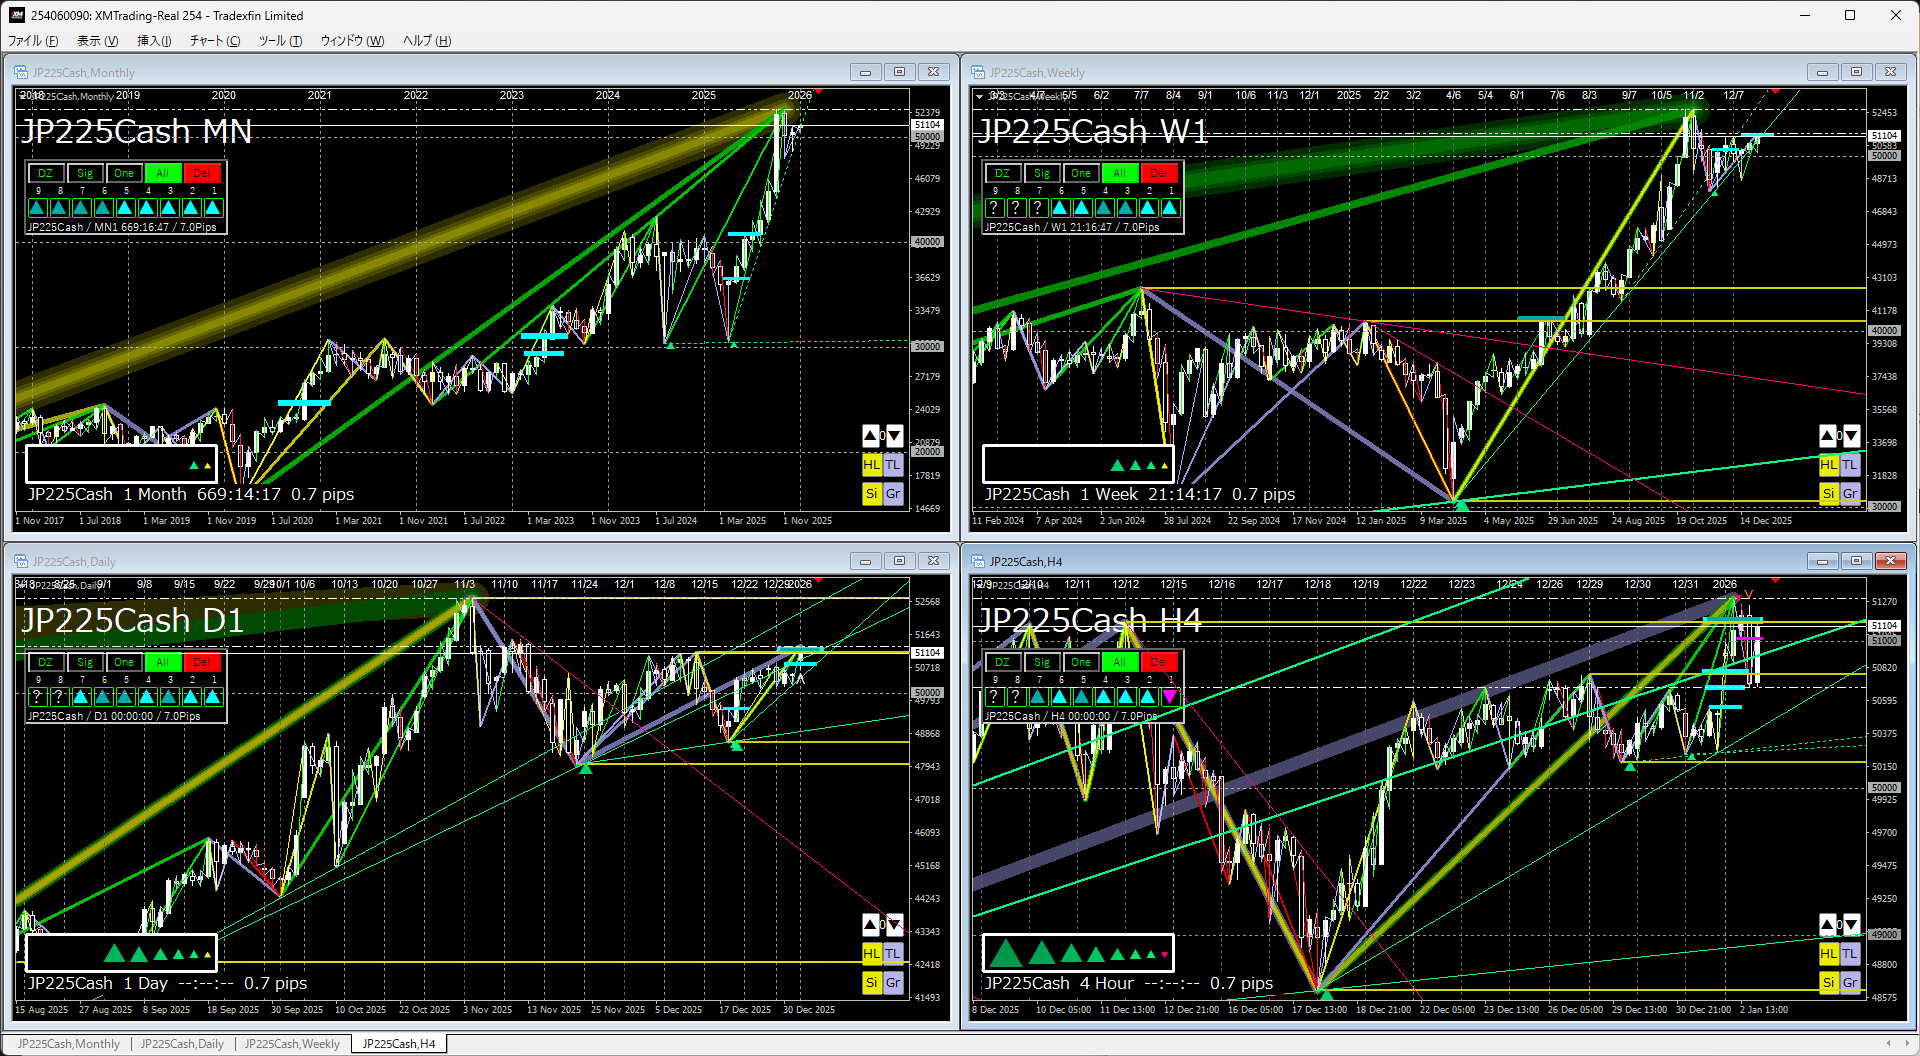
Monthly & WeeklyLooking, it is rising strongly after a double bottom breakout.
Recently, it is again testing higher levels.
Daily & 4HLooking, it has broken out of a triangle consolidation, making higher levels more likely.
Next week, it is highly likely to move toward the next high.
If you are interested, please take a look.
『Trendline Pro 2』✖『Dow the Zig・Break Edge 9』
If you would like to continue to see this articlein the futureplease press the button.
If you have any requests such as “I’d like to see more articles like this,” please feel free to tell us.