【Video】Stop the Indicator Right Now. All About Candlesticks Explained by Candlematsu
This is the introductory video lecture in a comprehensive volume where Candlematsu, who deeply loves candlestick charts, explains the essence of chart analysis. If you truly want to understand market movements and make profits in FX, you need to be able to understand what is discussed in this video. (Report: FX攻略.com Editorial Department Ebizawa Michihiko)
What you can learn from this video
In this video, you will learn the following.
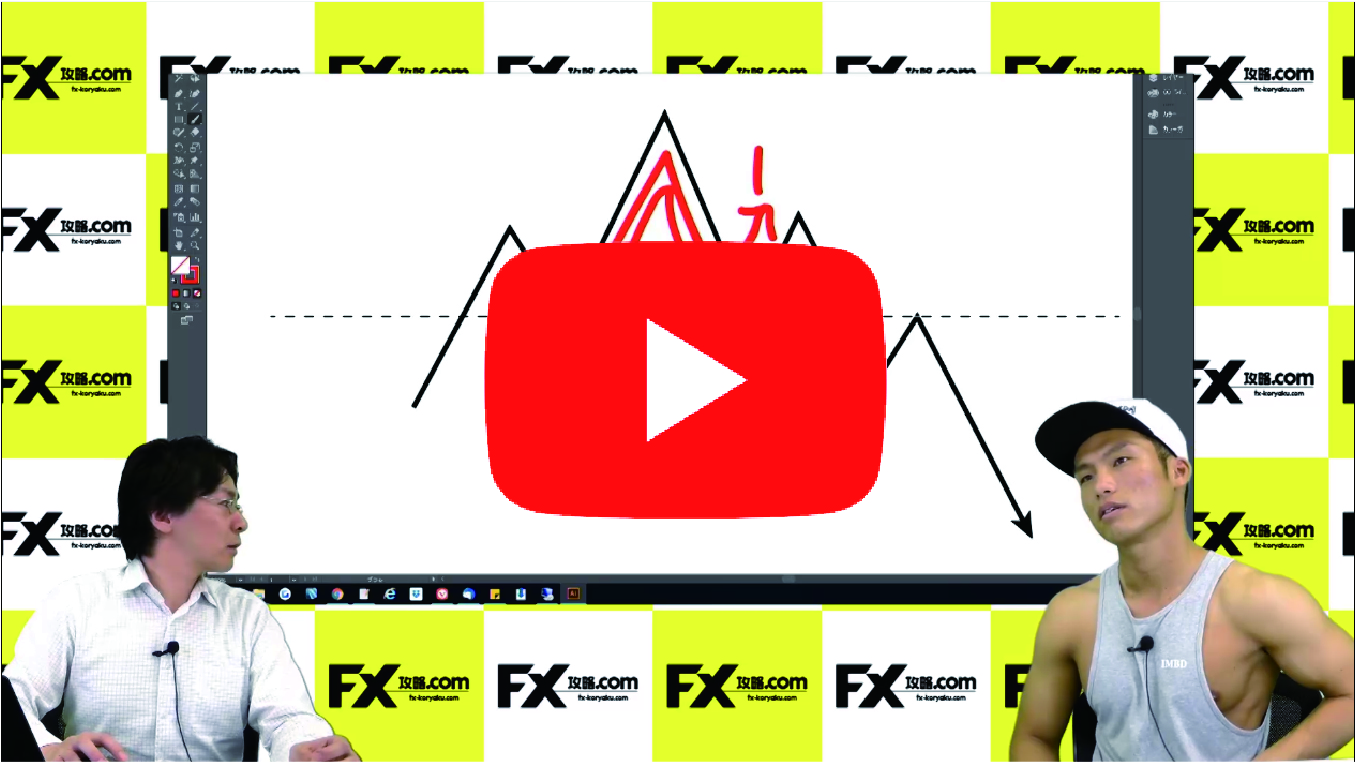
- Keep staring at the candlestick chart
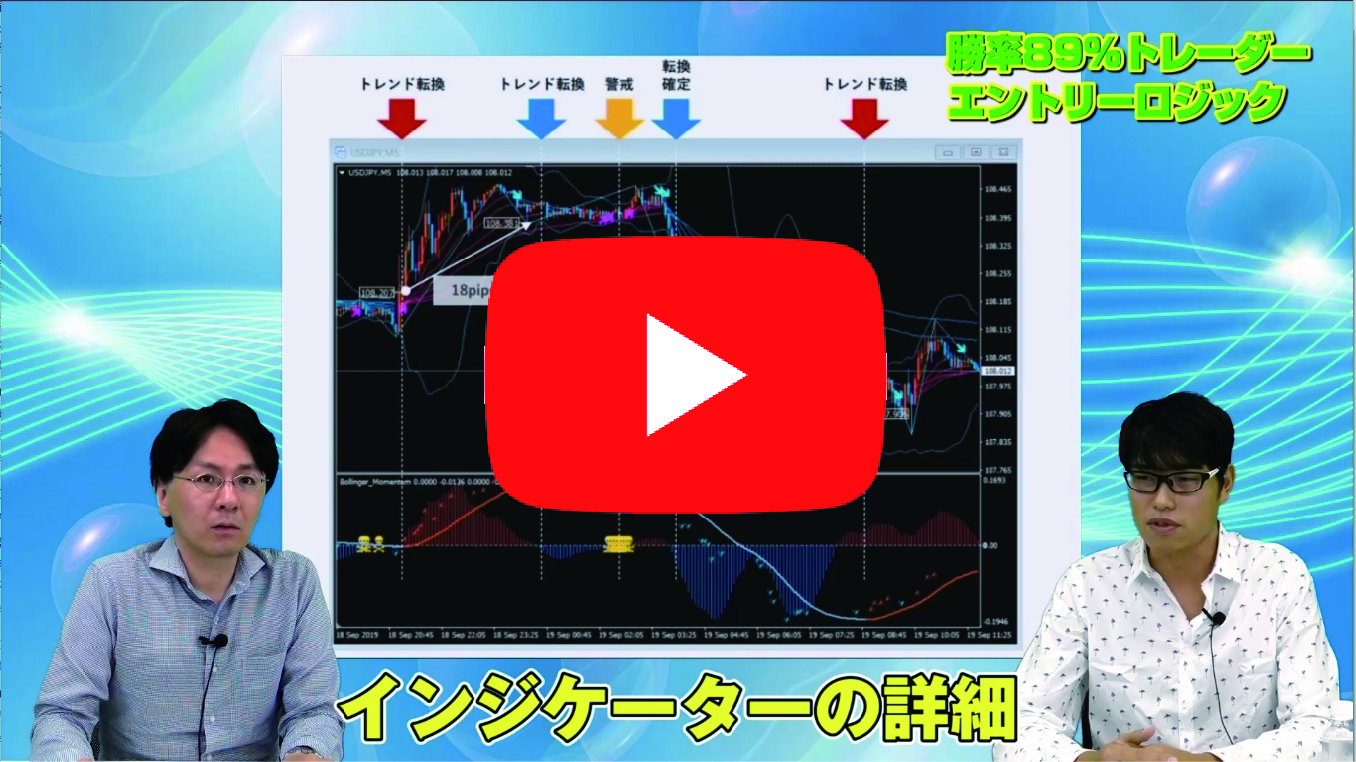
- First, stop using indicators
- Imagination is important
- Contrarian trading is the premise
- Be conscious of the chart patterns
- Why ranges are formed
- Observe the trend closely
- Absolute rules during a trend
- Is the market being properly bought and sold?
- The battle between buyers and sellers
- Visualize the clash of expectations
- Active ranges and quiet ranges
Video: 27 minutes 31 seconds
Candlematsu's Profile
A binary trader and programmer who loves candlesticks and wishes to be loved by candlesticks in return. Systematically explains the knowledge built while facing charts daily.
A word from the editor in charge, Ebizawa

First, stop using indicators. This part is very shocking and yet practical in its thinking.
Rather than relying on indicators calculated from prices, consider what is happening on the chart in front of you now. Without knowing this, it will be difficult to profit in FX.
How to watch FX technique videos
The section accessible to those who have purchased the article (at the bottom of this article) embeds the FX technique video. Click the play button to start the video.