

Utilization of the "Visualization Indicator" (Part 231)
Utilization of the "Visualization Indicator" (part231)
1. Further evolve the "28 Currency Pairs List Indicator" into an indicator
“8CPVisualization Indicator”to draw USDCHF
The “8CPVisualization Indicator” includesOceania版,版,版,版. This time, we used the版.
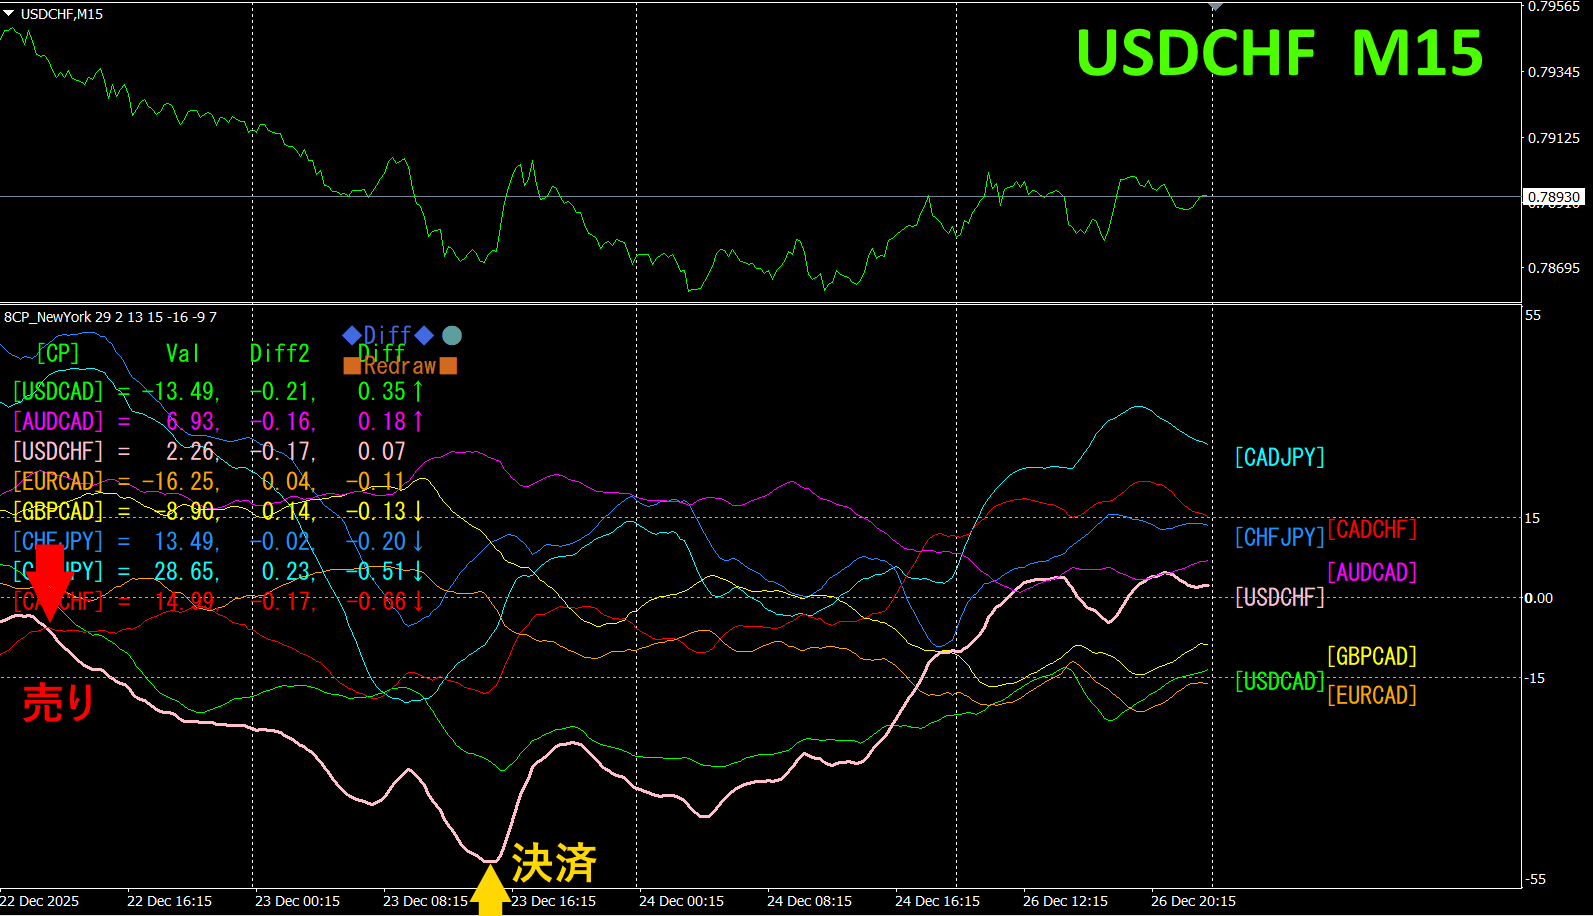
The upper half is theUSDCHF 15-minute chart. The lower half is the “8CPVisualization Indicator”, where the pink bold line corresponds toUSDCHF.
On Monday, theUSDCHF chart broke below the other charts, so we sold. The next day, it reached a bottom and we closed the trade. Profit was about70 pips.
Currency Strength/Weakness Chart
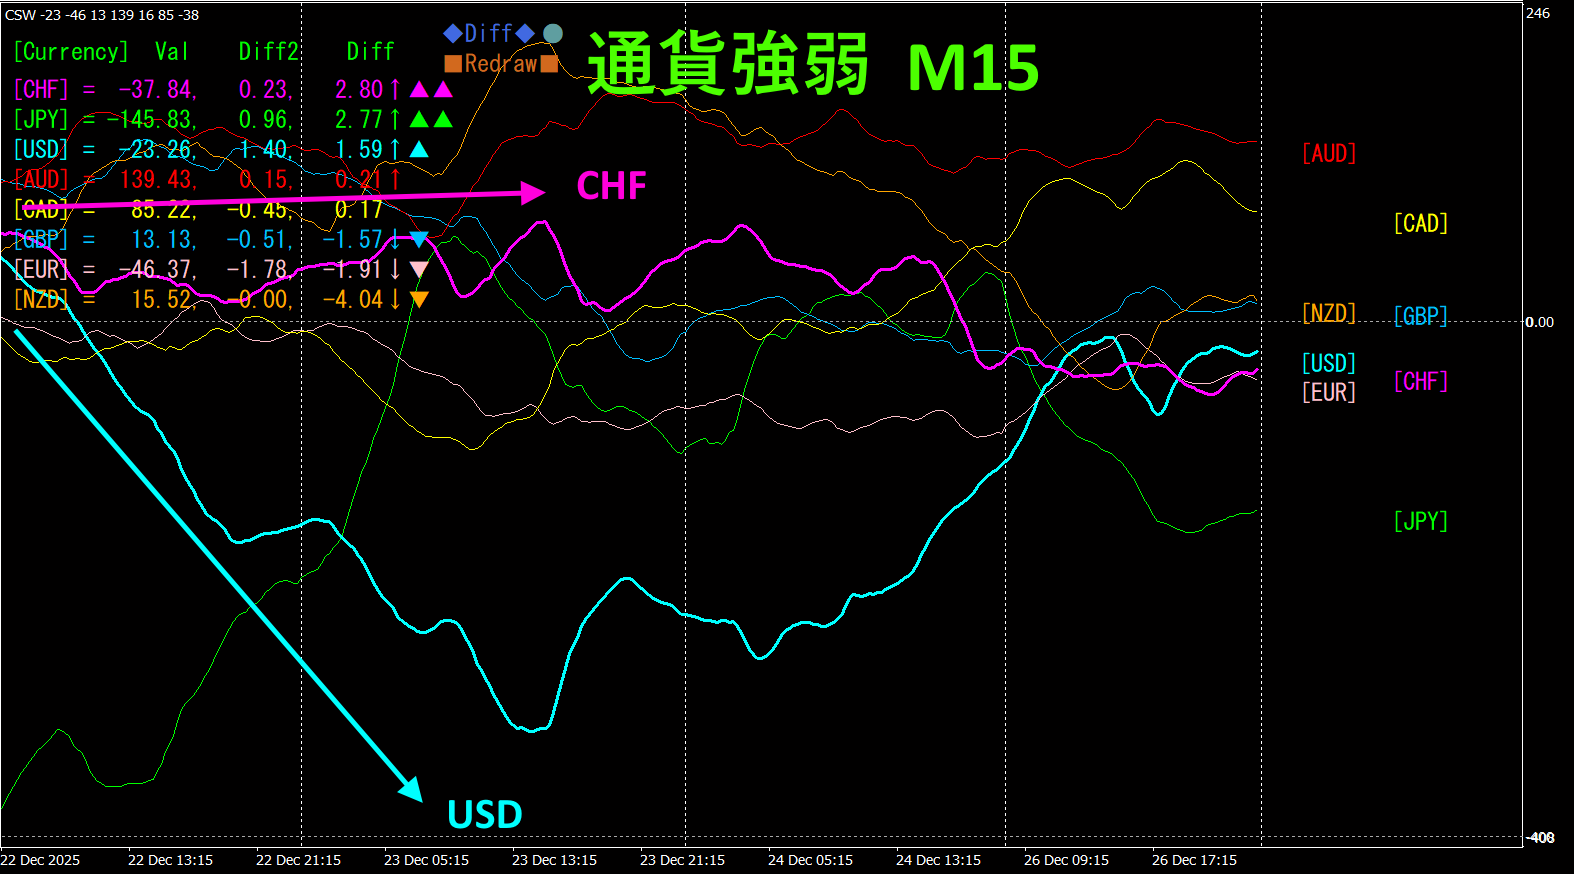
Looking at the 15-minute currency strength/weakness chart,
“Aim for currency strength inverse correlation!”is
If you use “
2. Best SelectIndicator to try
The figure below is a screenshot from2025 year month day
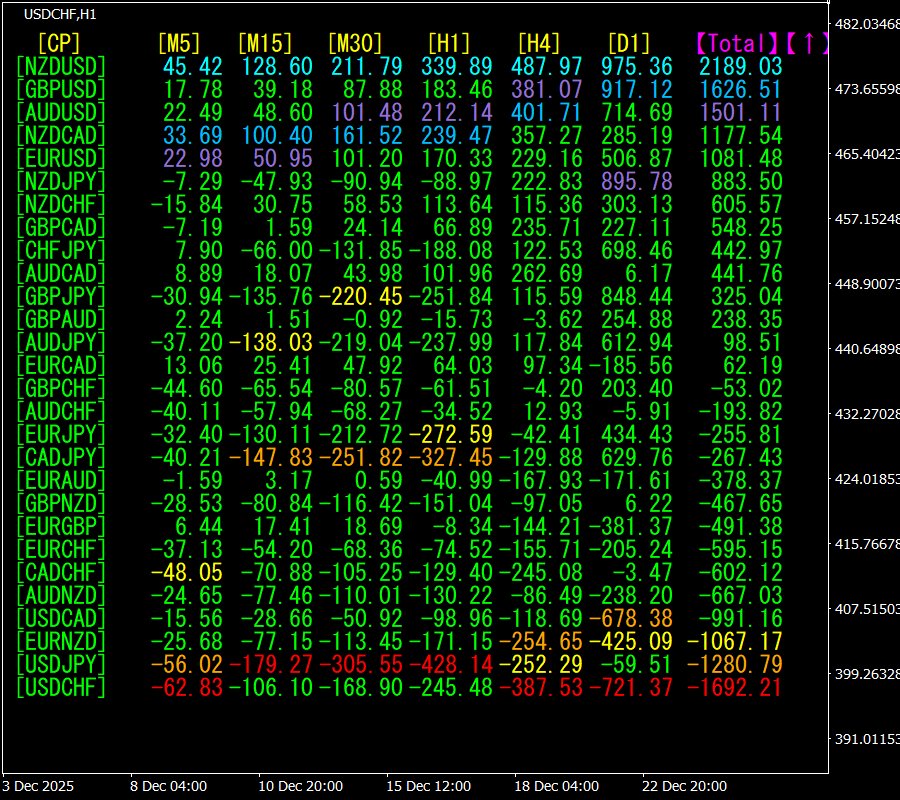
[Total] ranking by descending values. At the very top,NZDUSD is blue on all timeframes., indicating a strong uptrend for NZDUSD. shows an uptrend.
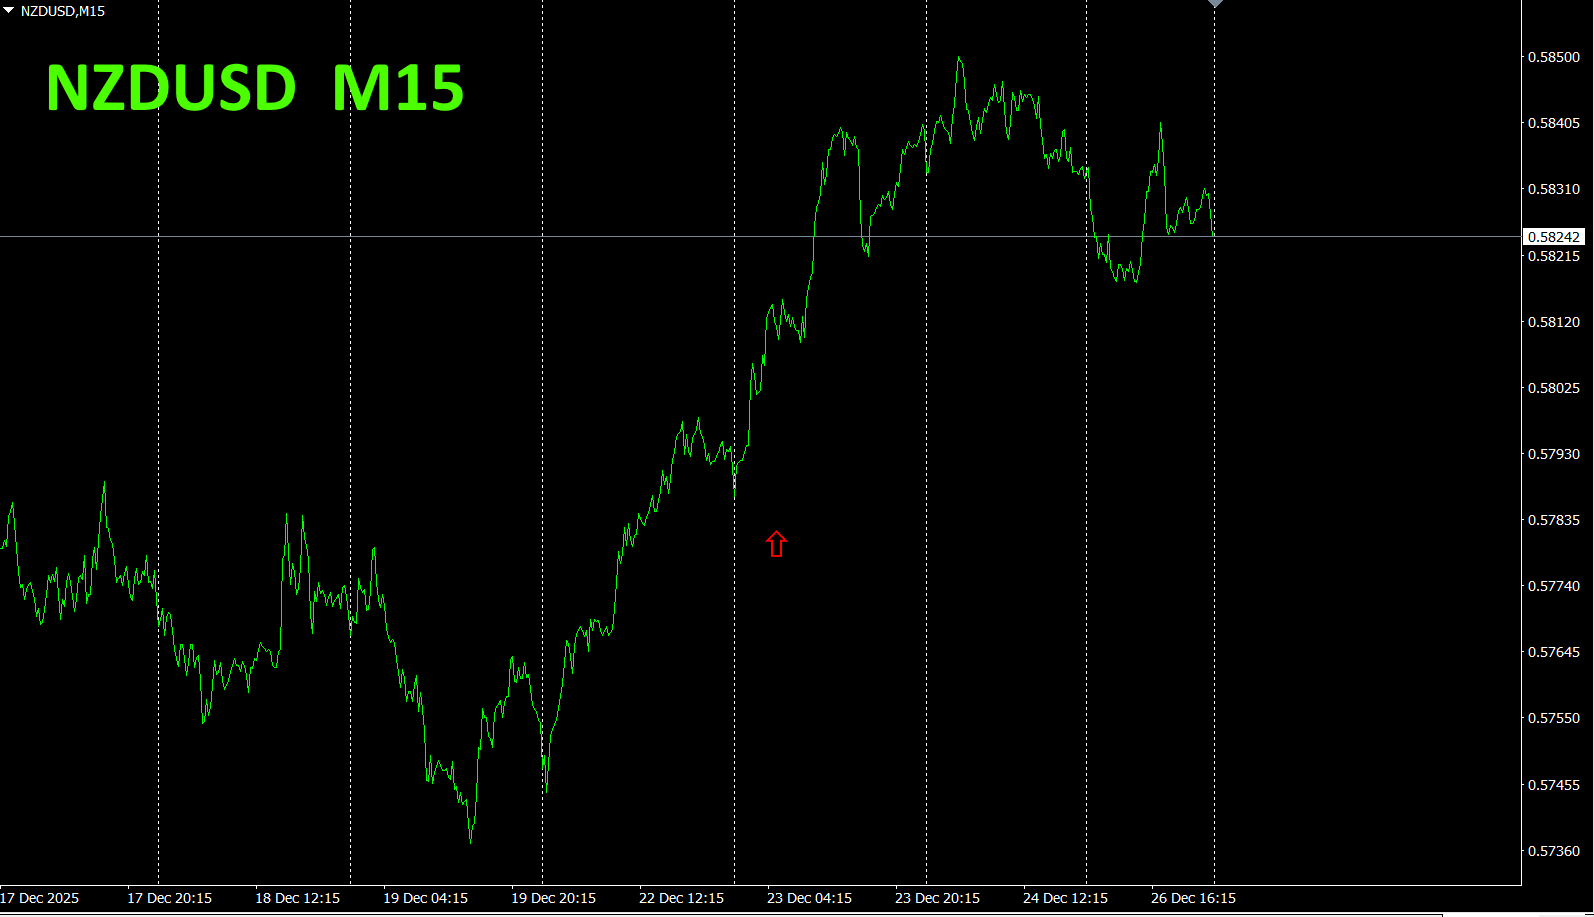
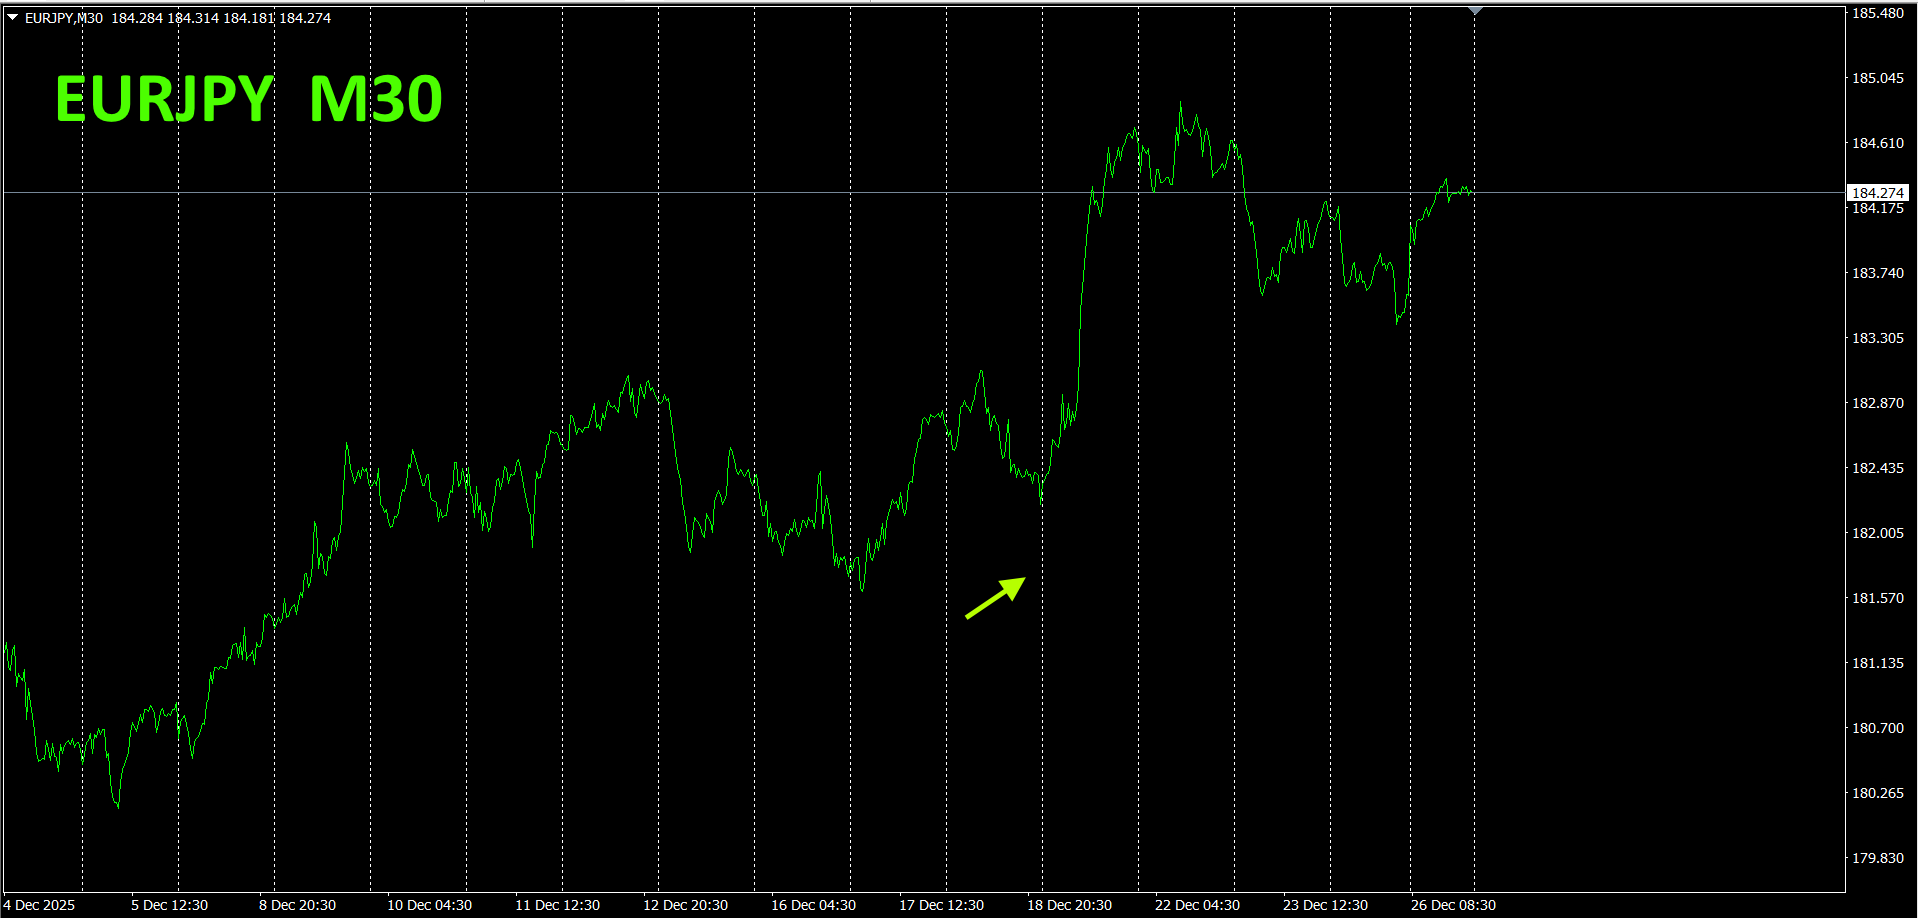
Now, let’s look at the chart.
The red arrow marks the point where the screenshot was taken, capturing the rising portion.
“28 currency pairs Best Select
“28 currency pairs Best Select
https://www.gogojungle.co.jp/tools/indicators/35128
3. Since 2021 year month, what happened with EURJPY
year month, movement tracked.
To view the overall trend, a30 minute chart shows approximately weeks of data.
Last time, we wrote as follows.
Pink is, green is. shows a horizontal movement, drops sharply. is weak, so we expectEURJPY to continue rising.
As predicted, the uptrend continues.
minute currency strength chart.
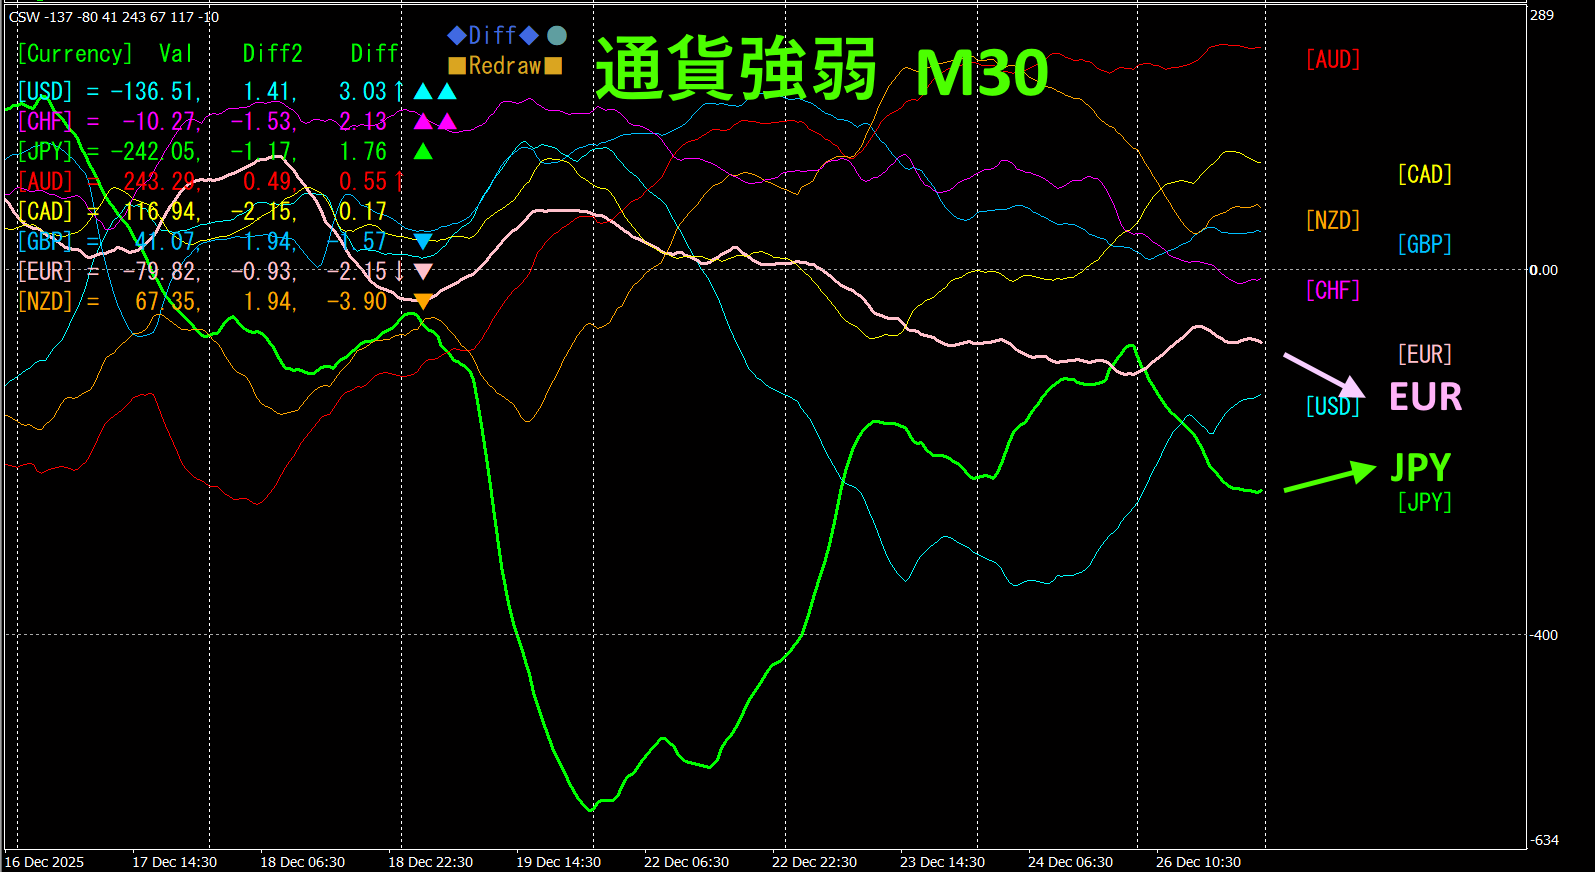
Pink is, green is. trends slightly downward, trends slightly upward. Moving forward, is expected to trend downward slightly.
4.Trying the new indicatorDual_MACD_Trend_Indicator. done
New indicator “Dual_MACD_Trend_Indicator” please see below.
MT4 version:https://www.gogojungle.co.jp/tools/indicators/62199
https://www.gogojungle.co.jp/tools/indicators/62202
An indicator that clearly shows the direction of the trend with color. If the color bar is Lime, it’s a buy; if Red, it’s a sell. It’s beginner-friendly. A green bar indicates an uptrend, a red bar a downtrend, and no color means no trend. Because it’s color-coded, you can grasp the trend at a glance.
This indicator was applied to the USDCHF1 hour chart.
The red sell zone and the green buy zone are clearly separated, making trading easy at a glance. Focus on the red-zone ellipse on the chart to sell, and profits will follow. By using the “Dual_MACD_Trend_Indicator,” you can trade only in the areas where the trend is strongest.
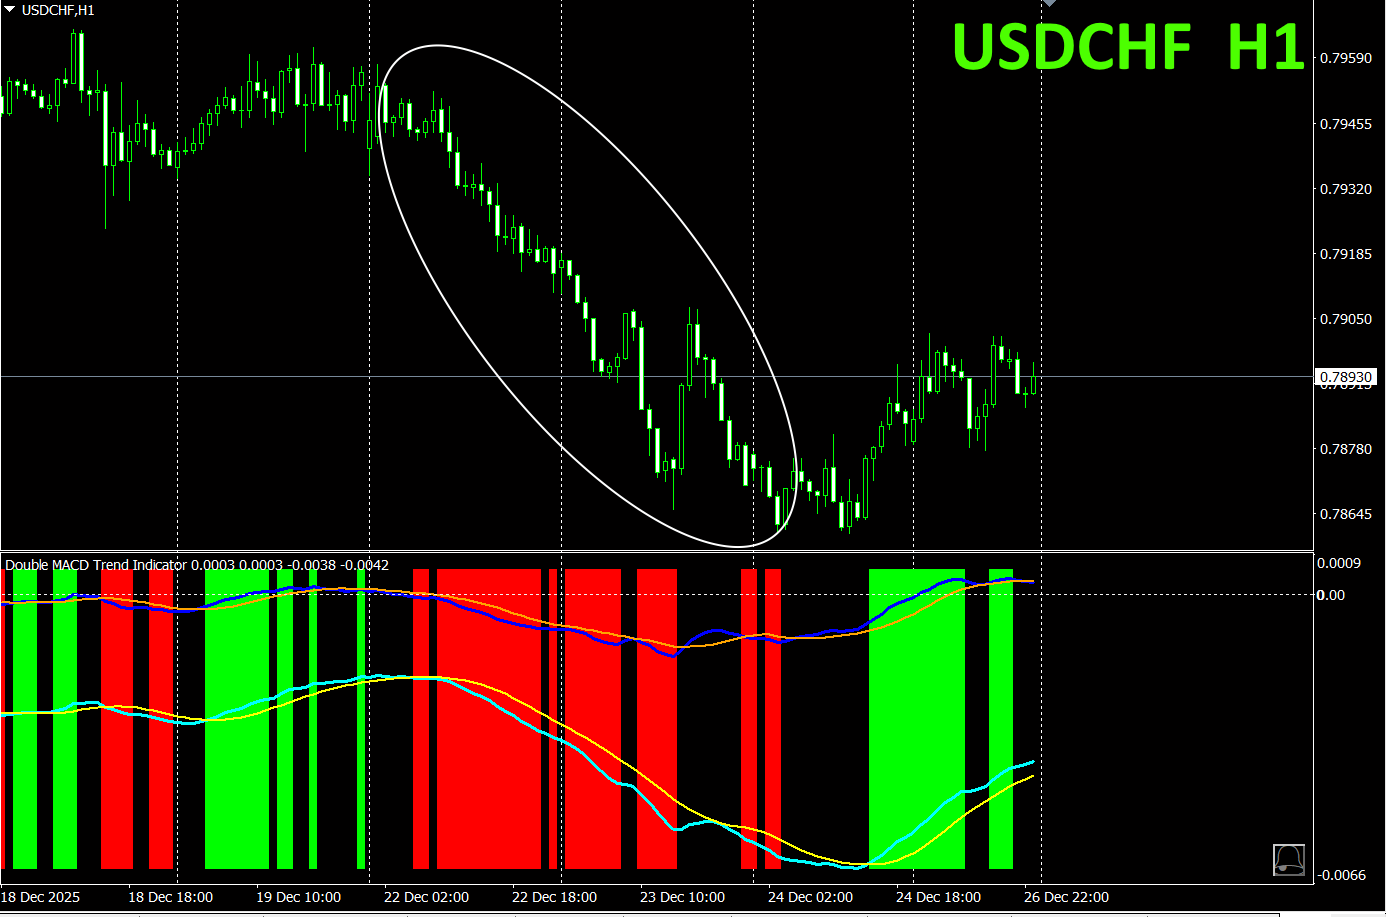
In the “Dual_MACD_Trend_Indicator,” follow the simple rule: buy in the green zone, sell in the red zone, and do not trade otherwise.
With the Dual_MACD_Trend_Indicator, you will never be unsure of the trade direction again.
5.
“Hyper-CSW” has been released
“Hyper-CSW” is a high-performance indicator that visualizes the strength/weakness of the major eight currencies at a glance. It records the strongest currency and a score for the past 10 bars on the active timeframe, enabling accurate assessment of trend persistence and turning points. Moreover, it supports multi-timeframe analysis, displaying currency strength rankings (top 4 currencies) across multiple timeframes such asM15H1H4D1W1
For details, please see the following link.
https://www.gogojungle.co.jp/tools/indicators/65082
※ Recommended indicators
“8CFD Visualization Indicator version”
https://www.gogojungle.co.jp/tools/indicators/32288
“Trendy Indicators”
https://www.gogojungle.co.jp/tools/indicators/50115
“TrendLine-EX”

https://www.gogojungle.co.jp/tools/indicators/42257
“8C Currency Strength Visualization Indicator” please refer to the following page.
MT4 version https://www.gogojungle.co.jp/tools/indicators/39150
MT5 version https://www.gogojungle.co.jp/tools/indicators/39159
【My listed items】


