■ USD/JPY Daily Chart Forecast Today
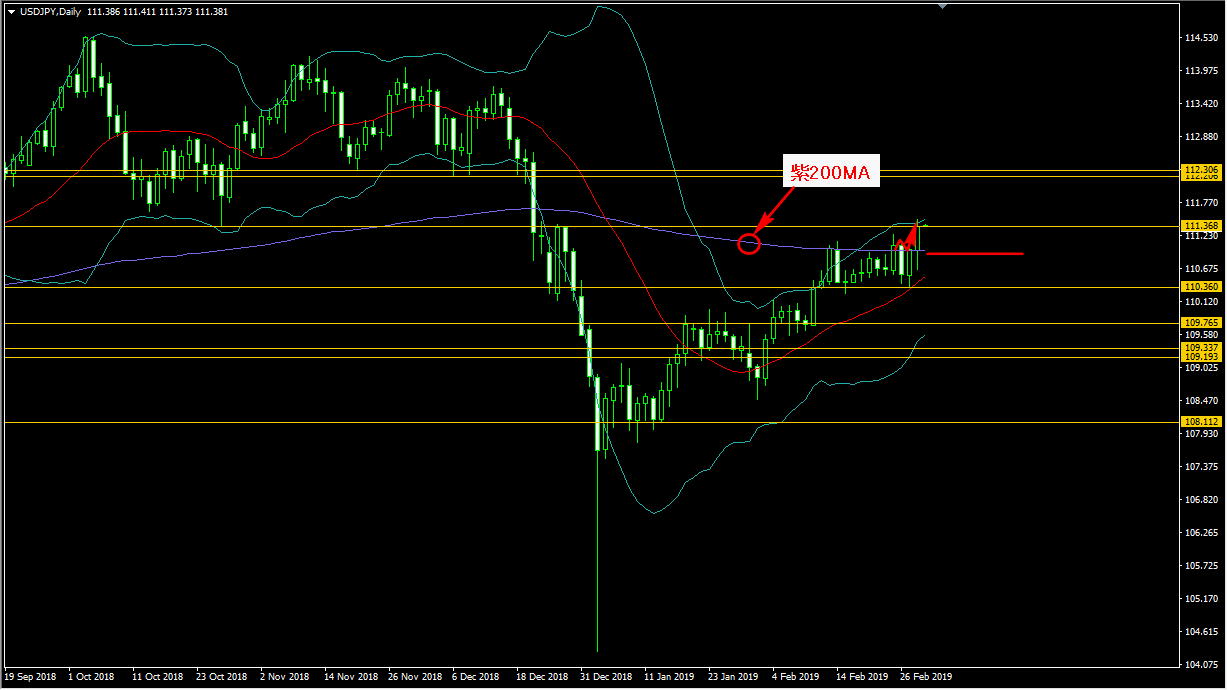 Let’s look at the USD/JPY daily chart. On the daily chart, the long-suppressed-by-heads institution investors see the 200-day moving average (200 MA) as a strong resistance wall that, after crossing from below, appears to have become a support-turned-resistance (soshibette) on a breakout. Furthermore, the even stronger resistance line around 111.368 JPY on the USD/JPY, which seems to be a higher wall, has also been broken from below, with the current price now above this line. It is noteworthy whether the price will rise above the 111.368 JPY line or be pulled back below.
What about the 4-hour and 1-hour forecasts and analyses? In the end, can you enter? Read more