2025/12/27 Dollar-Yen, Gold, SP500, and Nikkei 225 Environment

『Trendline Pro 2』✖『Dow The Zig – Break Edge 9』
‘Dow The Zig – Break Edge’ has increased Dow The Zig (Dow Theory Zigzag) from 5 to 9 this week.
Since there were voices that it was heavy when it was 5, we stopped calculating the 1–5 score tally,
and the specification now displays the edges (boundaries) of the 1–9 break as they are.
By default, only the most recent 1 of the 1–9 breaks is displayed.
It can be easily switched with button operations.
▲Light Blueis an upside break (darkerLight Blueis a reverse-triangle break
▼Pinkis a downside break (darkerPinkis a reverse-triangle break
■ Symmetrical triangle (on the chart, a small white circle appears)
In the bottom image, ‘Trendline Pro 2’ is also displayed on the chart.
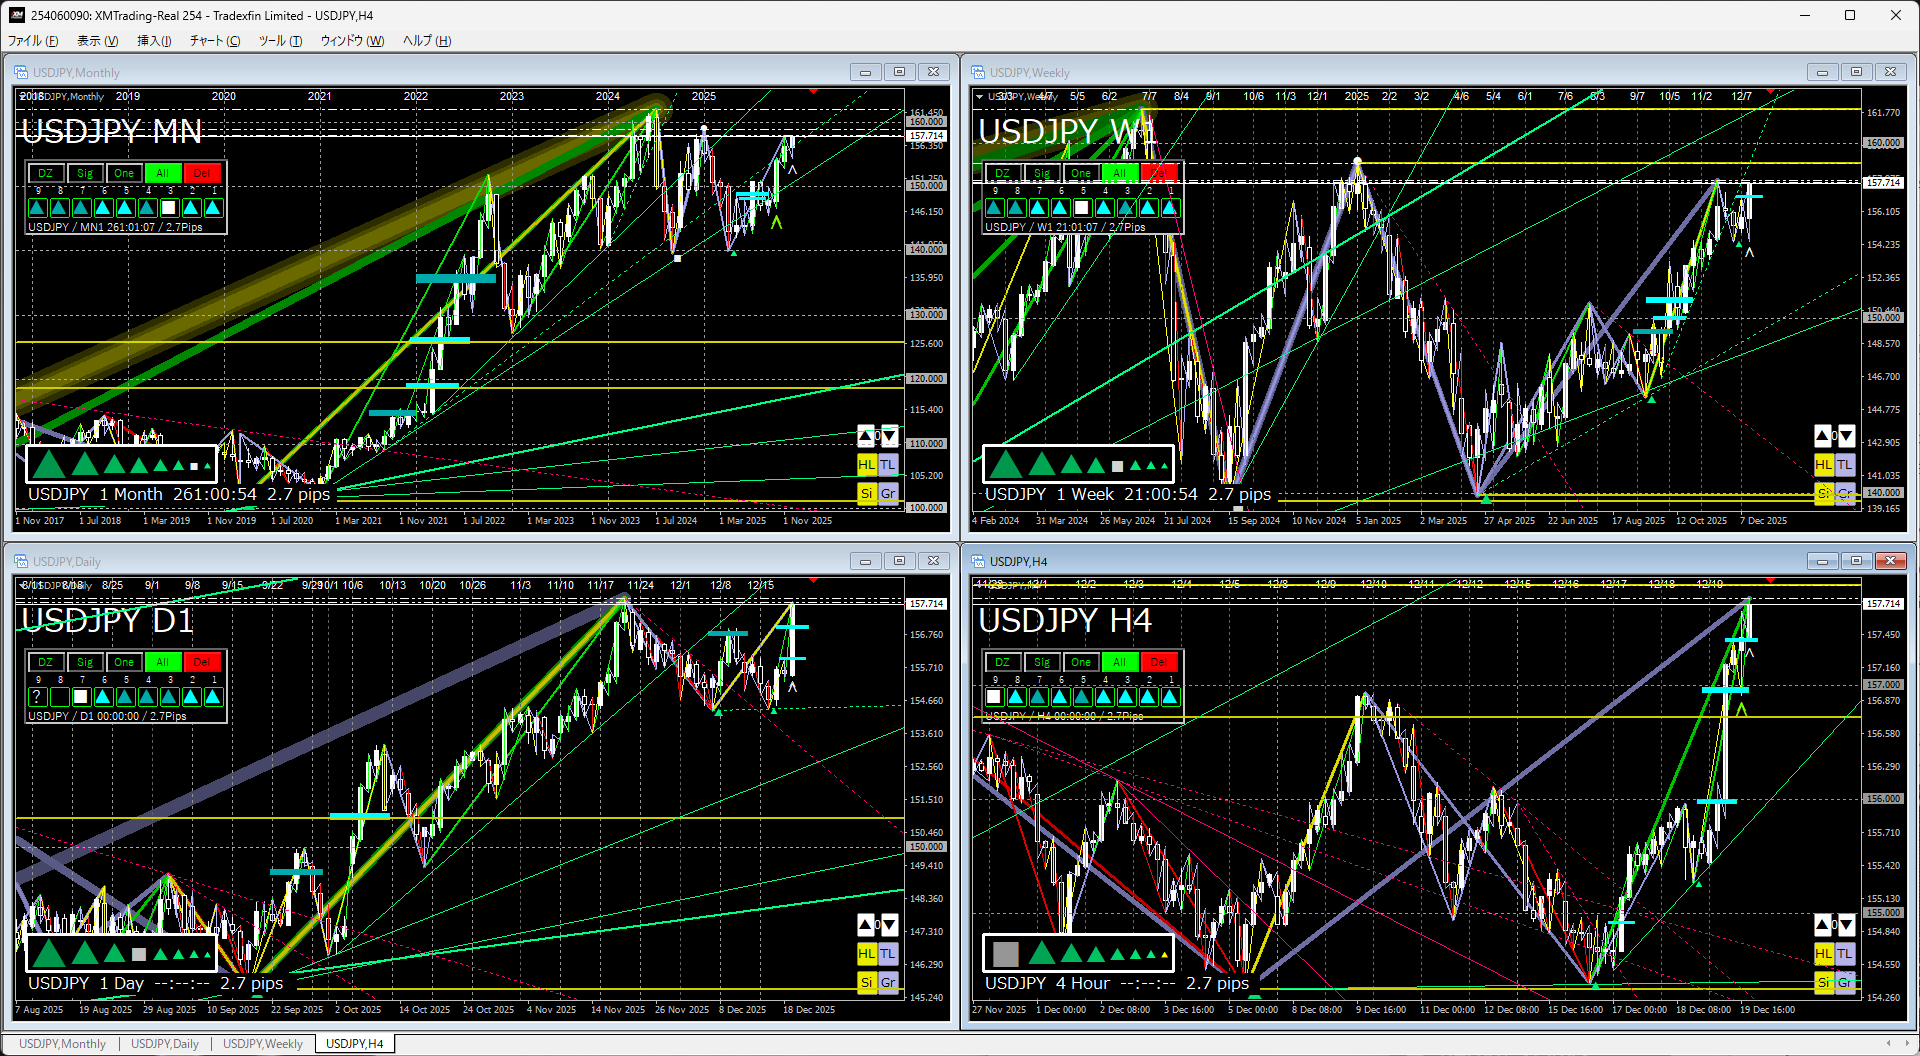
Dollar/Yen
↓Last week’s chart↓
↓This weekchart↓
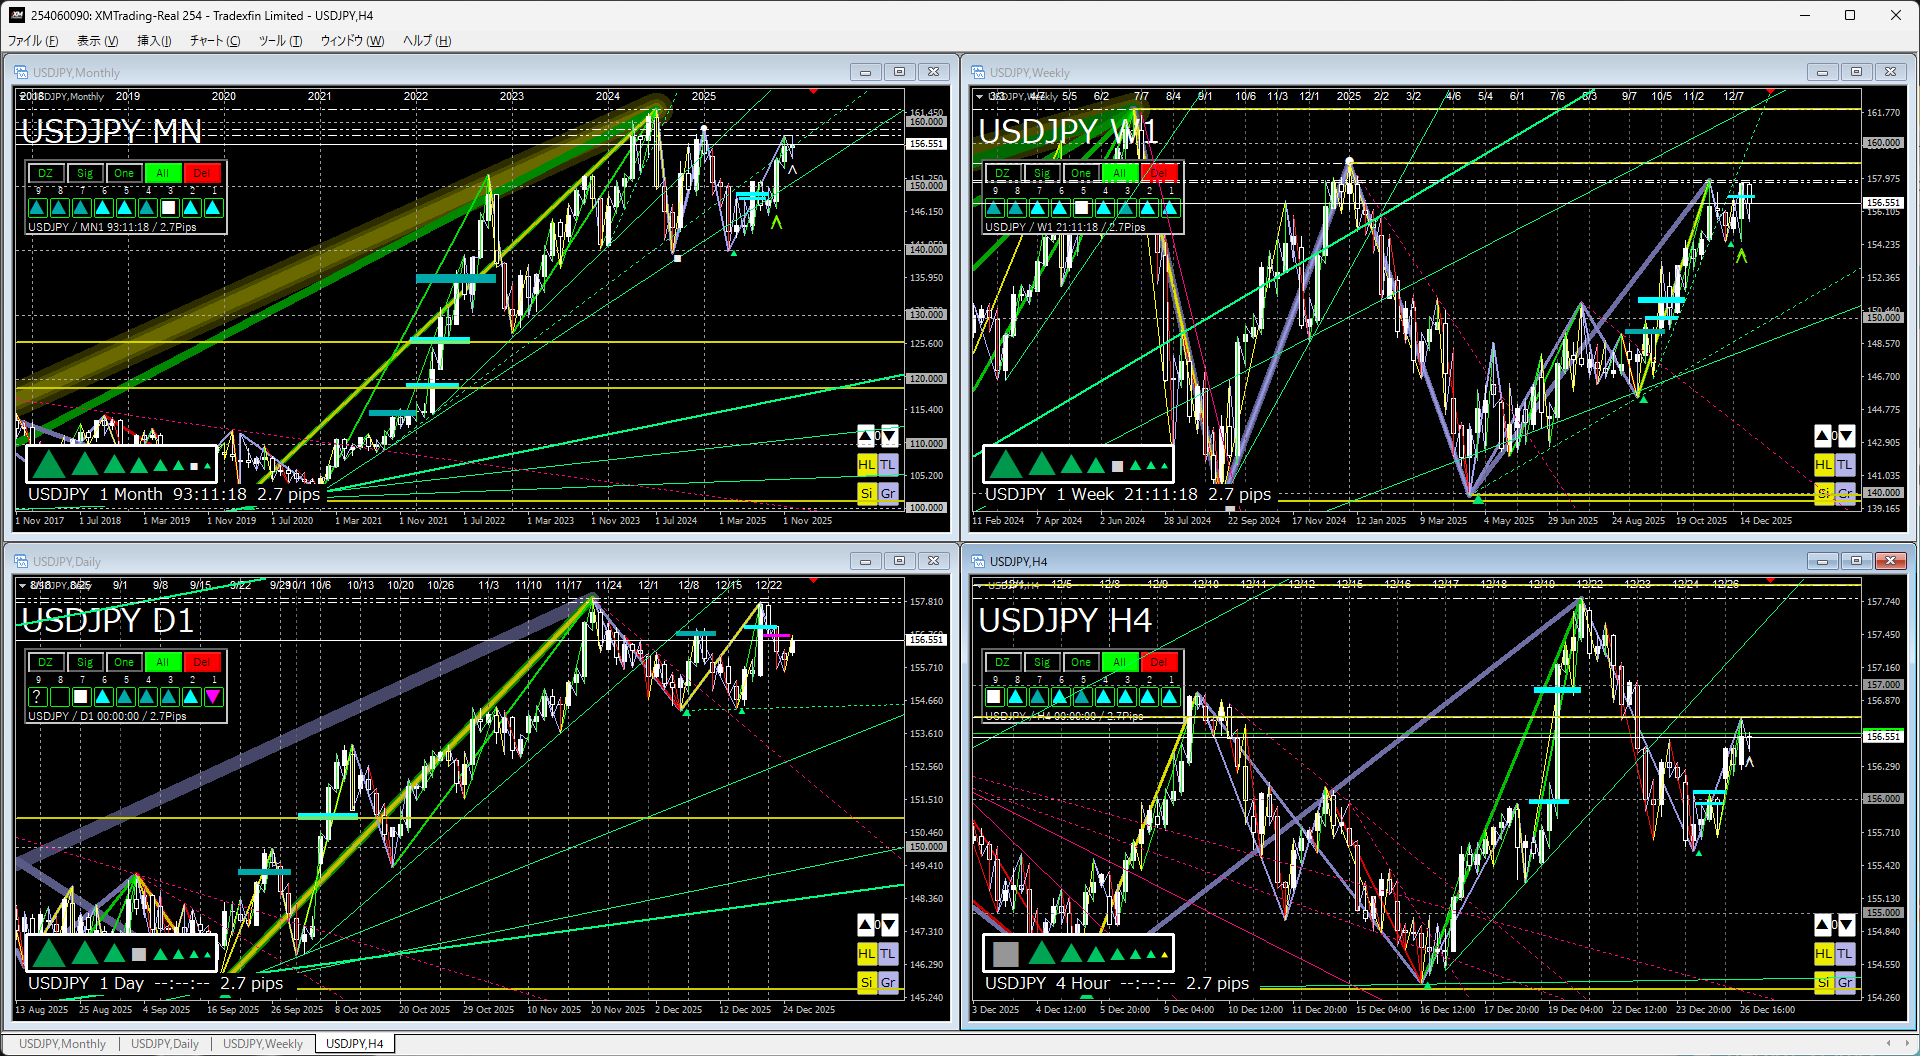
Monthly & WeeklyLooking at it, it is in a pattern testing higher levels, currently a large triangle consolidation.
If it breaks the recent high to the upside and the triangle is broken, the long-term dollar weakness would strengthen rapidly.
Daily & 4-hourLooking at it, it is a pattern of testing higher levels after pulling back at the resistance of the recent high.
Next week, a breakout above the recent high is expected to be attempted, but be careful of sudden moves against weak trading volume around year-end and New Year holidays.
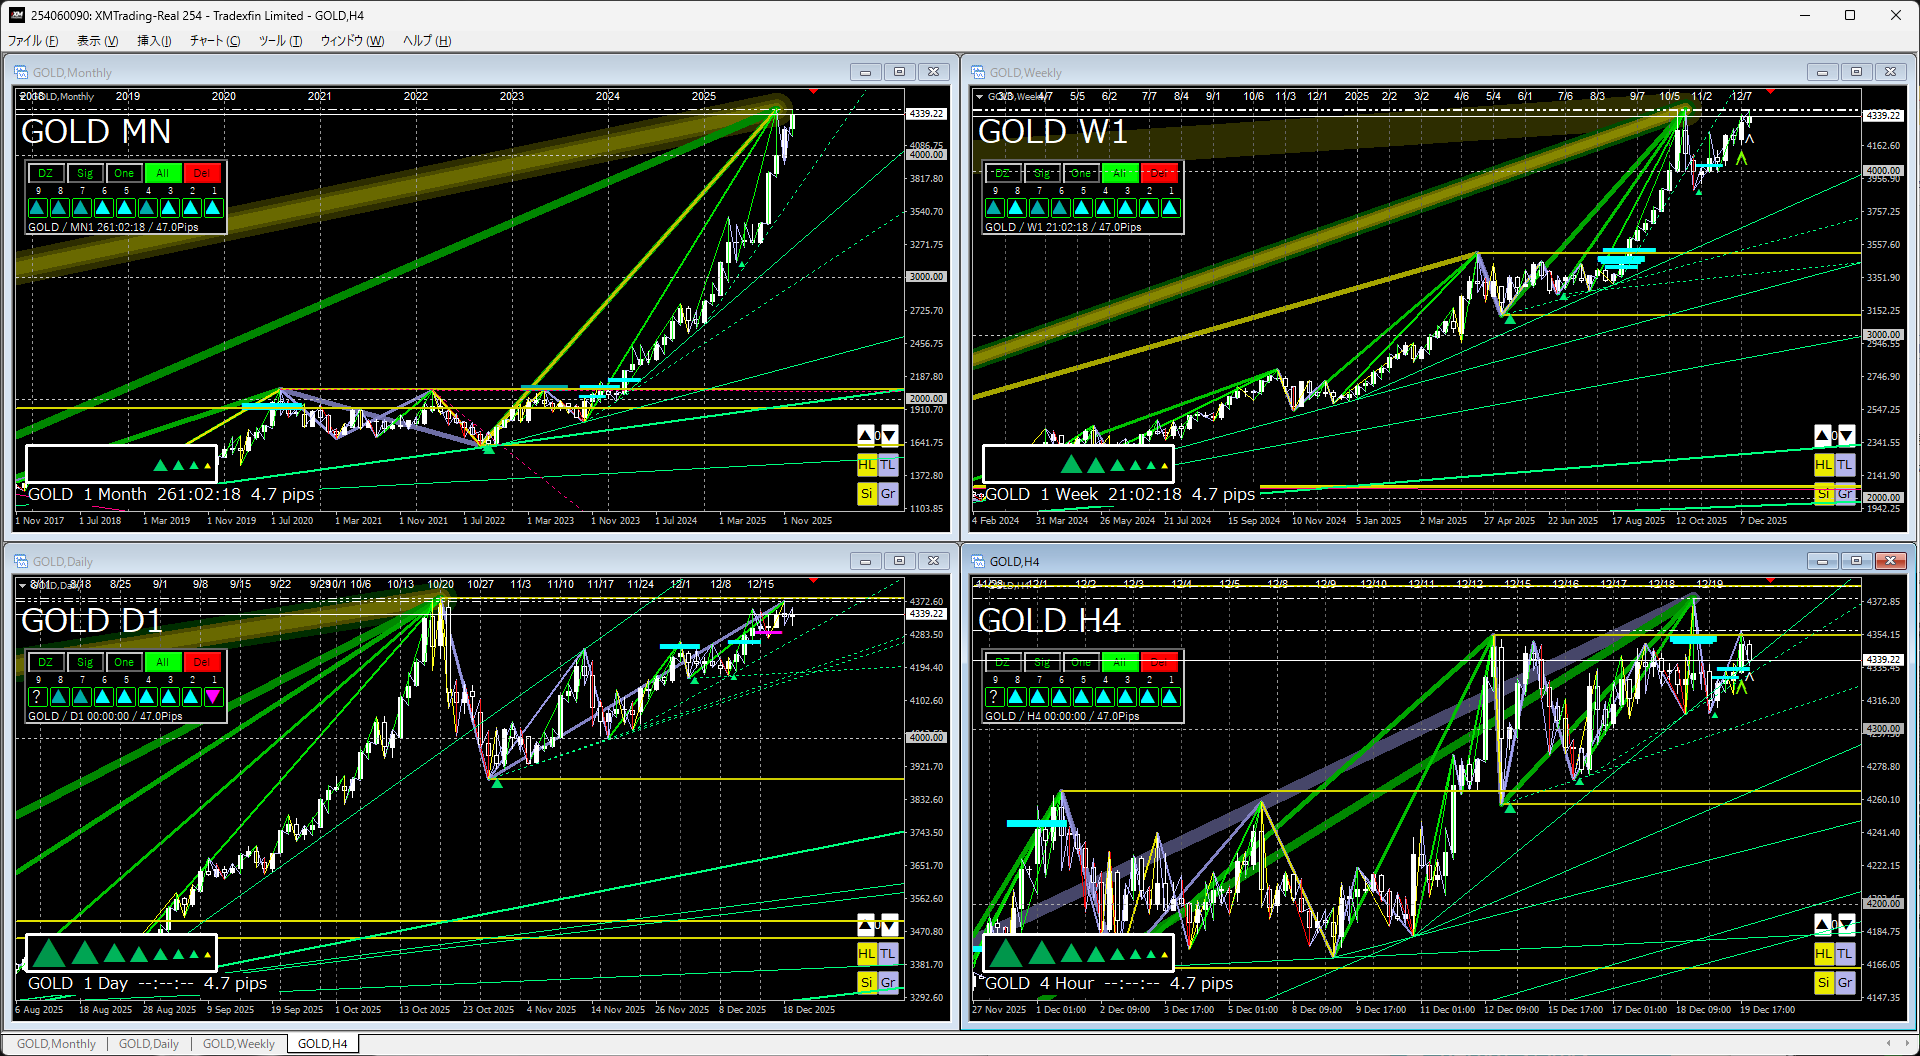
Gold
↓Last week’s chart↓
↓This weekchart↓
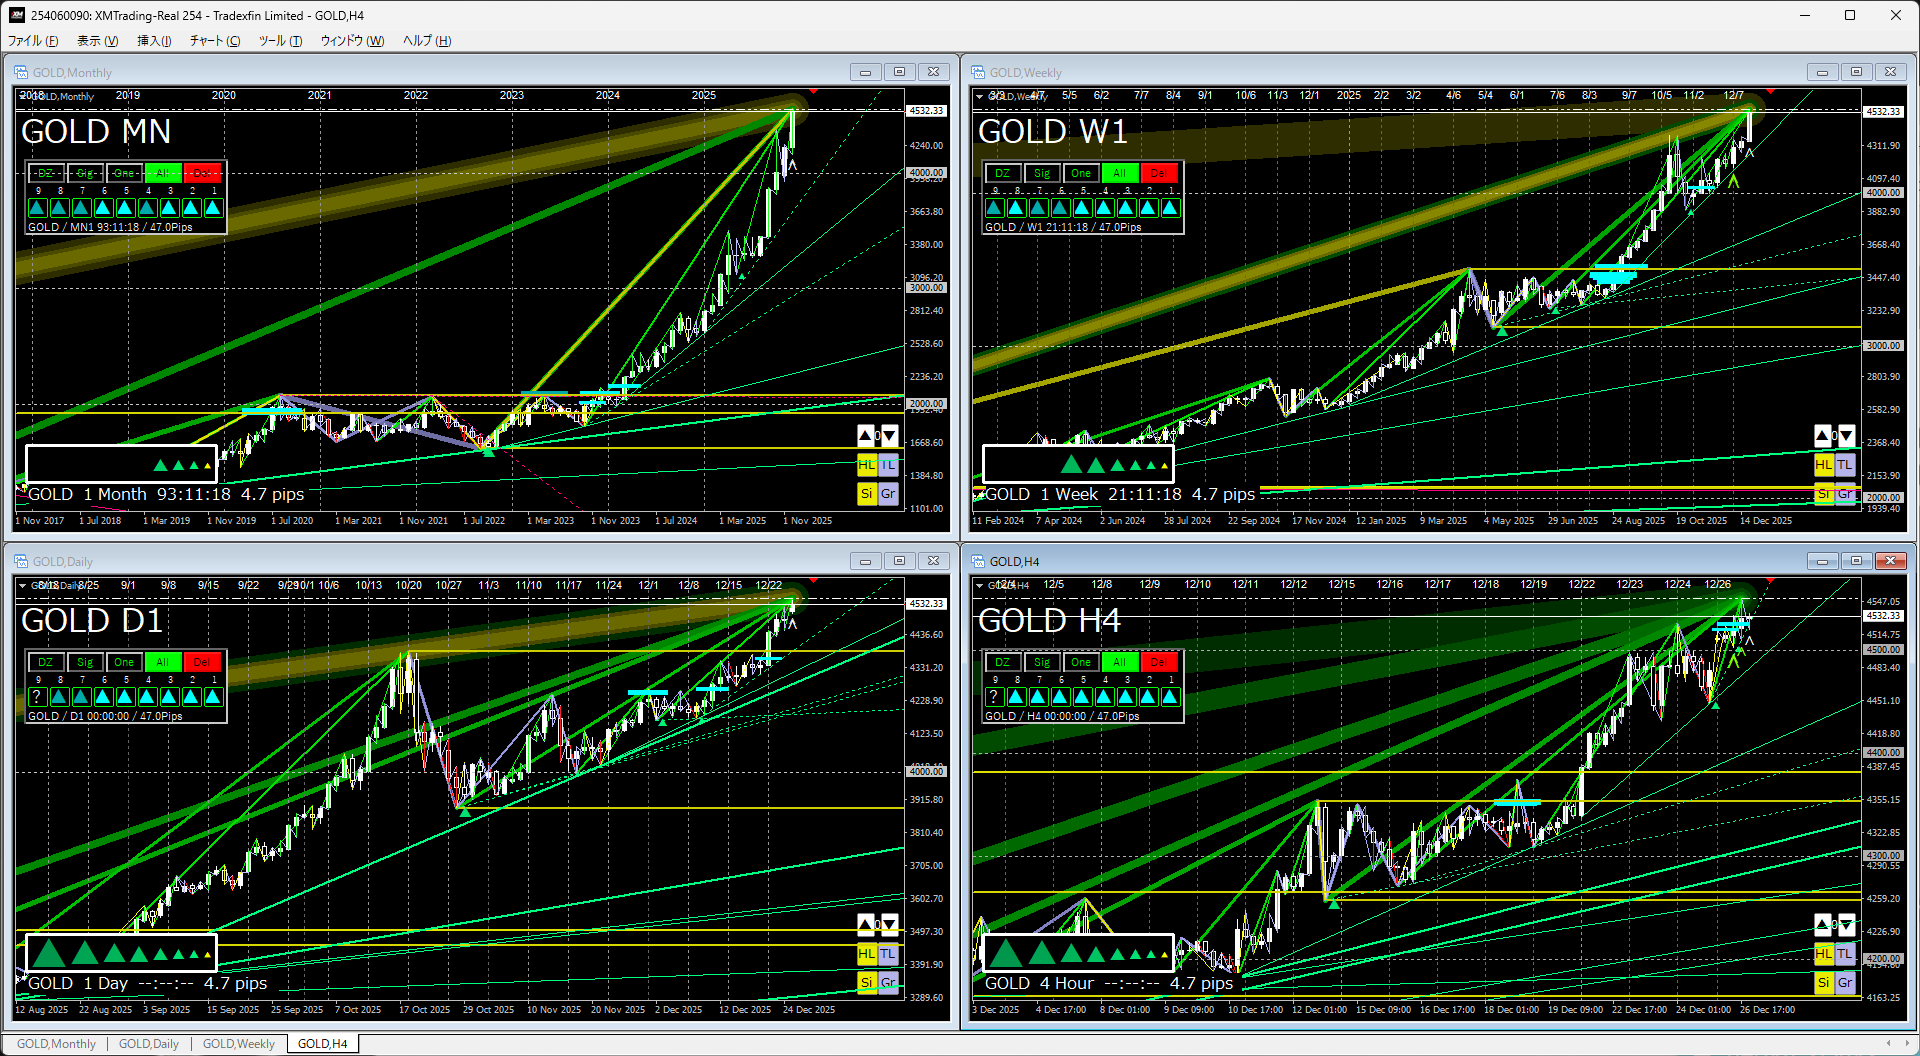
Gold remains in a posture of being a buy-only.
Because there are no sellers, a large drop and a buying stance (wait) may not be appropriate.
I had thought it would be range-bound for a while, but it’s breaking through strongly as is.
This is not that gold is rising, but that the value of currencies is generally falling.
Accumulated gold is better kept.
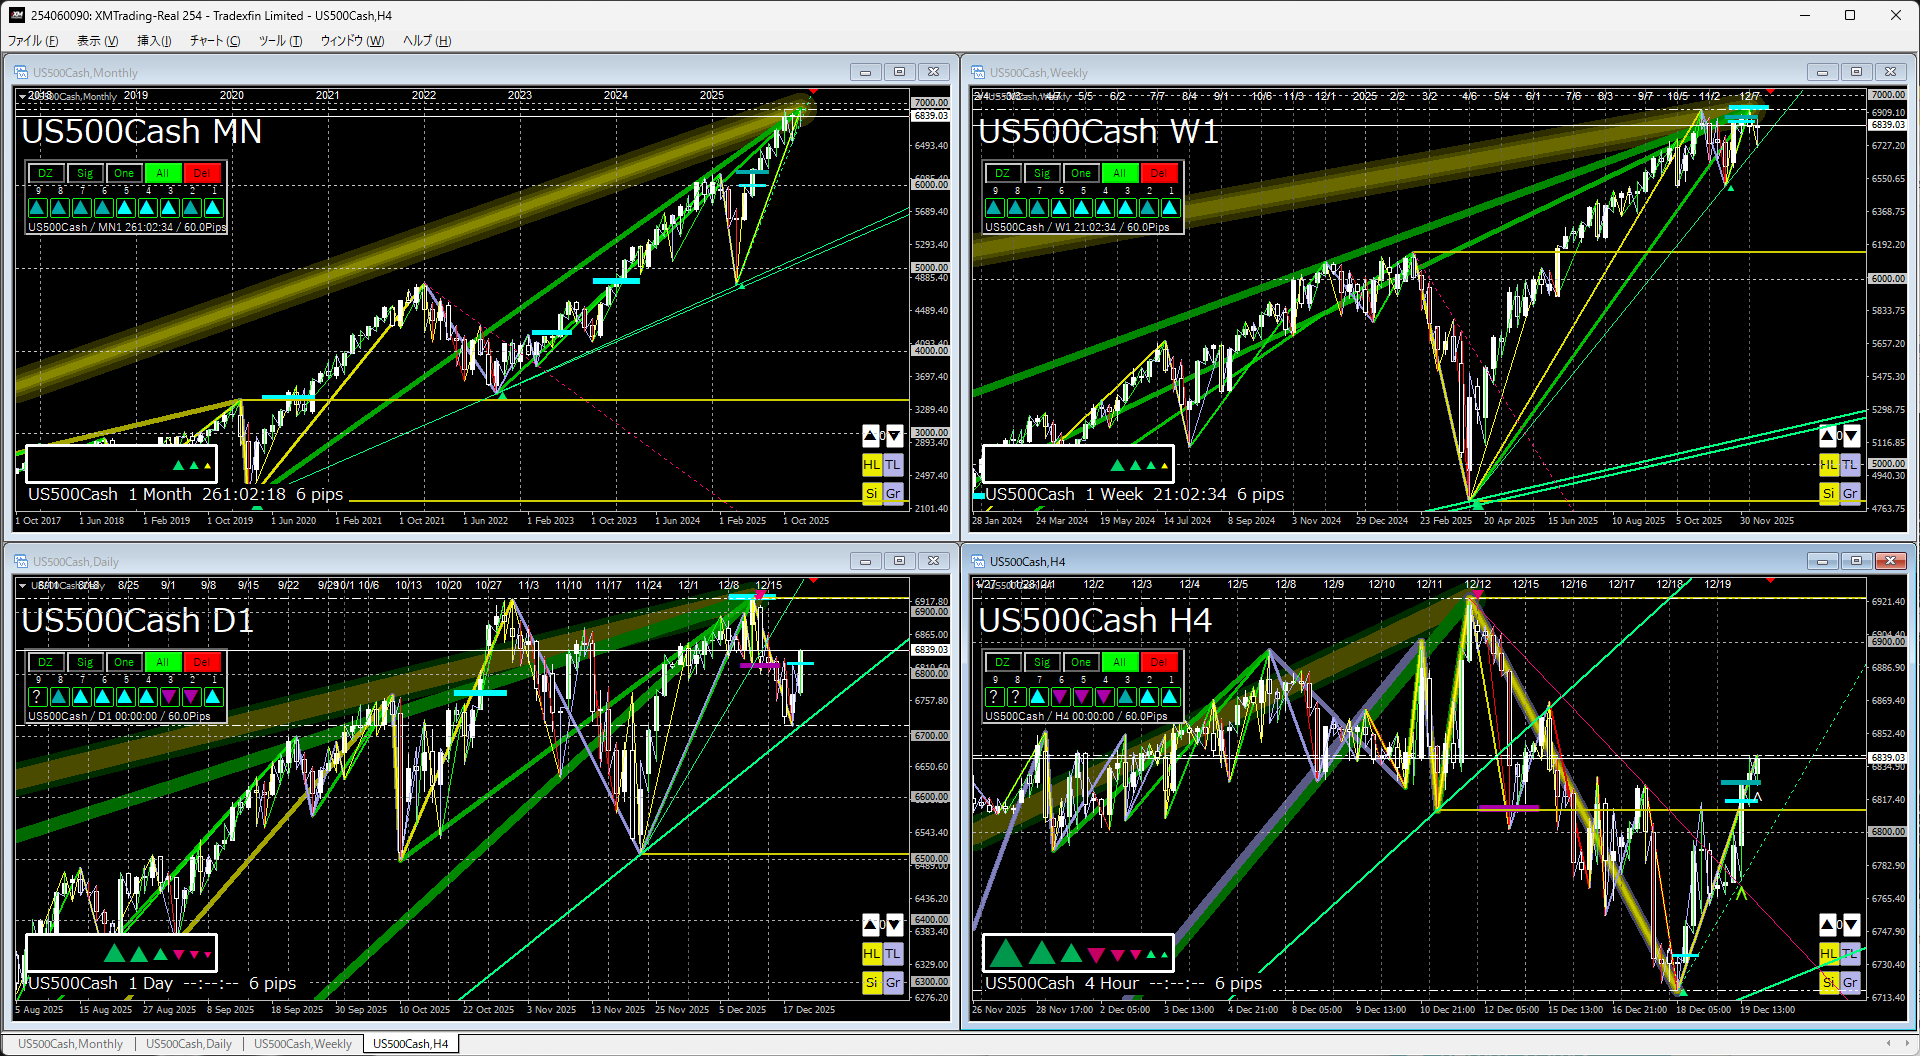
S&P 500
↓Last week’s chart↓
↓This weekchart↓
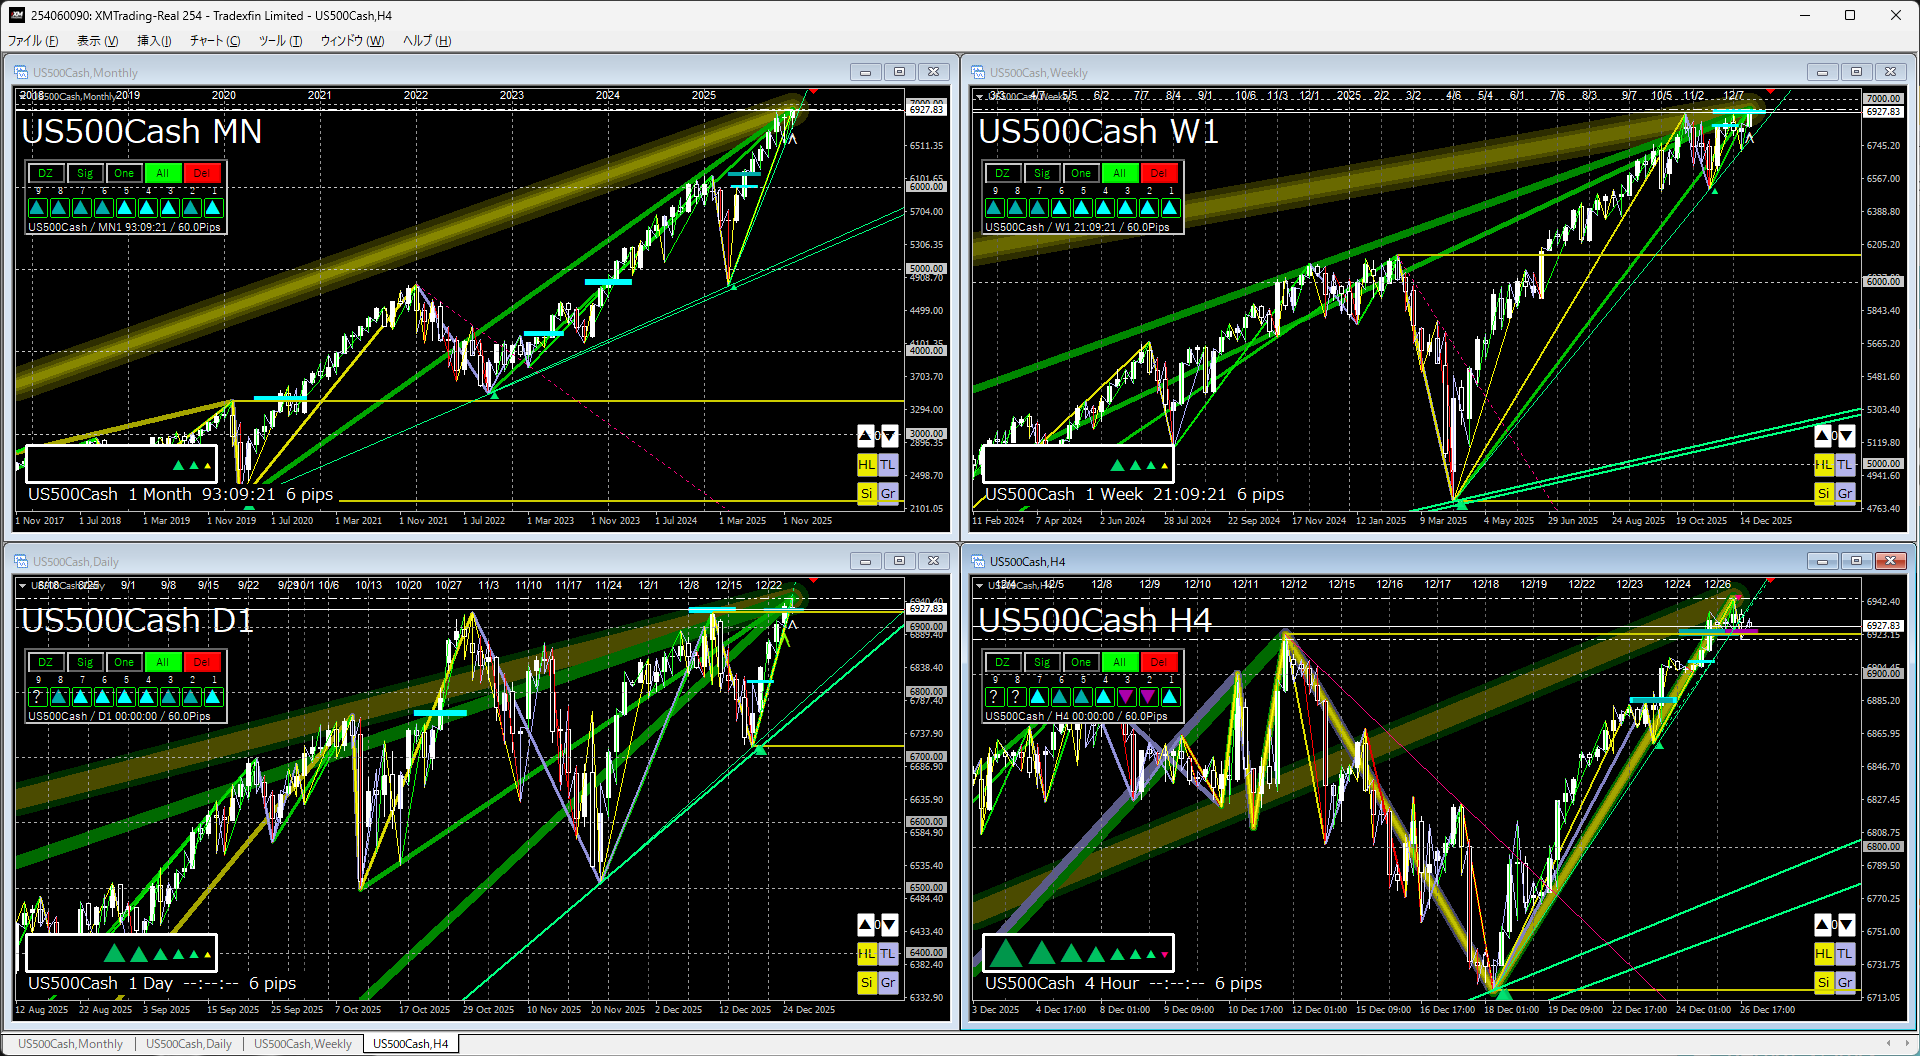
Monthly & WeeklyLooking at it, after a rebound from the trendline, it continues to rise.
Although there was a temporary downside break recently, the environment has shifted back to an upside breakout.
Daily & 4-hourLooking at it, it is supported by the trendline and has moved on to higher highs.
The U.S. remains strong in following through, so if nothing else happens, this uptrend is expected to continue.
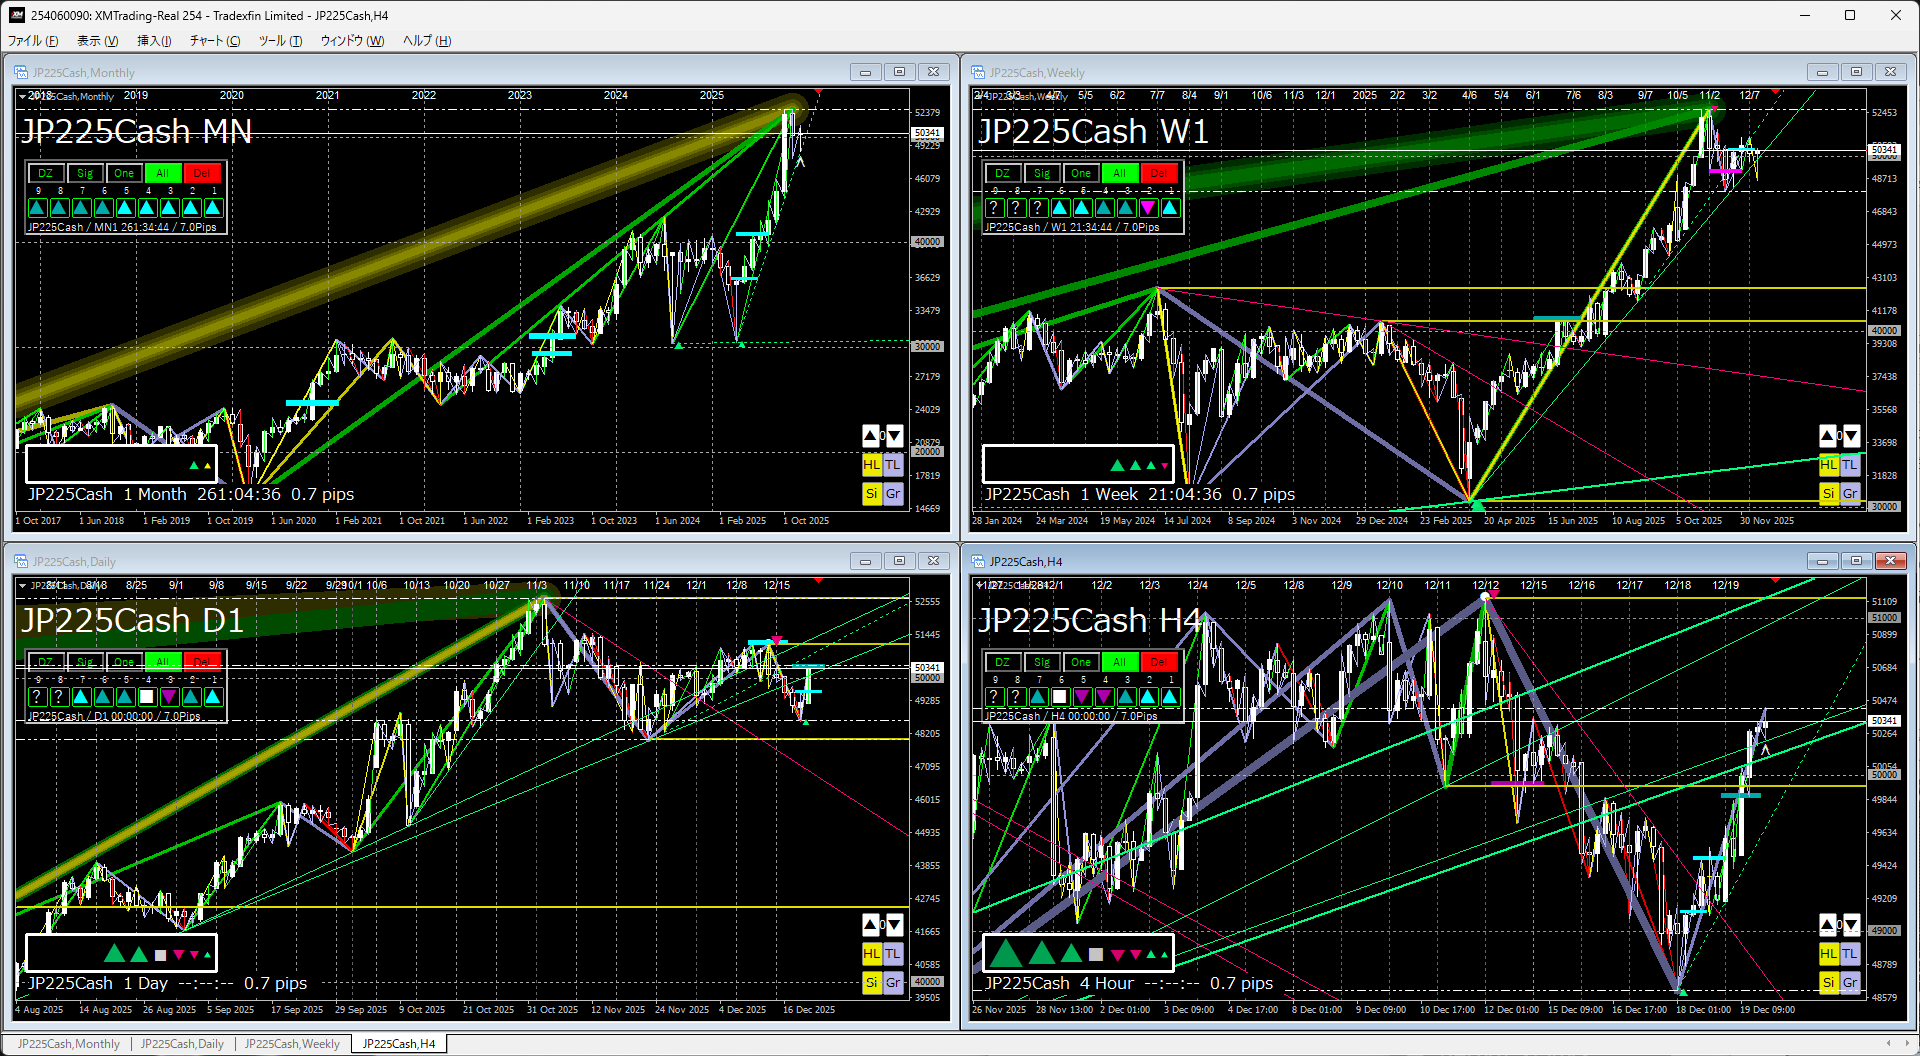
Nikkei 225
↓Last week’s chart↓
↓This weekchart↓
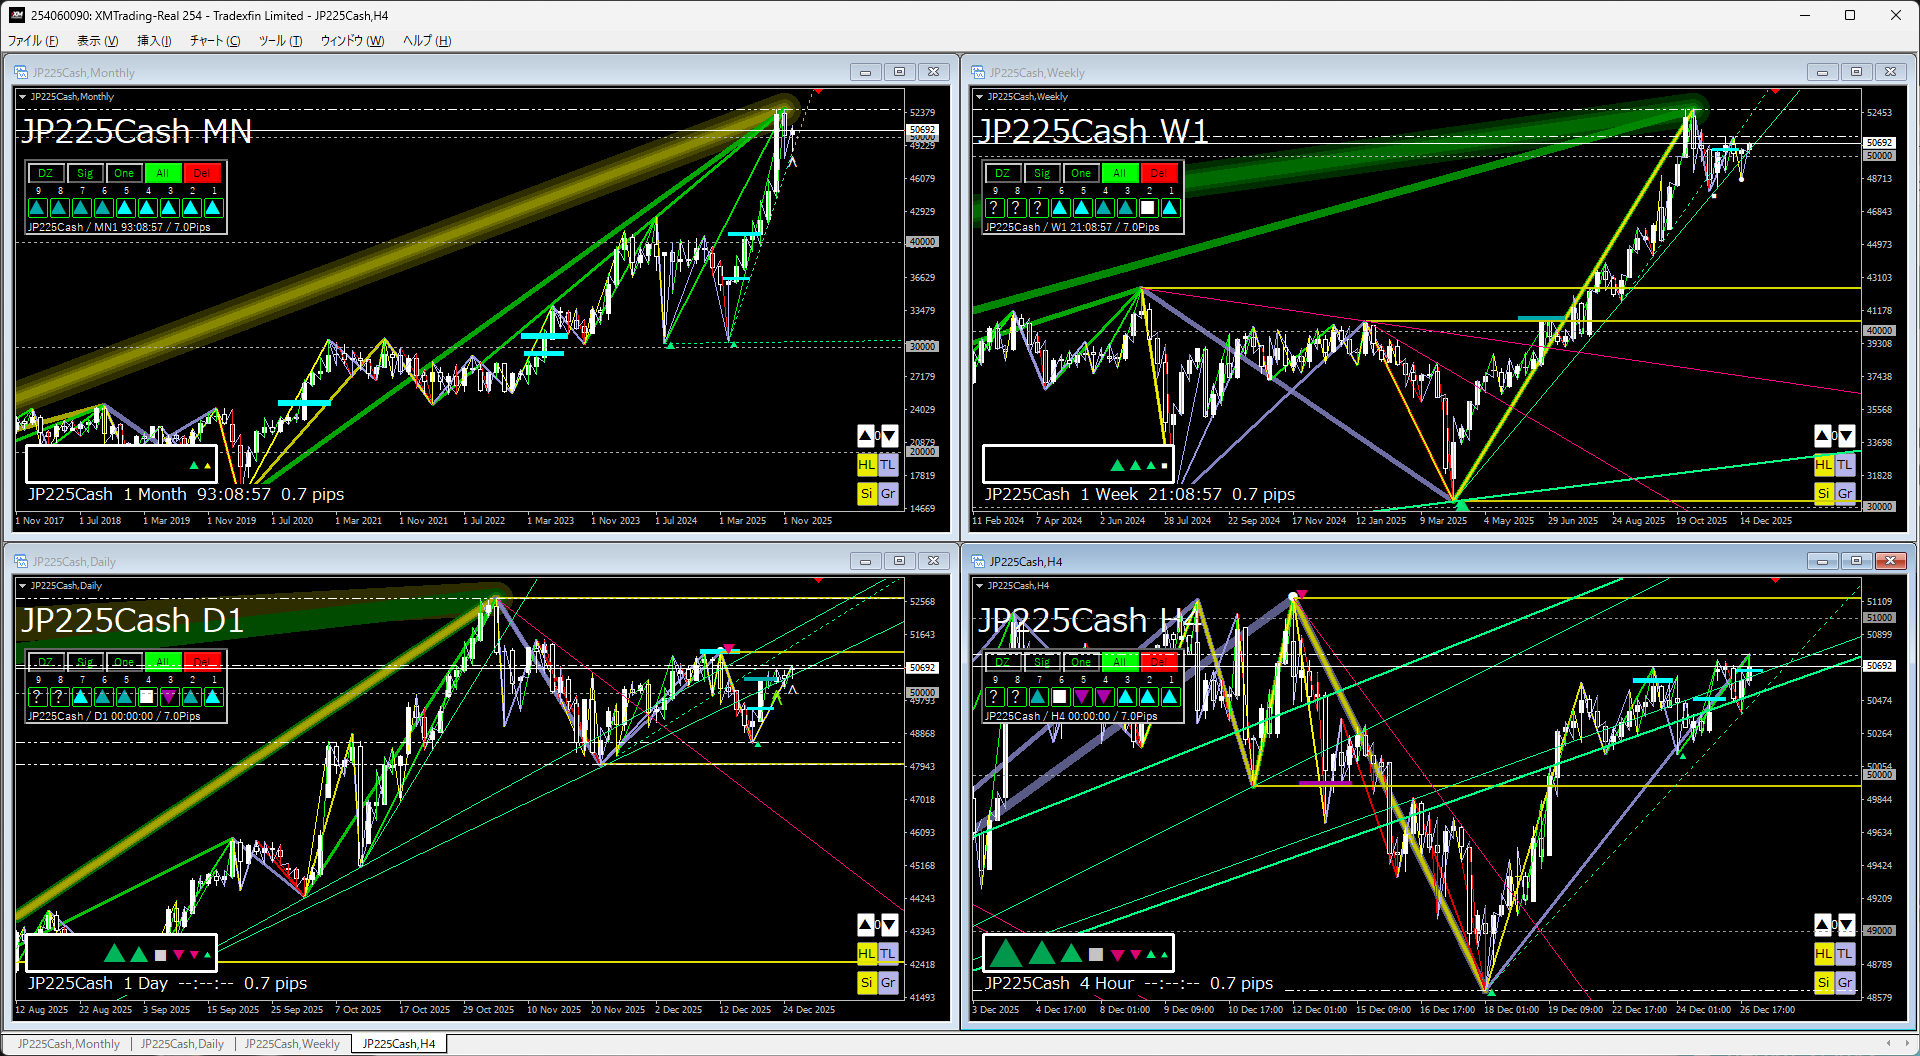
Monthly & WeeklyLooking at it, it is in a strong rise from a double bottom breakout.
Recently there was a downside break, and the trendline also seems to have broken downward.
Daily & 4-hourLooking at it, the trendline has been broken downward and a triangle consolidation has occurred.
In general, you should start by buying, but it may be wise to wait a bit to see which way the triangle consolidation will break.
The indicators in the attached image use the following two indicators.
If you’re interested, please take a look.
『Trendline Pro 2』✖『Dow The Zig – Break Edge 9』
The rest says nothing.
If you’d like to continue reading this article, please press the button.