

Look at the price movement where moving average crossovers occur (support becomes resistance / resistance becomes support) using large, medium, and small moving averages!?
Using the current USD/JPY (30-minute) chart after Christmas, we will sequentially examine the support-resistance breakdowns and resistance-support reversals for the moving averages in the large, medium, and small ranges (20/50/100/200/400 SMA).
Blue ① 20SMA for support-resistance conversion / resistance-support conversion
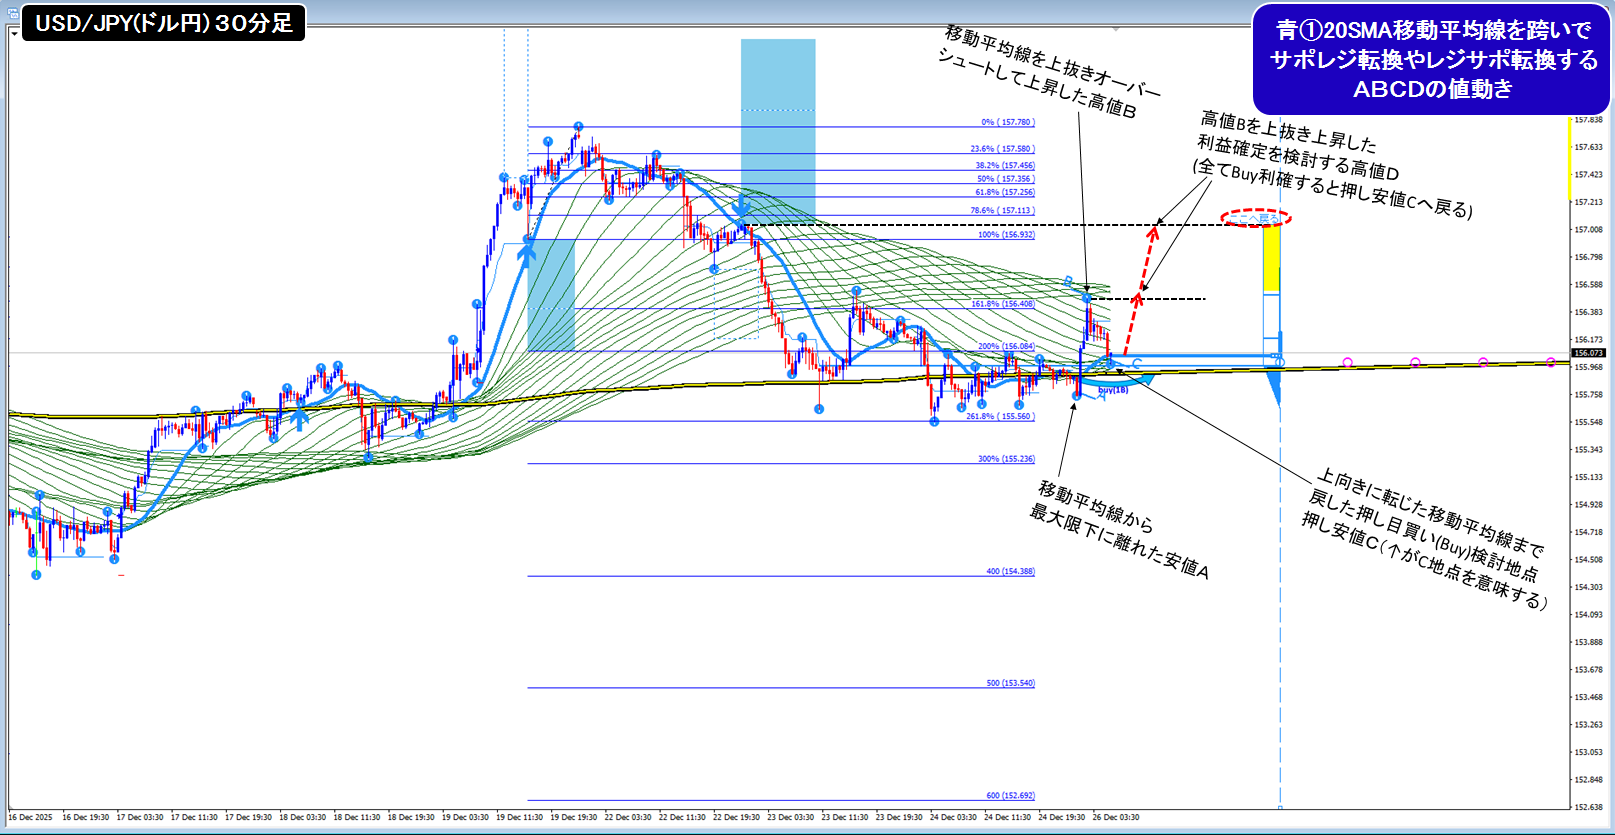
● It is confirmed that after overshooting from the low A up to the high B using the blue 20SMA moving average and then turning upward, one would consider the opportunity to buy on a pullback down to the low C, which has returned to the blue 20SMA where the price reversed upward.
● The point labeled “return here” is the point C where a pullback/sell occurred; once the price climbs to this level, the selling positions would all have taken profits and margin would be fully restored, returning to flat. Therefore, a blue ① 20SMA trader would likely want the price to rise up to here.
(Of course, other traders’ intentions exist, and there are times when one cannot move in that direction; in such cases, the price may retreat to this point after some time.)
Red ② 50SMA for support-resistance conversion / resistance-support conversion
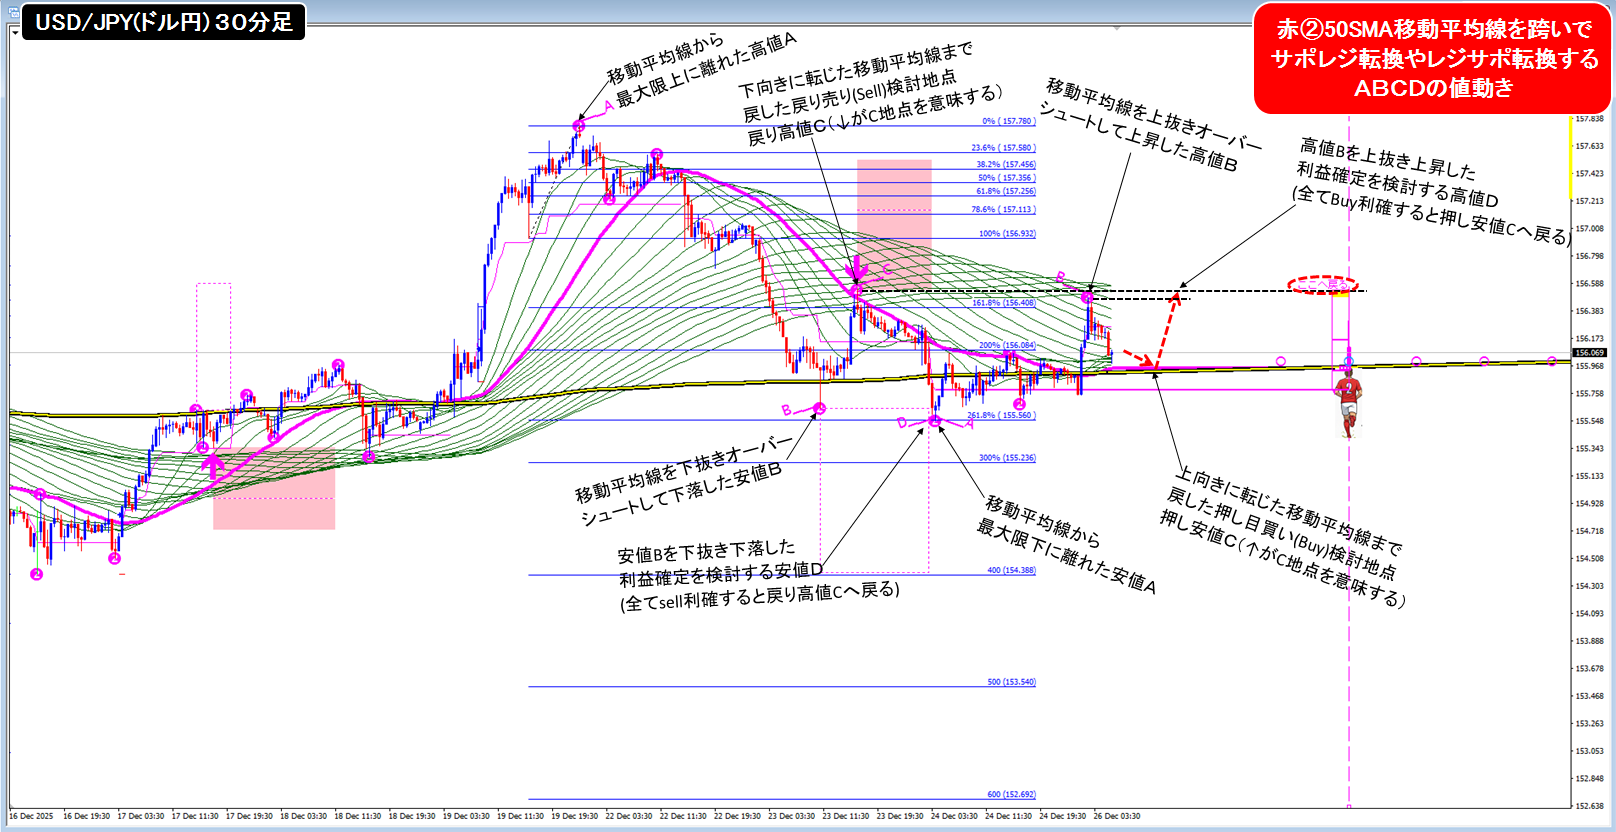
● From high A to low B, then turning downward at the retracement high C (where sell enters) to low D (profit-taking consideration point), after which the price overshoots above the moving average from the low A (≈ low D) and rises back to the red 50SMA, turning upward from the high B—this is the stage we are at.
● After this, when support is found near the red 50SMA, one would want to buy on the pullback and aim to return to here (≈ retracement high C) after breaking above high B.
Green ③ 100SMA for support-resistance conversion / resistance-support conversion
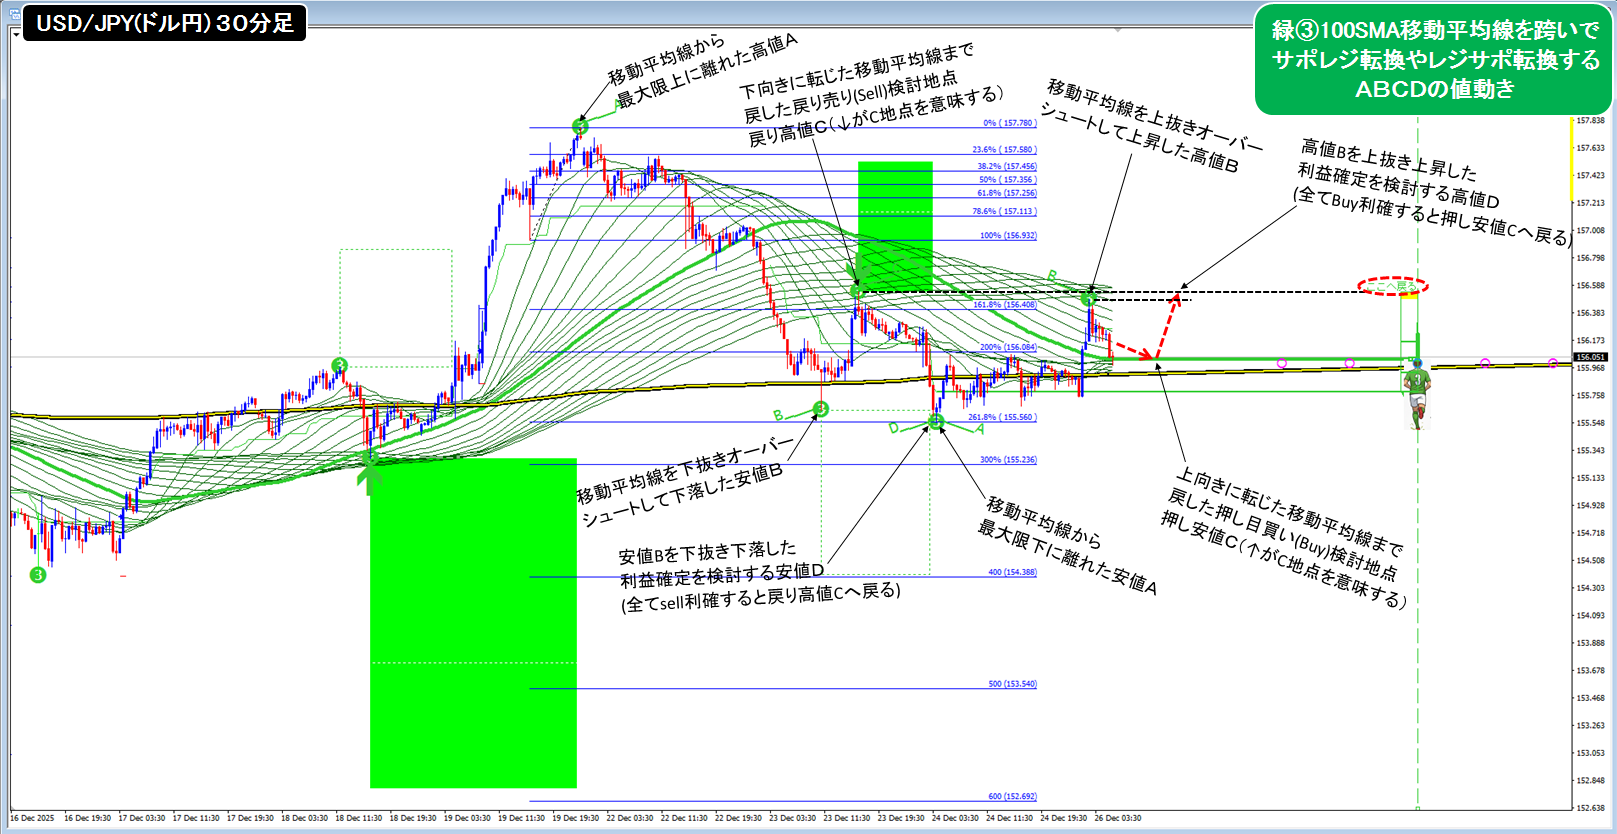
● From high A to low B, then turning downward at the retracement high C (where sell enters) to low D (profit-taking point), after which price overshoots above the moving average from low A (≈ low D) and rises to the green 100SMA, turning upward from the high B; this is the stage we are at.
(In price terms it has retraced, but in terms of wave size it has not yet reached the scale of the green ③ wave, so it may take more time to reach green ③ point C.)
● After this, if support is found near the green ③ 100SMA, one would want to buy on the pullback and aim to return here (≈ retracement high C) after breaking above high B.
Black ④ 200SMA for support-resistance conversion / resistance-support conversion
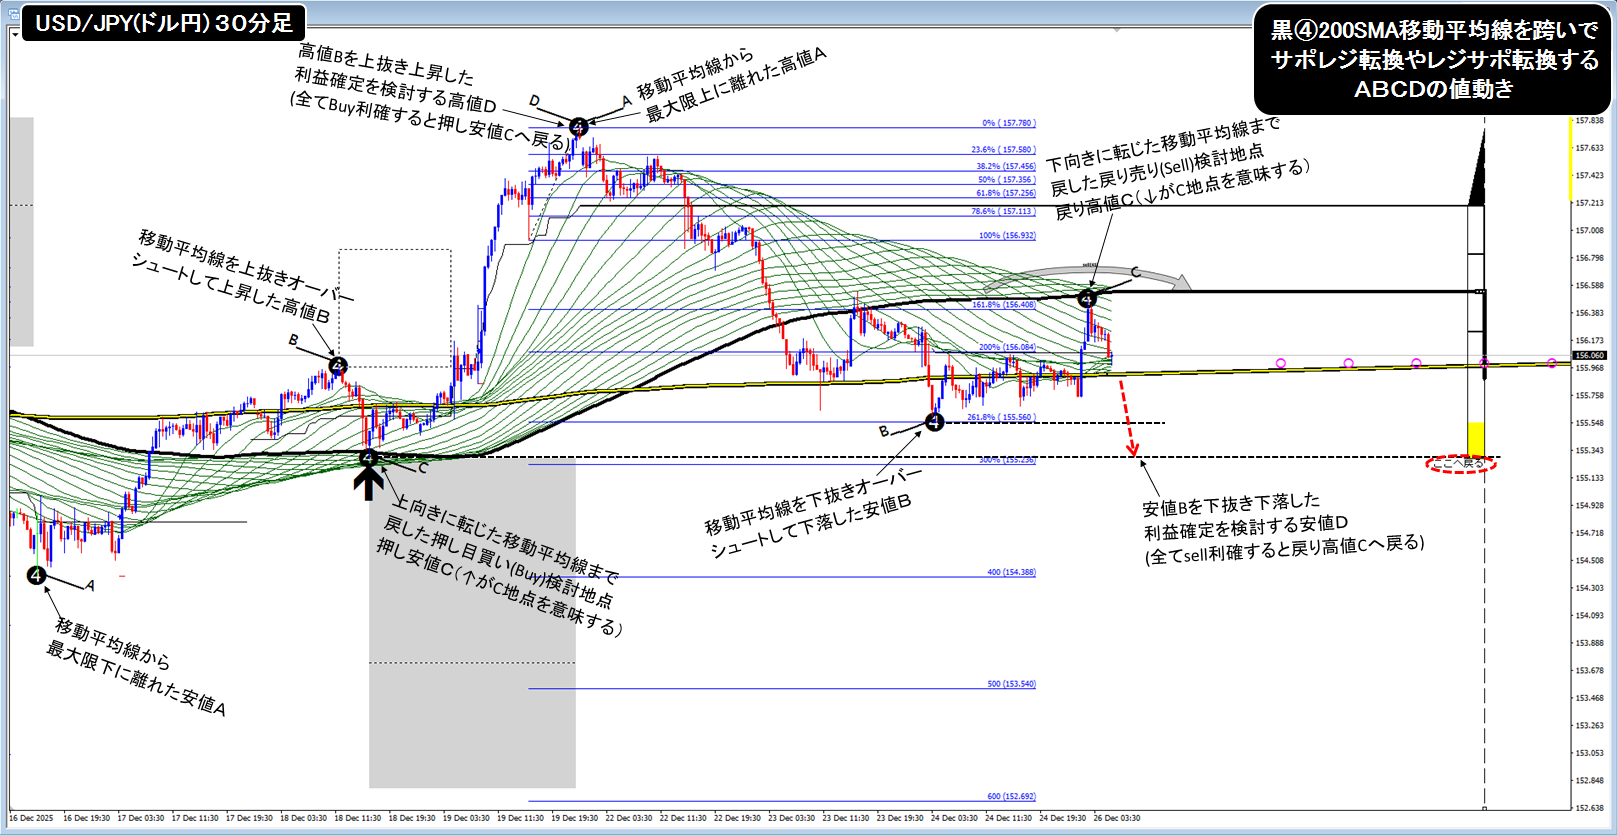
● From the low A that separated as far as possible downward from the moving average, once it overshoots above the black 200SMA to the high B and then returns to the low C after turning upward, buy on the pullback to D, rise to the high, take profits, and then overshoot below the black 200SMA, with the price likely to reverse upward back toward the black 200SMA; this is the situation where one would consider selling on the pullback.
● The point labeled “return here” is the point C where a pullback buy was made; if the price falls to this level, all pullback-buy positions would have their profits realized and margins fully restored, so a black ④ 200SMA trader would likely want further downside up to here.
(Of course, other traders’ intentions exist, and there are times when one cannot move in that direction; in such cases, the price may retreat to this point after some time.)
Yellow ⑤ 400SMA for support-resistance conversion / resistance-support conversion
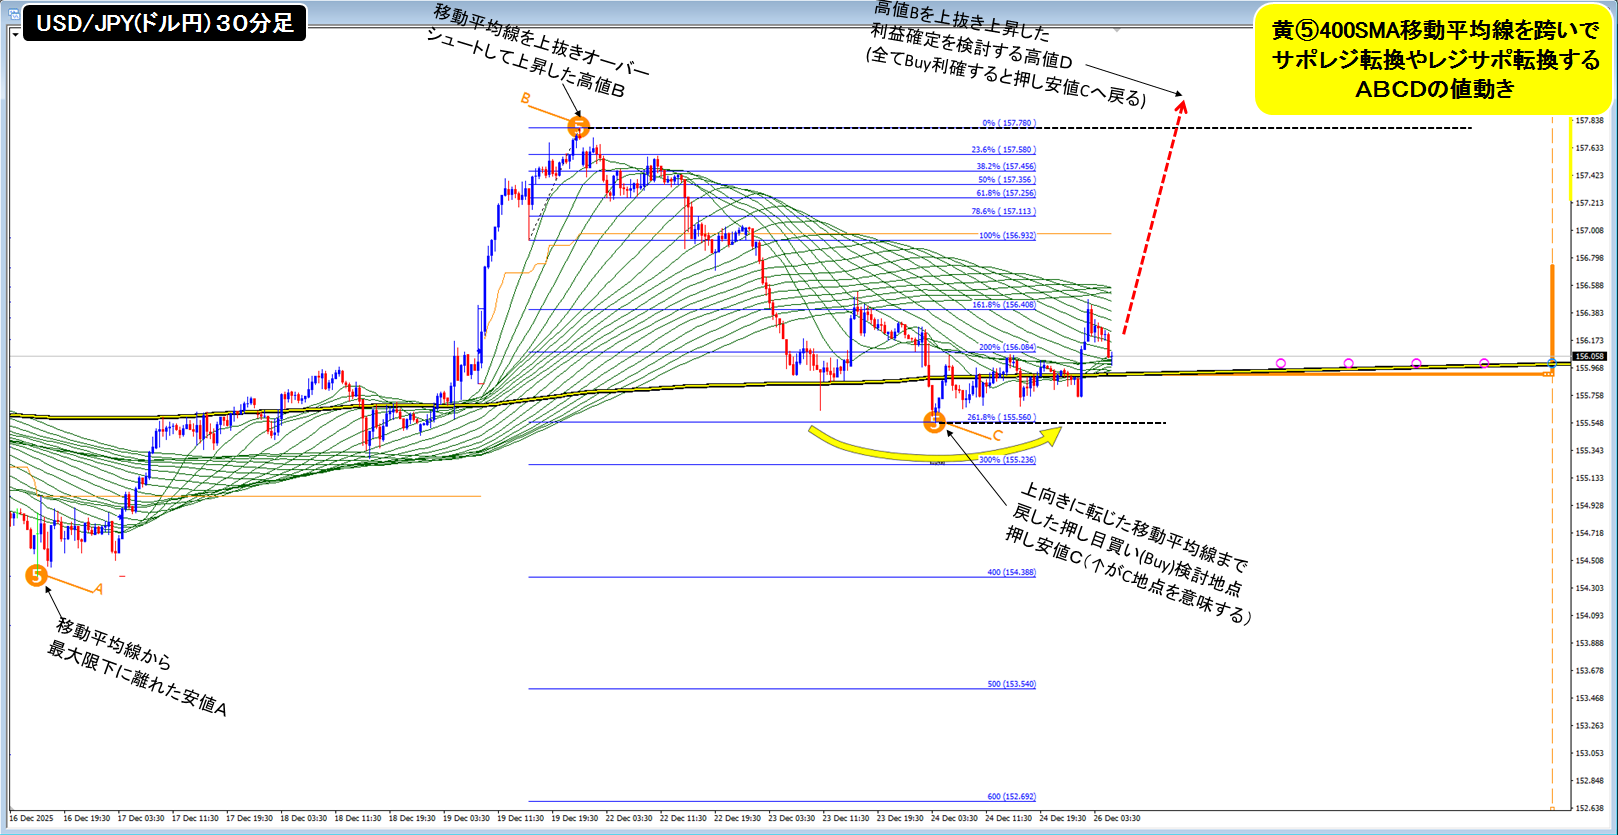
● From the low A that moved the furthest away downward from the yellow 400SMA, overshoot above to the high B and then retrace to the yellow 400SMA, returning to the low C after turning upward; this is the pullback buying situation to be considered.
● The point where the high B is exceeded by 1 point is point D.
(Of course, other traders’ intentions exist, and there are times when one cannot move in that direction.)
All of the above (20/50/100/200/400SMA) for support-resistance conversion / resistance-support conversion has been shown above
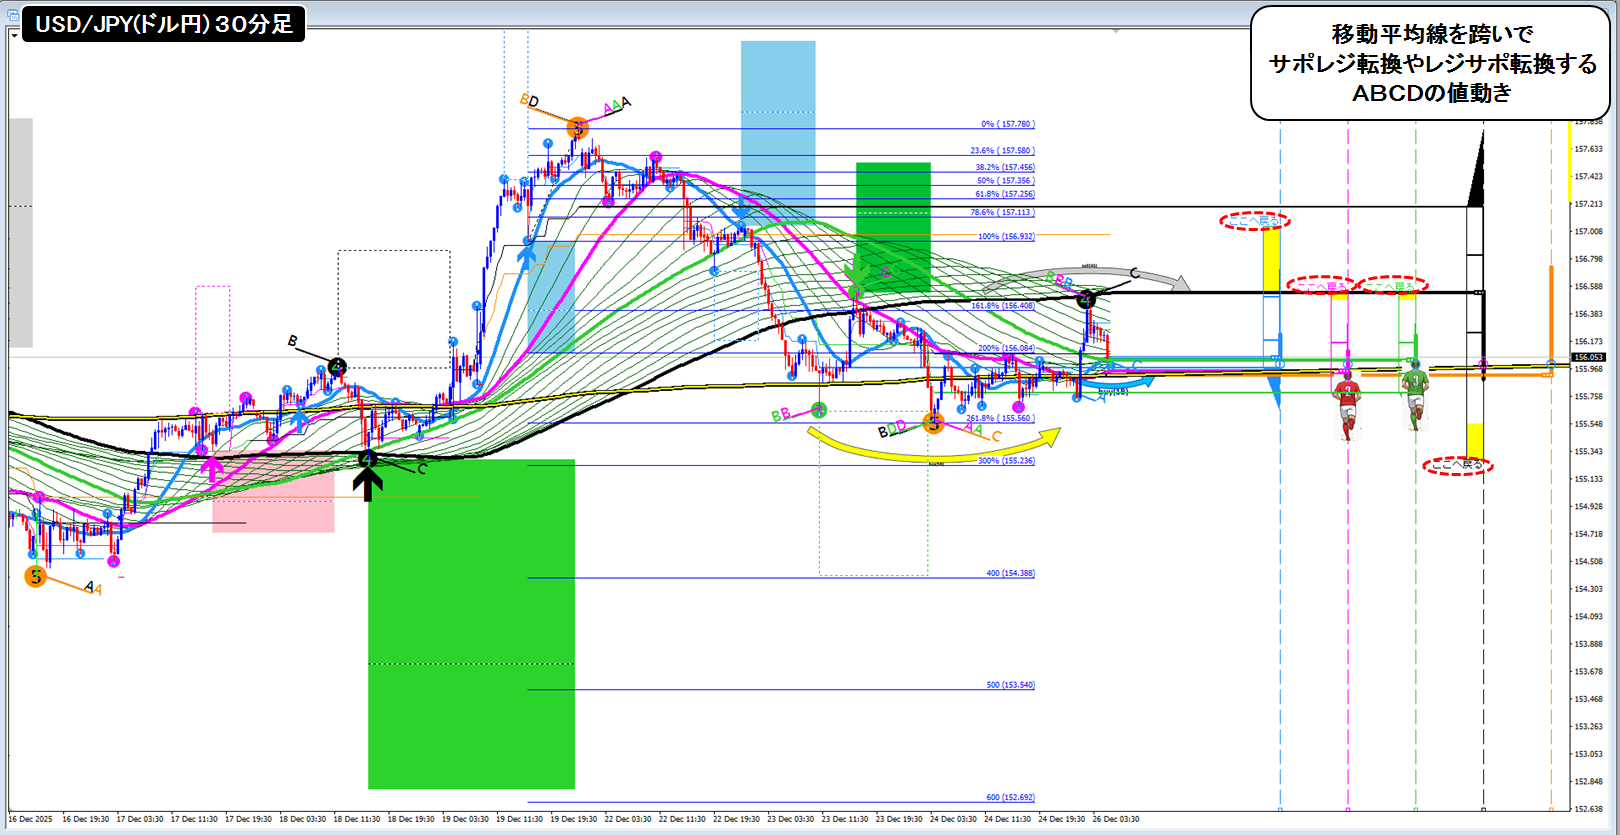
● When displaying all support-resistance conversions and resistance-support conversions across large, medium, and small moving averages at once, it looks like the above. The approach is to follow price movement from short-term to long-term: first, observe how the blue ① 20SMA support-resistance conversion moves; then how the red ② 50SMA and green ③ 100SMA conversions behave; then how the black ④ 200SMA conversion behaves; finally, how the yellow ④00SMA conversion behaves. This sequence seems best to me.
● If we treat the large, medium, and small moving average support-resistance conversions as different people's lives, and consider the values where A, B, C, D complete as each person’s success, then if such price movements made all people successful, all traders would be happy, and I watch charts every day hoping for that to happen (^^
(If each trader did not seek to defeat the other, but rather respected one another and a culture of mutual respect spread worldwide, perhaps all traders could trade with a profit or at least break-even every time? That is my thought…)