

XAUUSD Statistics Thorough Guide [Intervention Ripple PRO] Statistical Dashboard-Based “Strategic Utilization Method”
In this article,Intervention Aftermath PROdebuting for the first timeXAUUSD (Gold) Statistics (Stats Board)will be organized at once from M1 to D1intoand focused on“How to use it to speed up judgment”to explain. In short, statistics are not an “answer” but a weapon that supplements Nowcast judgments.
First, the premise: What do the numbers on the Stats Board mean?
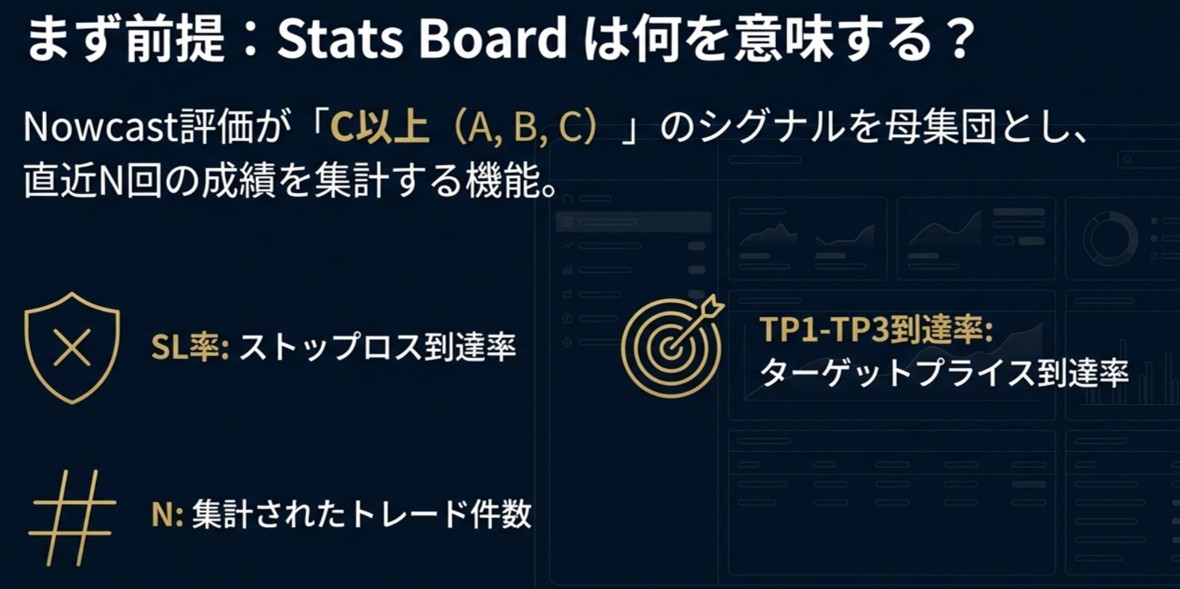
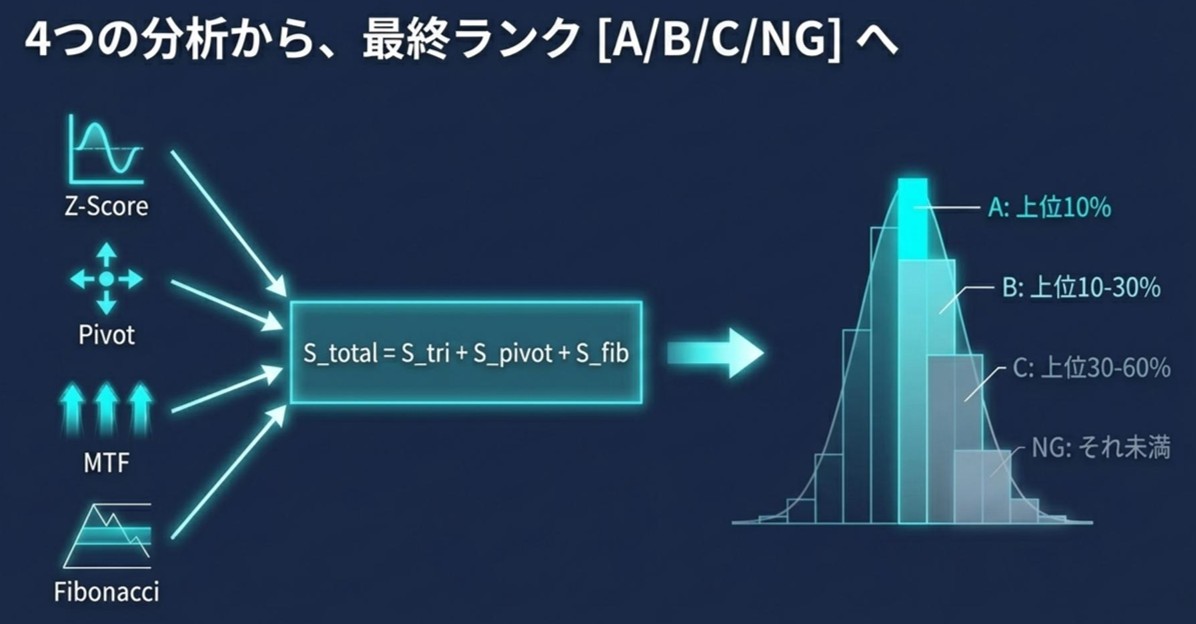
The Stats Board (statistical dashboard) collects the most recent N results from situations where Nowcast evaluation is “C or higher (A/B/C)” as the population. Here we mainly look at three things.
N: Number of aggregated trades
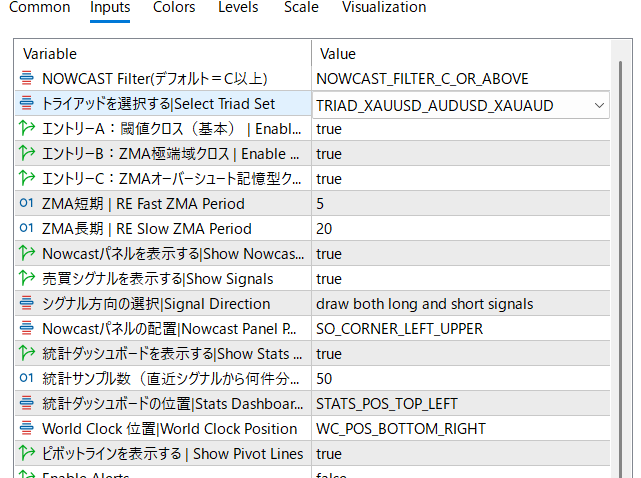
※ The statistical sample size (N) defaults to N=50 to account for response time. If your PC has spare performance, you can increase N from the parameter “Statistical Sample Size” to improve aggregation accuracy (lower it if load is heavy).
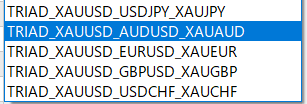
※ Also, this XAUUSD statistical report is calculated by selecting TRIAD_XAUUSD_AUDUSD_XAUAUD (XAUUSD | AUDUSD | XAUAUD) from the five XAUUSD-related triad sets prepared.
SL%: Stop-loss hit rate
TP1〜TP3: Take-profit hit rates (staged attainment)

TP (Take Profit) Definition: Why TP1/2/3?
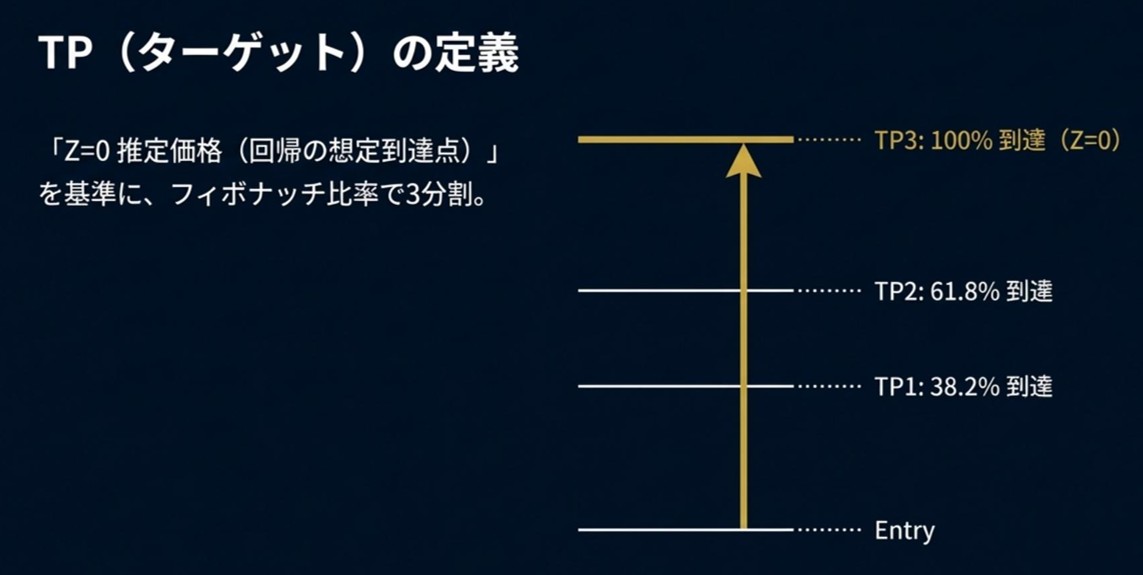
TP is defined as the distance divided into three parts toward the Z=0 estimated price (the projection point for regression), indicating how far back you must go to say “the regression progressed.”Z0 estimated price (regression projected attainment point)Thus the distance is split into three: TP1, TP2, TP3.
TP1: Reaching 38.2%
TP2: Reaching 61.8%
TP3: Reaching 100% (= reaching Z0)
In other words, TP3 is the point where the price has fully retraced, and TP1/TP2 are intermediate stages.
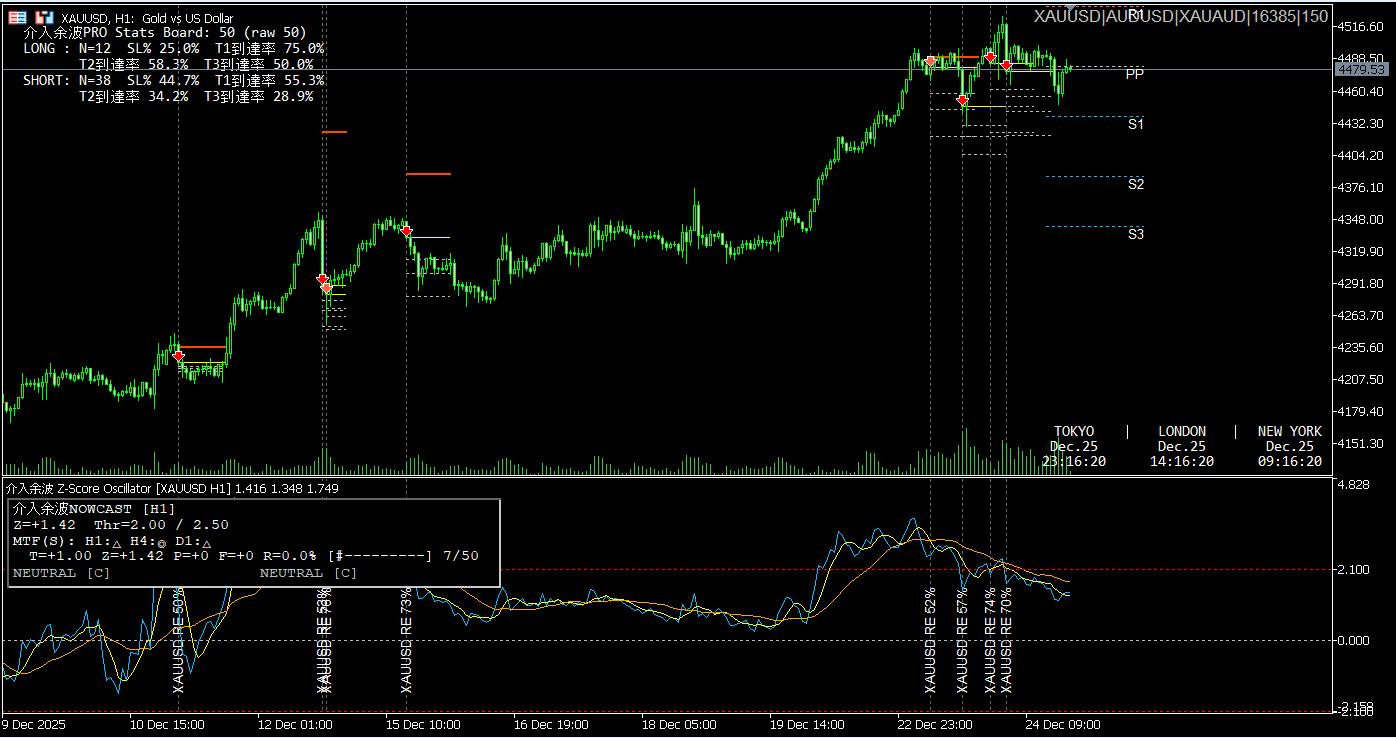
XAUUSD: LONG (Buy) Side Statistics (M1〜D1)
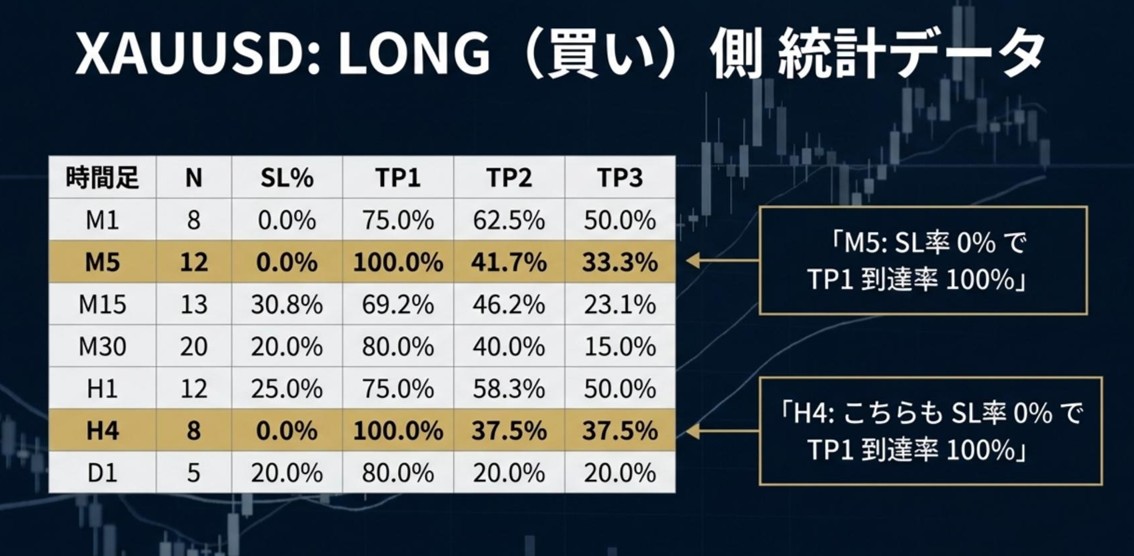
First, the buy side. The simple points to watch are“low-timeframe SL”and“timeframe where TP tends to extend”and consider them separately.
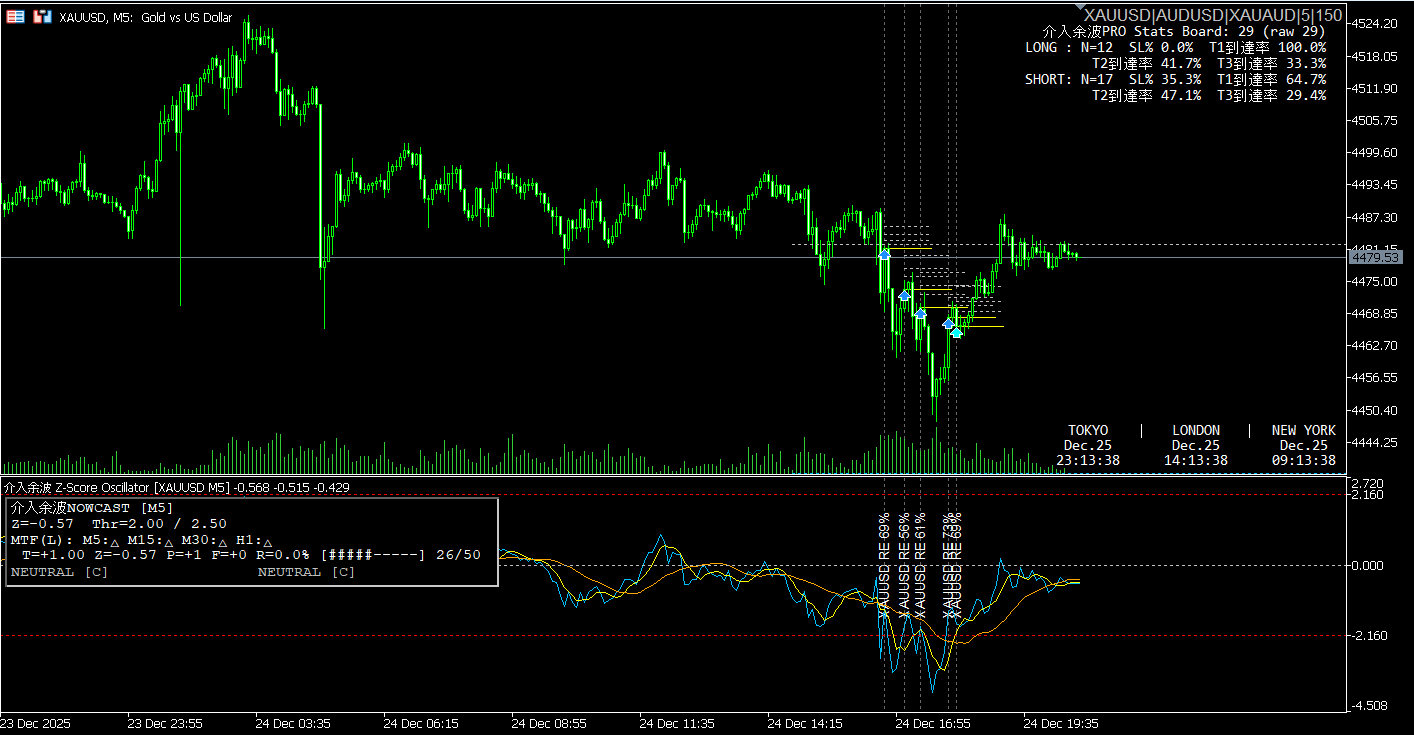
M5: SL rate 0% / TP1 attainment 100%(strong for short-term rebound aiming)
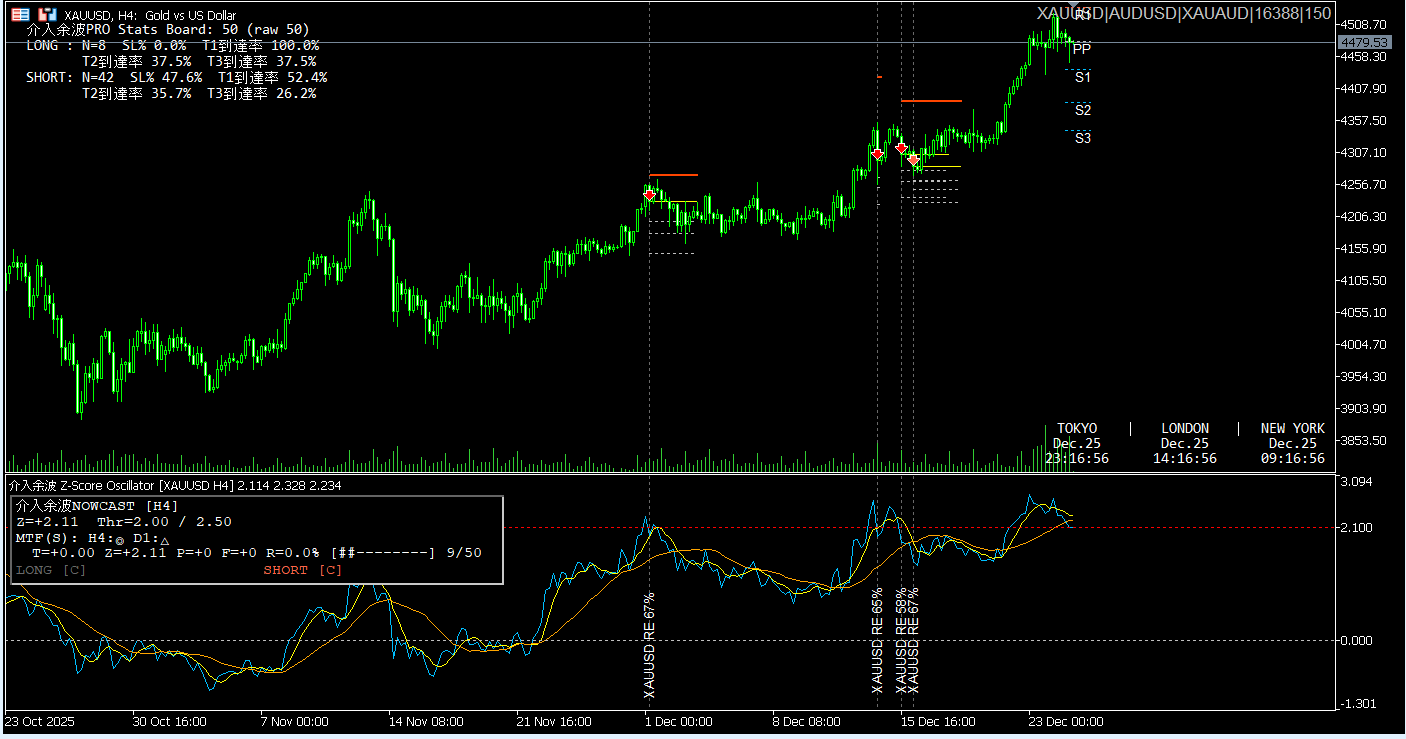
H4: SL rate 0% / TP1 attainment 100%(even on a calmer timeframe, initial regression is easy to catch)
XAUUSD: SHORT (Sell) Side Statistics (M1〜D1)
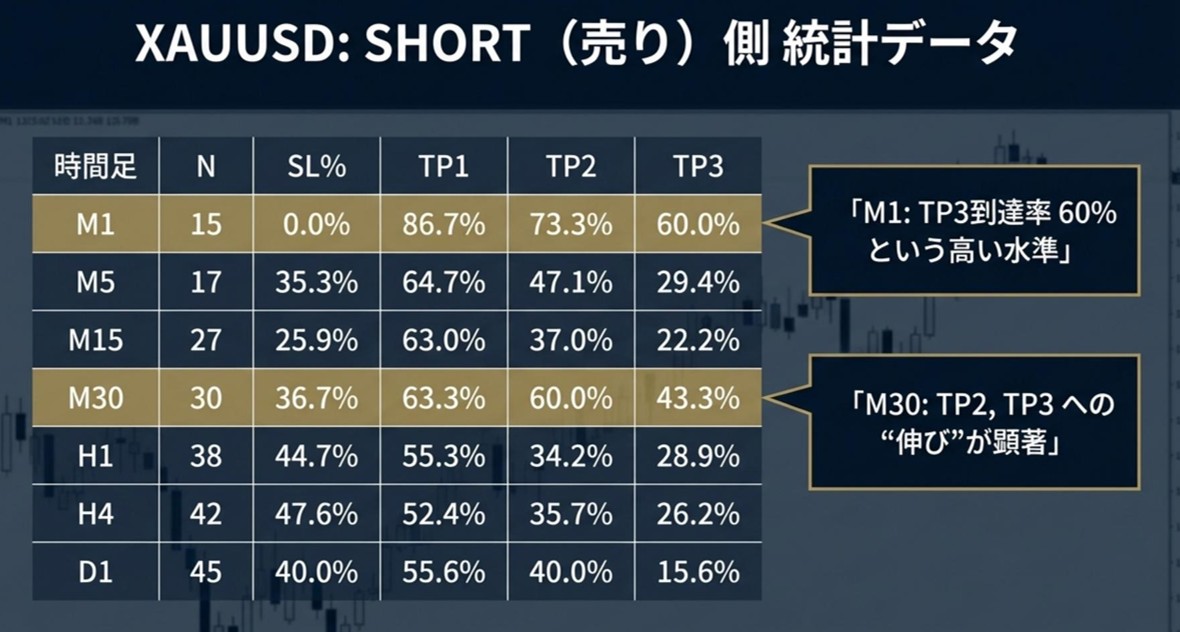
Next, the sell side. Strengths differ between short-term and mid-term.
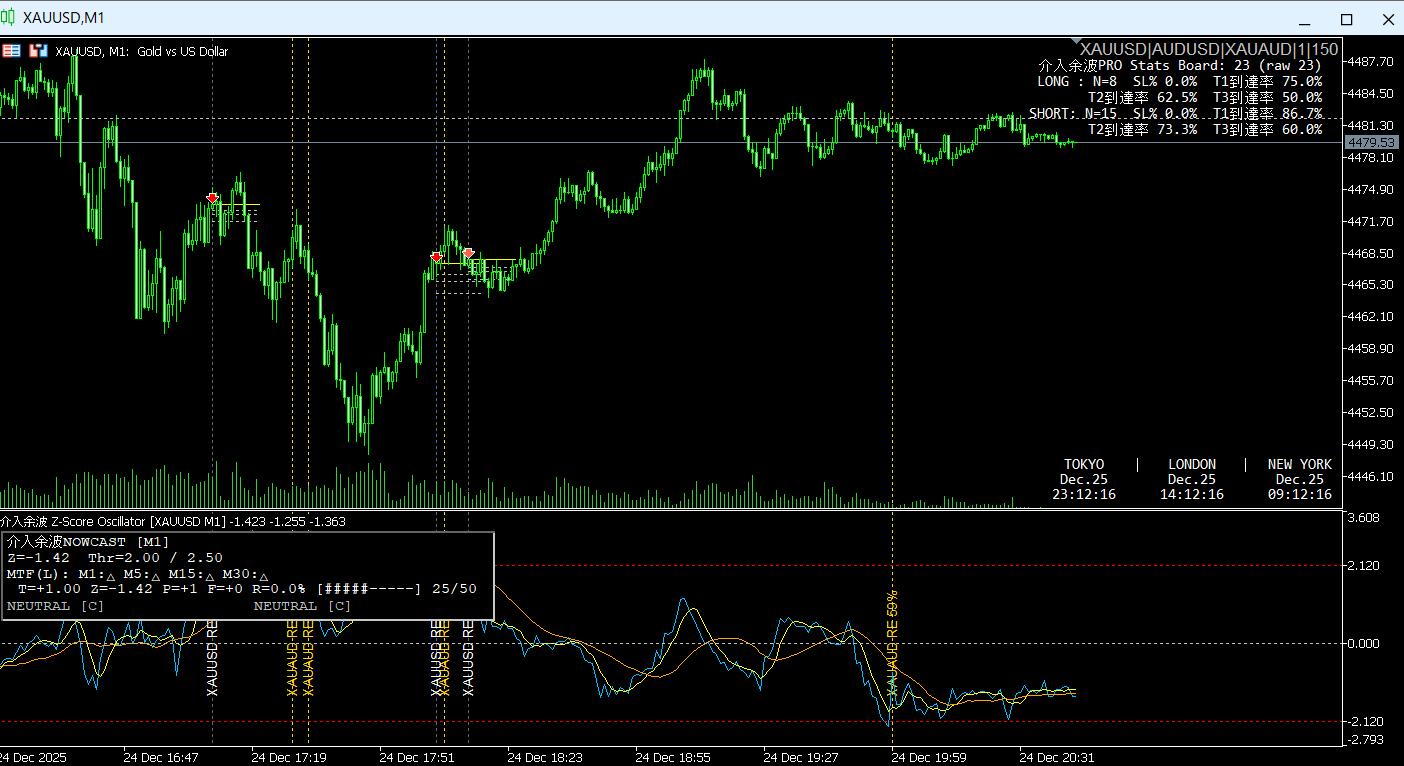
M1: High TP3 attainment rate (60%)
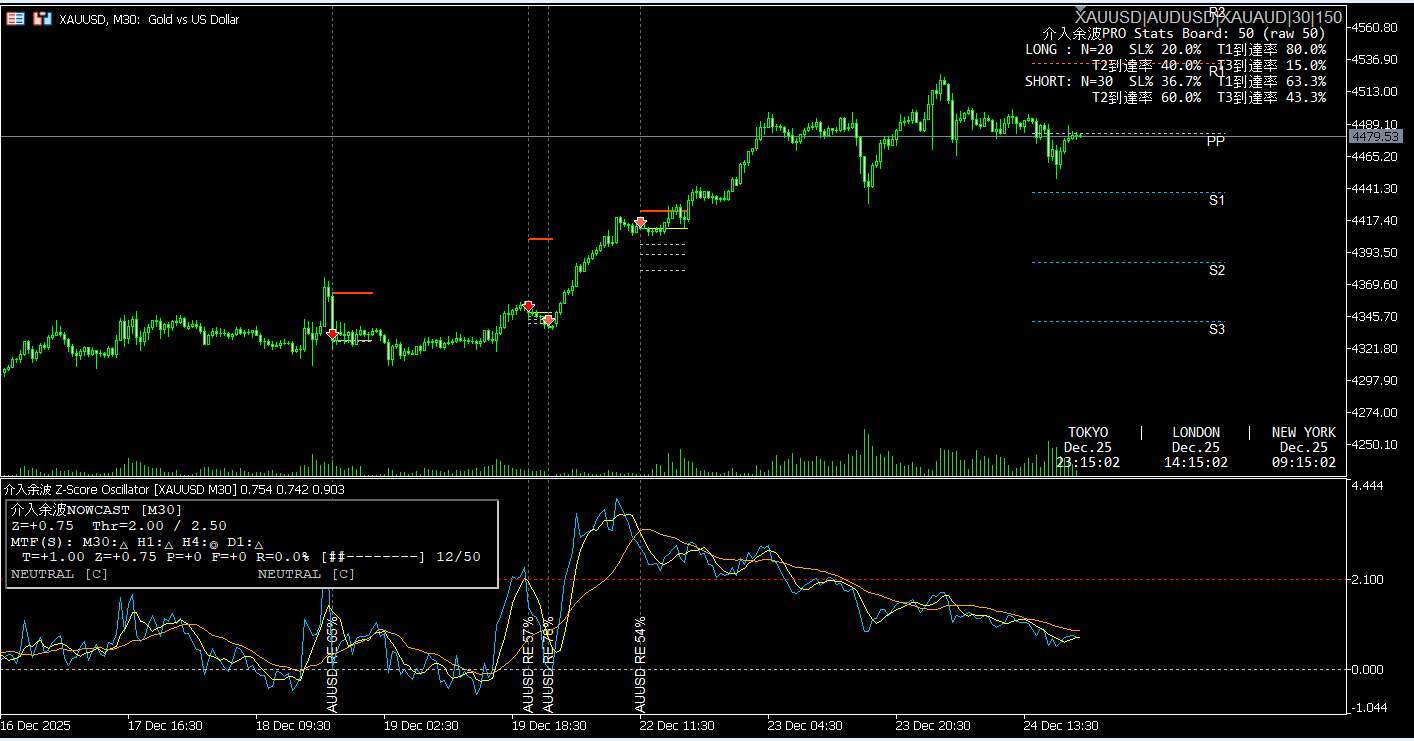
M30: Notable expansion toward TP2/TP3 (TP2 60% / TP3 43.3%)
※However,SL rate is also highso this is not “easy wins,” but“moves up when it moves, but defense is also needed”a reading.
From data, a rough trend
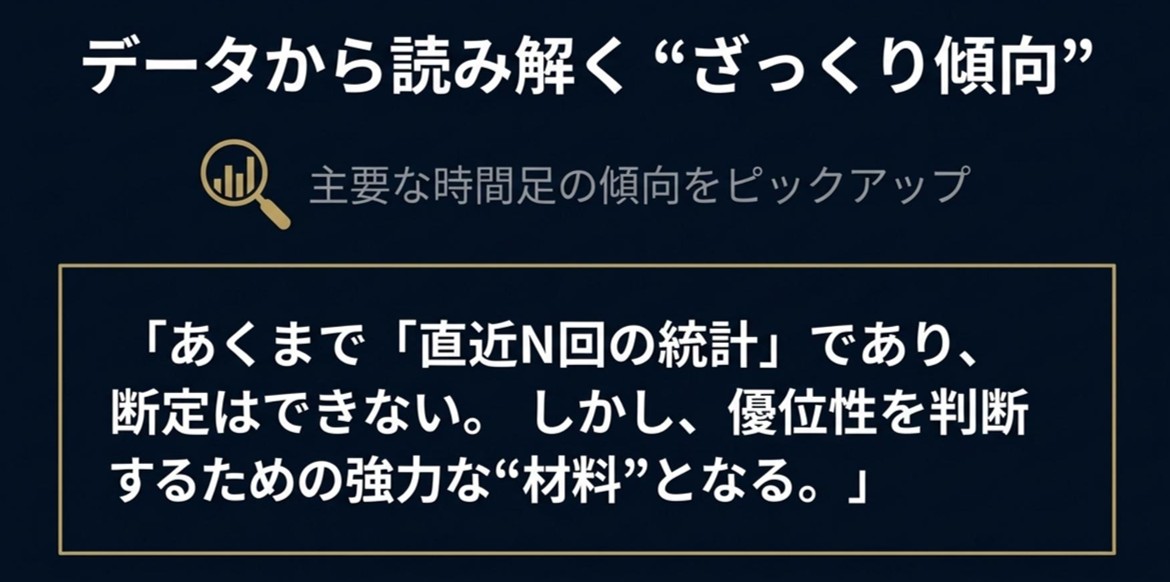
This is important.
Stats Board shows“the most recent N statistics”, so it does not guarantee the future.
However, it provides strong material for judging superiority.
XAUUSD: Key points by timeframe (operational view)
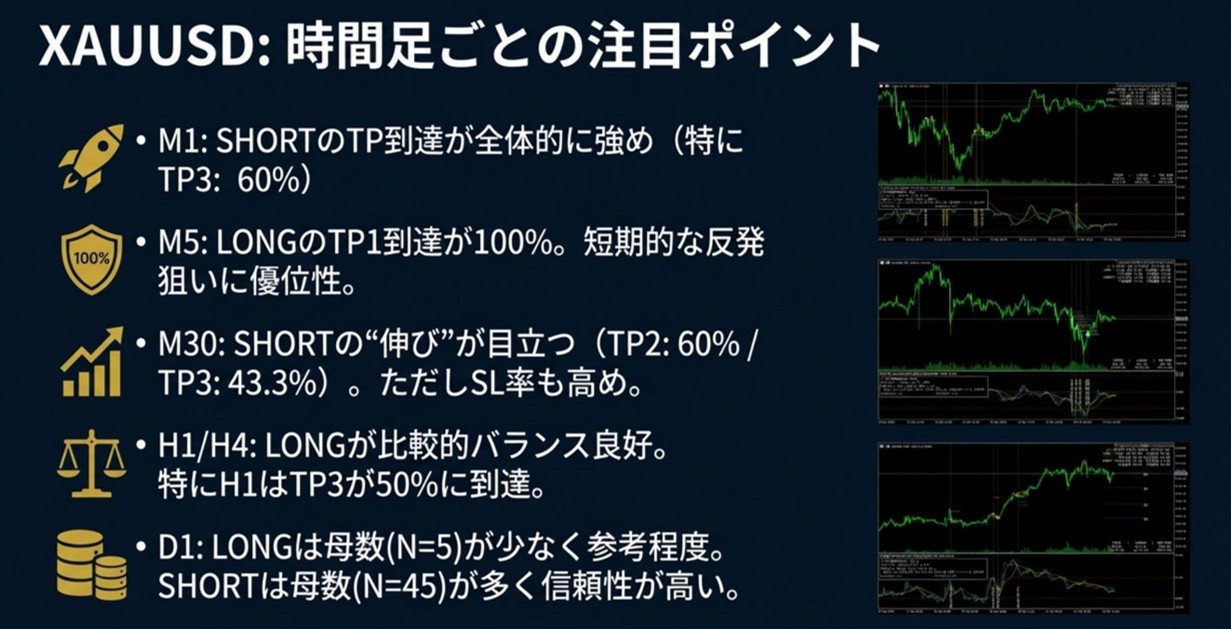
Here, for practical use, only the points are extracted.
M1: Overall stronger shorting TP attainment (especially TP3)
M5: LONG TP1 is 100% (strong for short-term rebound)
M30: SHORT “expansion” stands out (though SL is high)
H1/H4: LONG relatively balanced (H1 also reaches TP3 50%)
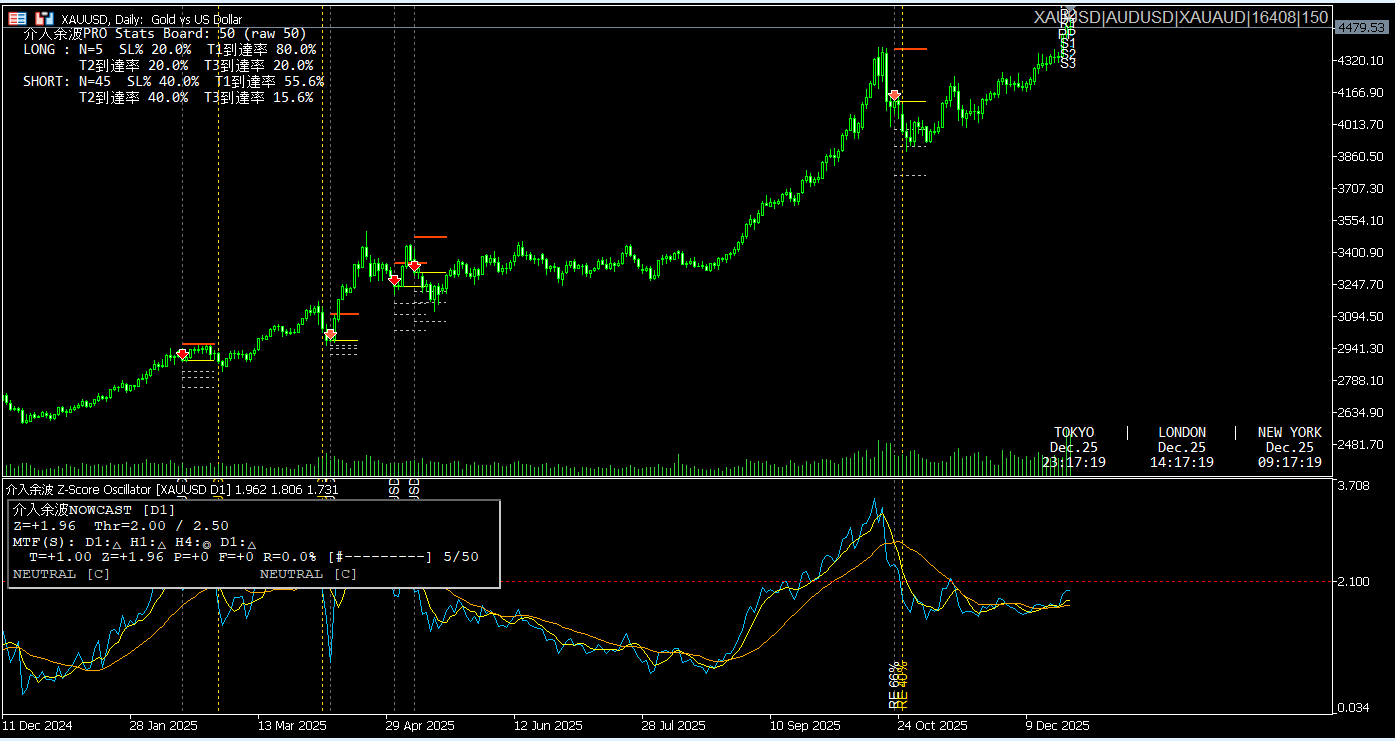
D1: LONG is based on a smaller sample and is for reference; SHORT has more samples and is easier to read
Behind the signals: three entry logics (A/B/C)
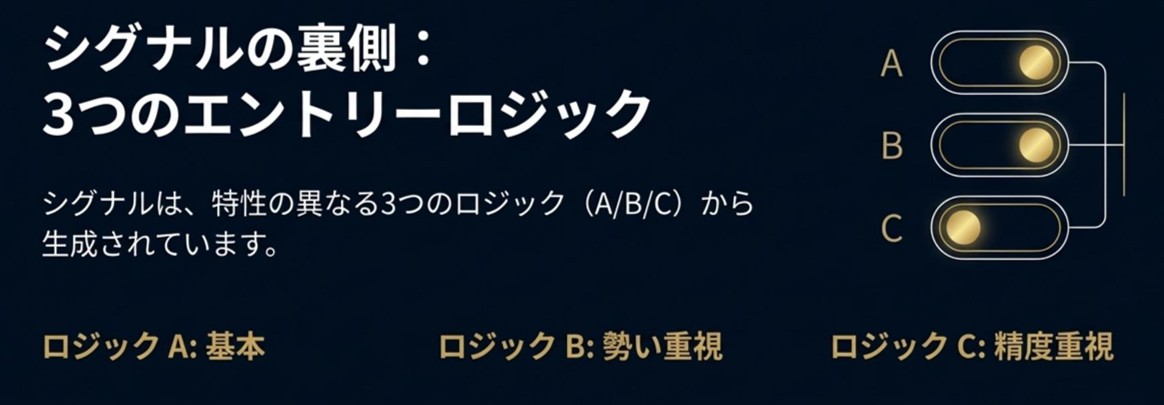
Intervention Aftermath PROsignals are generated fromthree logics with different characteristics (A/B/C).
They can be turned ON/OFF individually according to your strategy, allowing adjustments for frequency versus precision.
Characteristics of Logics A & B (“Basics” and “Momentum Reversal”)
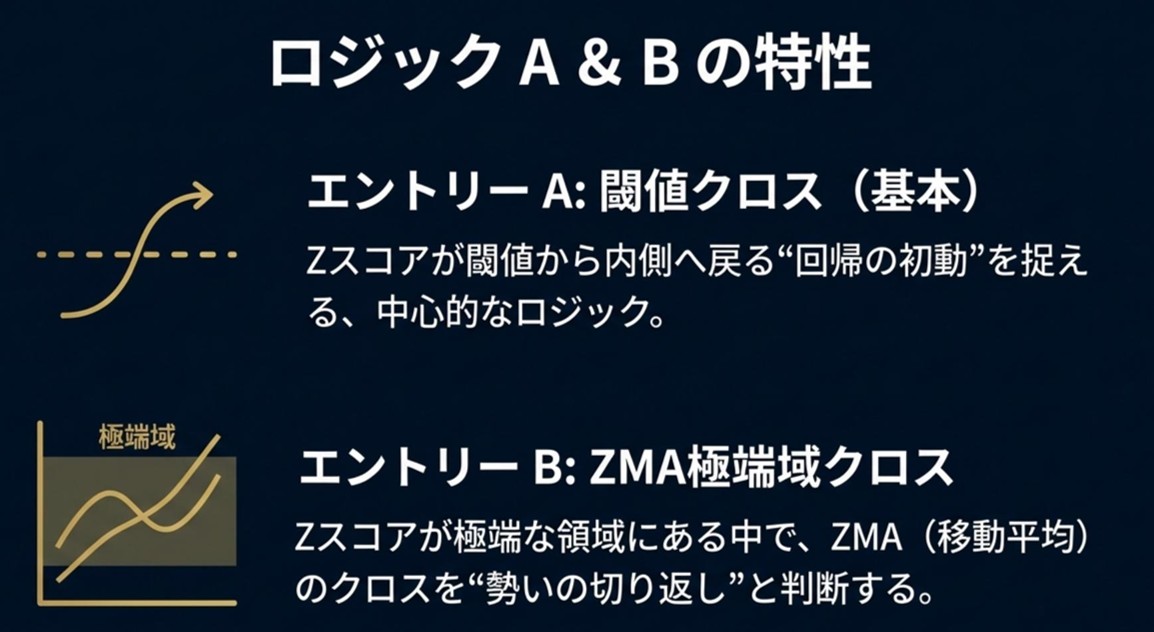
Entry A (Threshold Cross): the central logic to capture the initial regression
Entry B (ZMA Extreme Zone Cross): emphasis on reversal at extreme zones (momentum reversal)
Characteristic of Logic C (“Memory-based with emphasis on precision”)
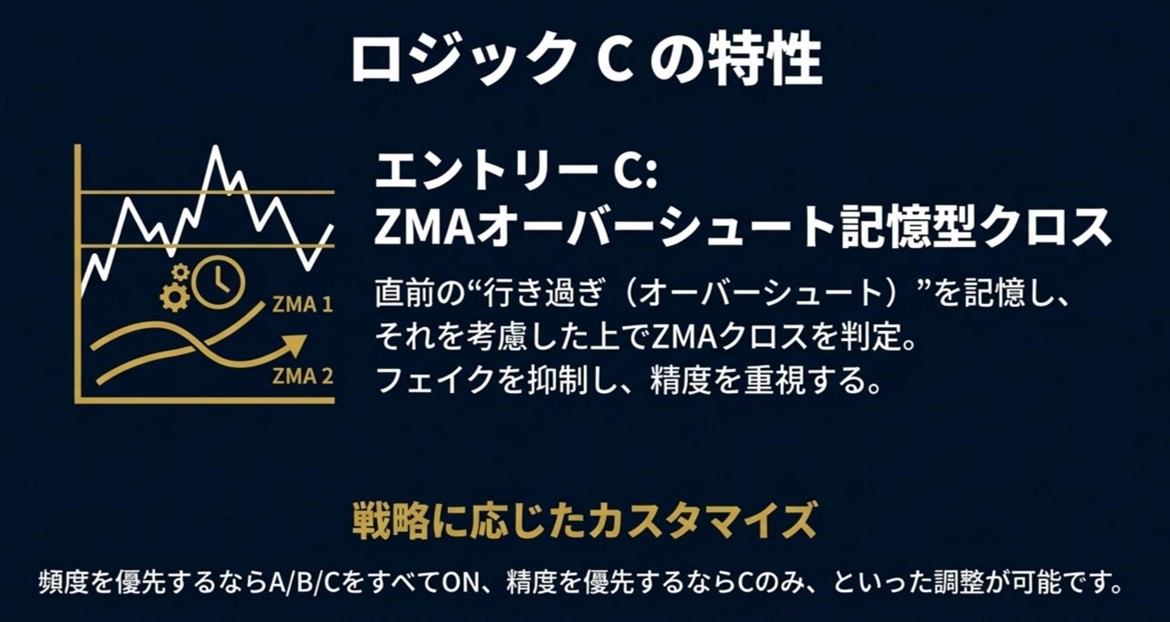
Entry C (ZMA Overrun Memory-type Cross)
A method that remembers the prior overshoot to judge and suppresses fakes to sharpen accuracy.
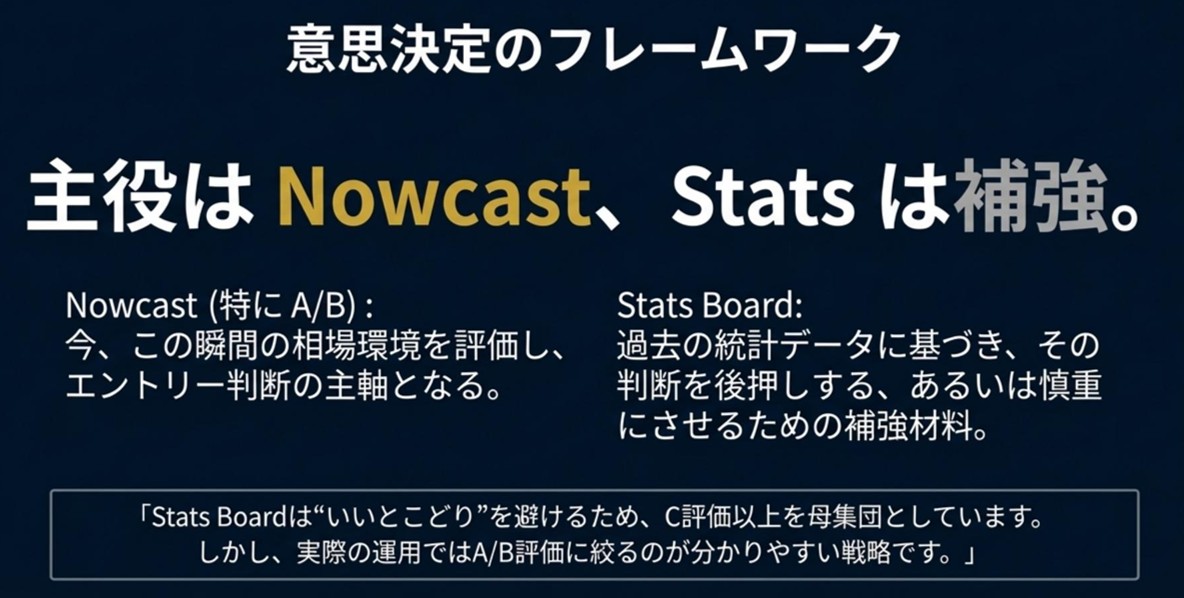
Decision-making framework: Nowcast is the lead, Stats reinforces
Mastering this makes operation much easier.
Lead: Nowcast (especially A/B)→ Decide now whether to act or wait in the current market environment.
Reinforcement: Stats Board→ Reinforce decisions with past trends (ease of attainment / likelihood of stop loss).
※ To avoid cherry-picking, Stats is aggregated at C or higher. In practical use, focusing onA/B is the clearer strategy.
Scanner + AI Report: Integrating Technical and Fundamentals in one move
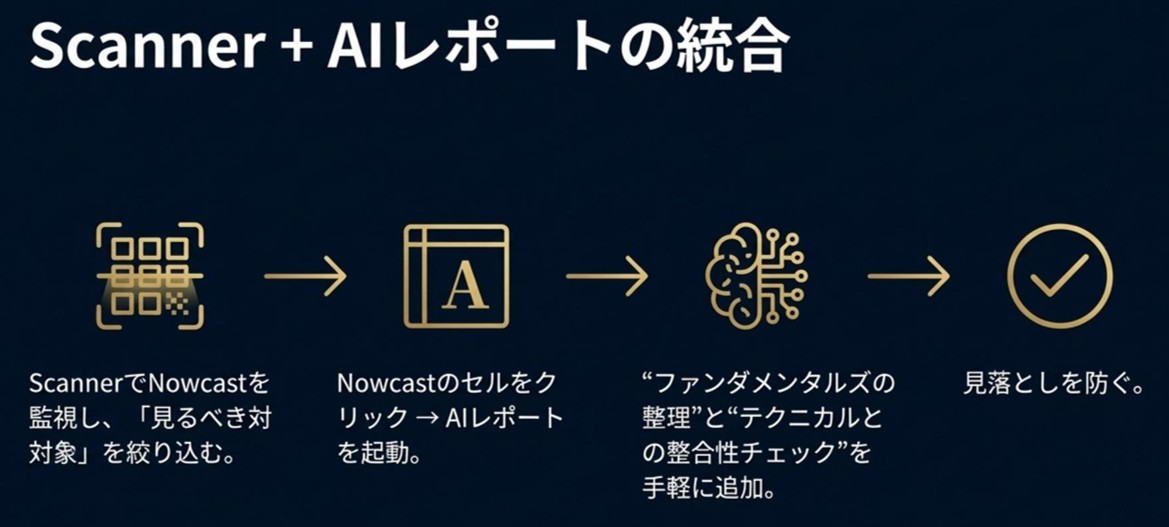
Scanner allows you to narrow down the targets to watch by Nowcast. Additionally (as a subscription feature)Clicking the Nowcast cell outputs a prompt for an AI report, and for the technical side (distortion/Nowcast) you canorganize and cross-check fundamentals in one step.
Recommended decision flow (order to avoid hesitation)
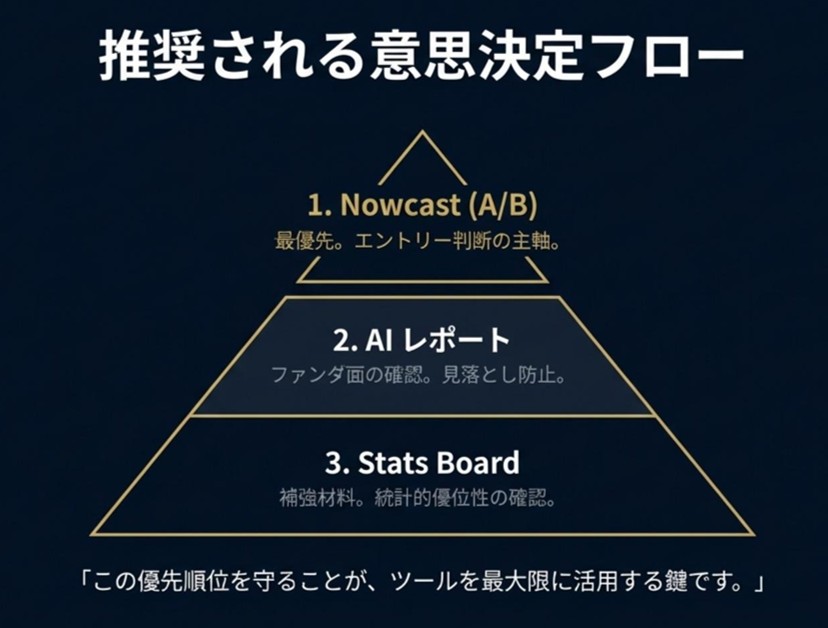
The recommended order is as follows.
Nowcast (A/B): Top priority. The core of entry decisions
AI Report: Prevent missing fundamentals / ensure consistency
Stats Board: Reinforce with statistics (or use as a cautious input)
Summary: Make statistics your weapon. The final judgment is by the trader.

What the tools provide is data.Capture the “now” with Nowcast and confirm “past trends” with Stats.Just having these two together raises the quality and speed of your judgments.
Product page:https://www.gogojungle.co.jp/tools/indicators/72398
Subscription version:https://www.gogojungle.co.jp/tools/indicators/74010
Disclaimer
This article is for information purposes and does not advocate any specific trading actions. Market movements can lead to losses. Please make final investment decisions at your own risk.